Bitcoin Miners Are Becoming AI Landlords. Here's What That Means for Hashrate.
The pivot is real, the deals are signed, and the implications for mining economics are bigger than most people realize.

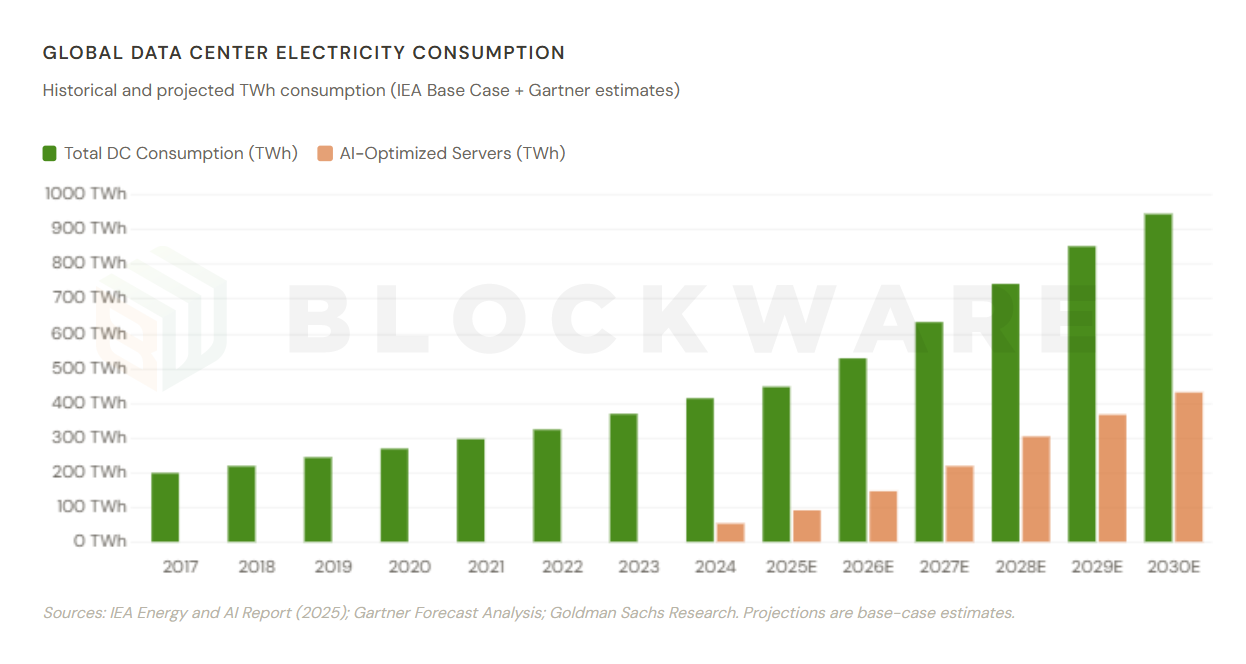
The scale of what is happening in data center infrastructure is difficult to overstate. Global electricity consumption by data centers is projected to more than double from 415 TWh in 2024 to 945 TWh by 2030, equivalent to the entire annual electricity demand of Japan today. The IEA, Gartner, and Goldman Sachs are all pointing in the same direction: this is not a cyclical buildout, it is a structural rebuilding of the global economy around compute.
The orange bars tell the sharper story within the story. AI-optimized server electricity usage alone is expected to grow nearly fivefold by 2030, from 93 TWh in 2025 to 432 TWh. That single subcategory will represent nearly half of all data center power demand by the end of the decade. The capital flowing into this infrastructure is pre-leased, contracted, and anchored by hyperscaler demand that has no viable alternative. For operators with access to power, land, and capital, the window is open, but not indefinitely.
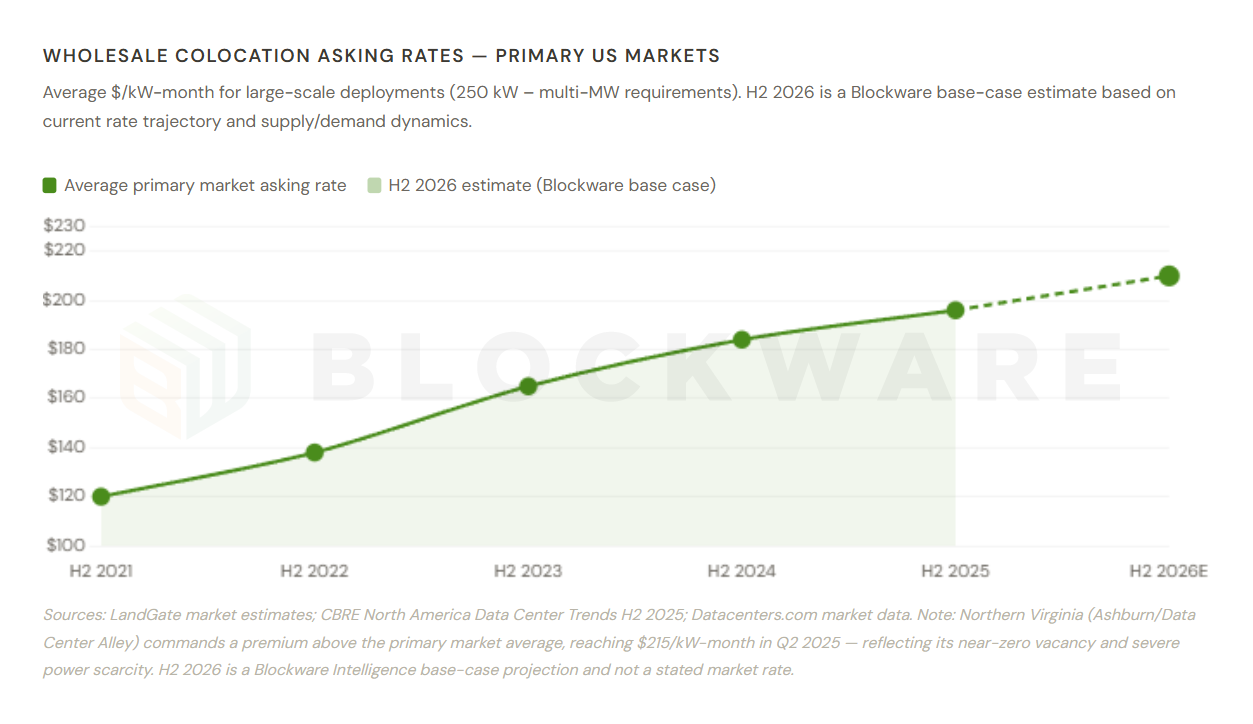
Wholesale Colocation Asking Rates
The price of a megawatt has never been higher, and it is still rising. Average wholesale colocation asking rates in primary U.S. markets have gone from $120/kW-month in H2 2021 to $196/kW-month in H2 2025, a 63% increase in four years. Our base-case estimate puts the trajectory continuing toward $210/kW-month by H2 2026 as supply constraints in every major market remain structurally unresolved. Northern Virginia, home to the world’s most densely interconnected data center cluster in Ashburn, is already at $215/kW-month, the highest rate ever recorded in any U.S. market.
The important context for Bitcoin miners: converting to annual per-megawatt terms, a $200/kW-month rate implies $2.4M in annual revenue per MW of contracted capacity. A 100 MW facility at that rate generates $240M per year, before power pass-through revenue, against well under $100M in gross revenue from Bitcoin mining at current economics. That gap is the core economic logic behind every miner-to-HPC pivot you have seen over the past 18 months.
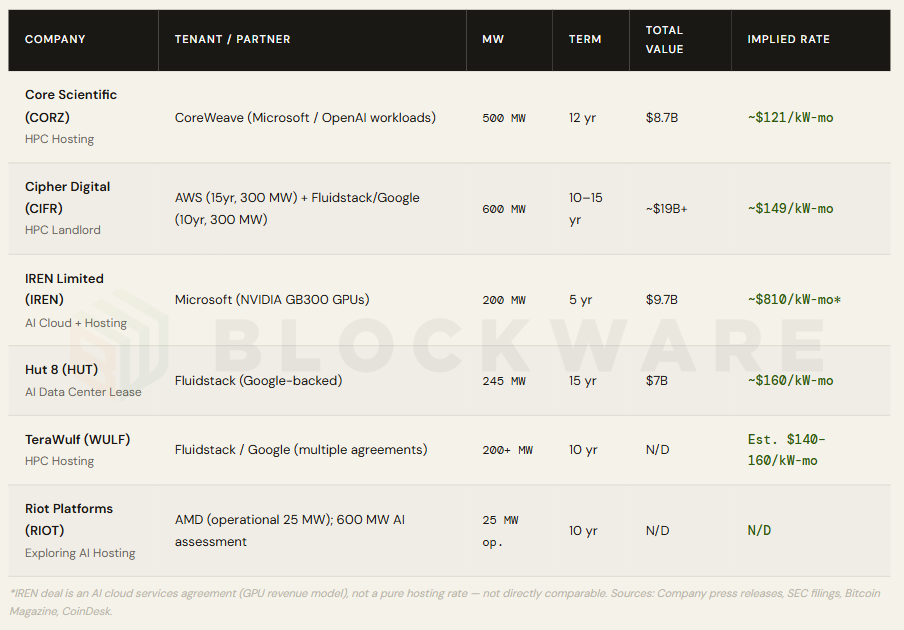
Publicly Disclosed Miner-to-AI Deals
This table represents the deal landscape as it actually exists today, not as it has been hyped. Core Scientific locked in 500 MW with CoreWeave at approximately $121/kW-month over 12 years, $8.7B in contracted revenue. Cipher Digital followed with 600 MW split between AWS and Fluidstack/Google at approximately $149/kW-month, totaling more than $19B. Hut 8 signed a 15-year, 245 MW lease with Fluidstack at roughly $160/kW-month for $7B. The pattern is clear: multi-hundred MW commitments, decade-plus durations, and hyperscaler-grade counterparties.
Two things stand out beyond the headline numbers. First, the companies that moved earliest locked in rates that are now meaningfully below current market. Core Scientific’s $121/kW-month is roughly $75–80/kW-month below where new deals are being priced today. First-mover advantage in this market is not a buzzword; it is tens of millions of dollars per year in contracted revenue that latecomers cannot capture retroactively. Second, the asterisk on IREN’s deal is worth understanding: their $810/kW-month implied rate reflects an AI cloud services agreement where they own the GPUs and sell compute time, not a pure infrastructure hosting deal. It is a fundamentally different risk-return profile than the landlord model.
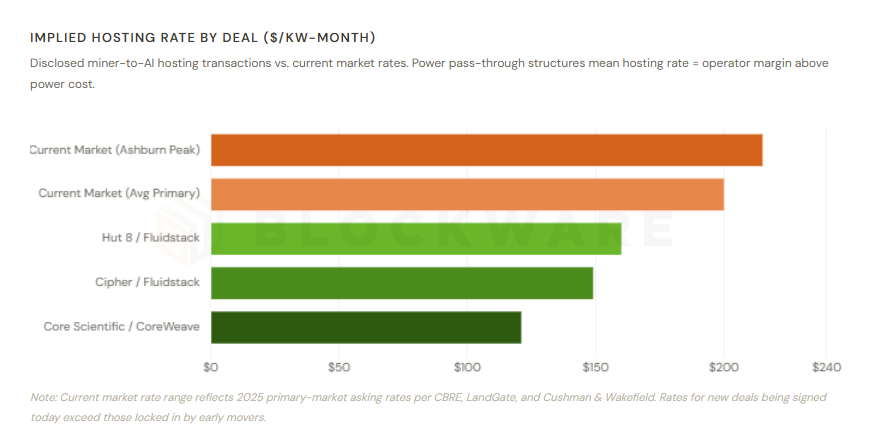
Implied Hosting Rate by Deal
Reading this chart from top to bottom tells the whole competitive story. The current Ashburn market peak of $215/kW-month sits at the far right. Core Scientific’s CoreWeave deal, struck in 2024, sits at $121/kW-month. The gap between those two numbers, roughly $94/kW-month, represents the market appreciation that has occurred since the first major miner-to-AI deal was signed. On a 100 MW facility, that gap equates to approximately $113M per year in forgone revenue.
This is why JPMorgan, in upgrading Cipher and IREN in late 2025, focused so heavily on contracted revenue as a valuation anchor. The landlord model with a long-duration, power-pass-through lease to a creditworthy hyperscaler converts a volatile mining operation into something that trades more like infrastructure. The rate you lock in today determines the economics for the next decade. Every month of delay is a month of appreciation at the market rate that a new deal will never recapture.
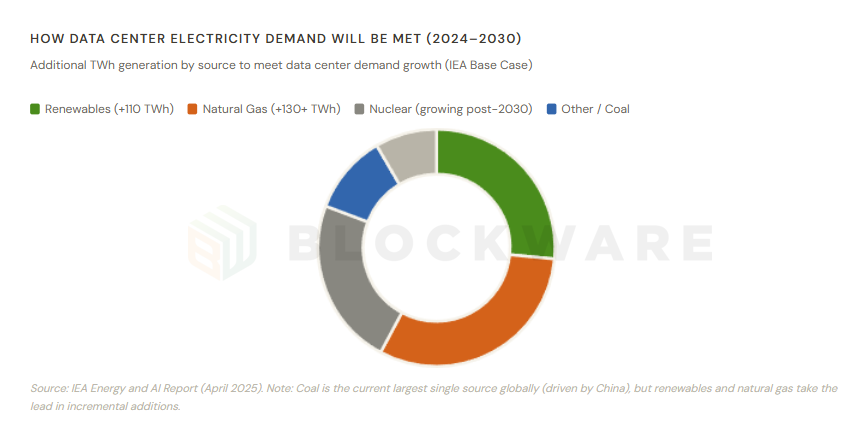
How Data Center Electricity Demand Will Be Met (2024–2030)
The power required to run AI infrastructure has to come from somewhere, and the IEA’s breakdown of incremental supply sources is instructive. Renewables lead with approximately 110 TWh of additional generation, driven primarily by wind, solar, and corporate PPA strategies from hyperscalers. Natural gas follows closely at 130+ TWh, the fastest-to-deploy dispatchable source in most markets. Nuclear plays a smaller role through 2030 but is set to accelerate meaningfully as the first small modular reactors come online, supported by more than 20 GW of planned SMR financing from technology companies.
The takeaway for investors is not which energy source wins; it is that power delivery, not land or capital or even demand, has become the binding constraint. Data center vacancy in primary U.S. markets sits at 1.6%, an all-time low. Interconnection queues in constrained markets now extend beyond eight years. Operators who already hold permitted, connected power, precisely the position Bitcoin miners built for themselves over the prior decade, are structurally advantaged in a way that cannot be quickly replicated by new entrants regardless of how much capital they have.
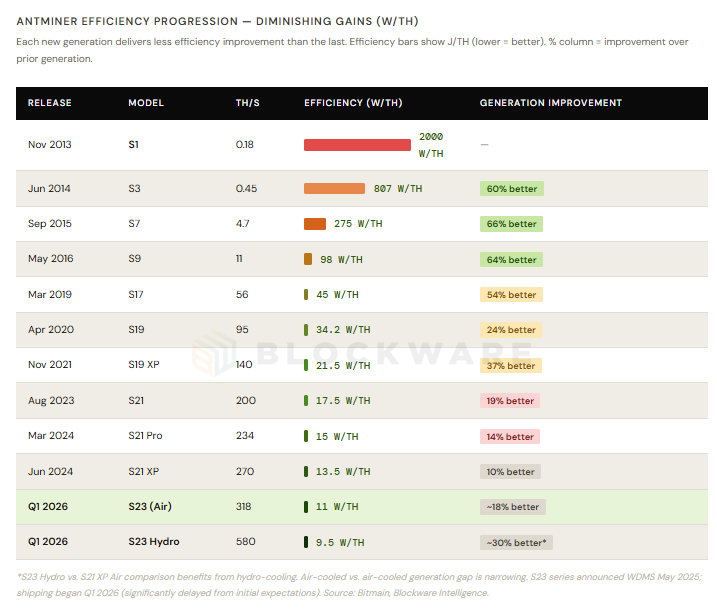
Antminer Efficiency Progression
This table is one of the most important data sets in Bitcoin mining, and it rarely gets the attention it deserves. The efficiency gain from S1 to S3 was 60%. S3 to S7 was 66%. S9 to S17 was 54%. By the time you reach the S21 XP, the generation-over-generation improvement had compressed to 10%, the smallest air-cooled gain on record at the time. The S23 Air, shipping now after an eight-month delay from announcement, offers roughly 18% improvement over the S21 XP. That sounds reasonable in isolation. In context of the trend, it is further confirmation that ASIC hardware is commoditizing.
The implications of diminishing efficiency gains compound in ways that are not immediately obvious. When improvements were large, new machines rapidly made older hardware uneconomical, forcing rapid fleet turnover and driving accelerating hashrate growth. As gains compress, older machines stay competitive longer. The competitive lifespan of an S21 XP today is materially longer than the competitive lifespan of an S9 was when the S17 arrived. For low-cost miners running well-positioned fleets, this is quietly favorable. For the hashrate growth outlook, it means the hardware upgrade cycle is no longer a reliable driver of rapid network expansion.
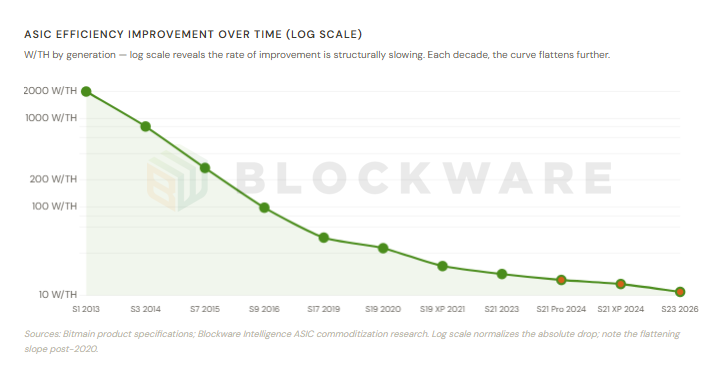
ASIC Efficiency Over Time (Log Scale)
The log scale on this chart is deliberate; it is the only way to fairly visualize a curve that drops from 2,000 W/Th in 2013 to 11 W/Th today. On a linear scale, the recent improvement would look nearly flat, and on a log scale, you can see that it genuinely is flattening. The slope of efficiency improvement that characterized the S1-through-S9 era simply does not exist anymore.
What is driving this, beyond the physics of semiconductor miniaturization? TSMC, the world’s dominant advanced foundry, now allocates approximately 28% of its total wafer capacity to AI chip production. NVIDIA has secured a dominant share of TSMC’s most advanced packaging slots, with reports suggesting over 70% of CoWoS capacity reserved during peak allocation cycles. Bitcoin ASIC manufacturers, Bitmain, MicroBT, and Canaan, are competing for foundry capacity against NVIDIA, AMD, Broadcom, and hyperscaler custom silicon programs. The revenue-per-wafer from an AI GPU is multiples higher than from a Bitcoin ASIC. Foundries allocate to their highest-value customers. The result: ASIC lead times are extending, generation cadences are stretching, and efficiency gains are arriving later and smaller than at any prior point in Bitcoin’s history.
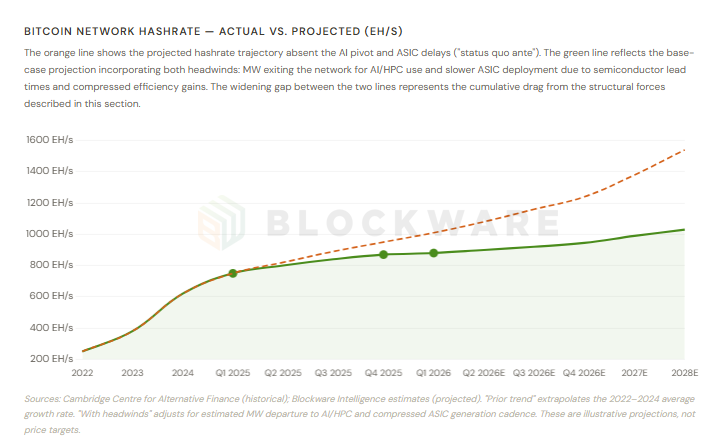
Bitcoin Network Hashrate Projection
This chart shows two futures diverging from Q1 2026 onward. The orange dashed line extrapolates the prior-cycle growth rate, absent any structural disruption. The green line incorporates what is actually happening: hundreds of MW of mining capacity being physically converted to AI/HPC use, and a slower ASIC deployment cadence driven by foundry deprioritization and compressed efficiency gains. The widening gap between those two lines is the cumulative drag from forces that are structural, not cyclical.
The counterintuitive implication is worth stating plainly: for low-cost Bitcoin miners who are not pivoting to AI, this is a tailwind. When hashrate growth slows or reverses, each remaining miner captures a larger share of the block reward without deploying additional capital. The difficulty adjustment mechanism ensures that a smaller network hashrate directly improves economics for those who remain. Small-to-mid sized miners, who typically lack the land scale, power interconnect size, and institutional balance sheet required to attract hyperscaler tenants, cannot access the AI pivot, but they do not need to. Every megawatt that leaves the Bitcoin network for an AI data center makes their existing operations more valuable.
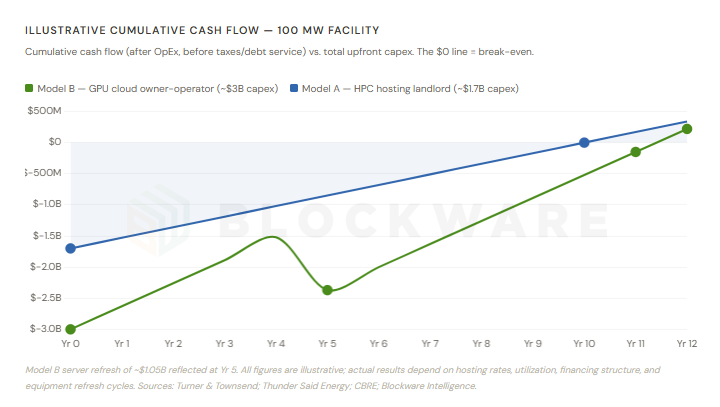
Illustrative Cumulative Cash Flow: 100 MW Facility
This chart is the most important reality check in this report. AI data center ROI is real, but it is back-weighted in a way that demands clear-eyed capital planning. Model A, the pure HPC hosting landlord at roughly $167/kW-month with power costs passed through, generates approximately $150–170M in annual cash flow on a $1.7B facility. The math works. The payback period is approximately 10 years. Model B, the GPU cloud owner-operator who owns the servers and sells compute time, has a higher revenue ceiling but a dramatically steeper capex requirement approaching $3B, and faces a sharp cash flow dip at Year 5 when a full GPU server refresh is required before the original investment has paid back.
The most important sentence in this analysis: the highest returns in this environment will accrue to operators who locked in low-cost power positions years ago and are now converting that infrastructure to AI hosting at 2025–2026 market rates. A miner converting an already-depreciated 100 MW facility enters this equation with a cost basis that no greenfield builder can replicate today, at any price. That structural advantage, not the raw hosting rate, is the actual source of alpha in the miner-to-AI pivot. For everyone else evaluating this space as a new entrant, the payback timelines shown here should be the starting assumption, not the optimistic case.
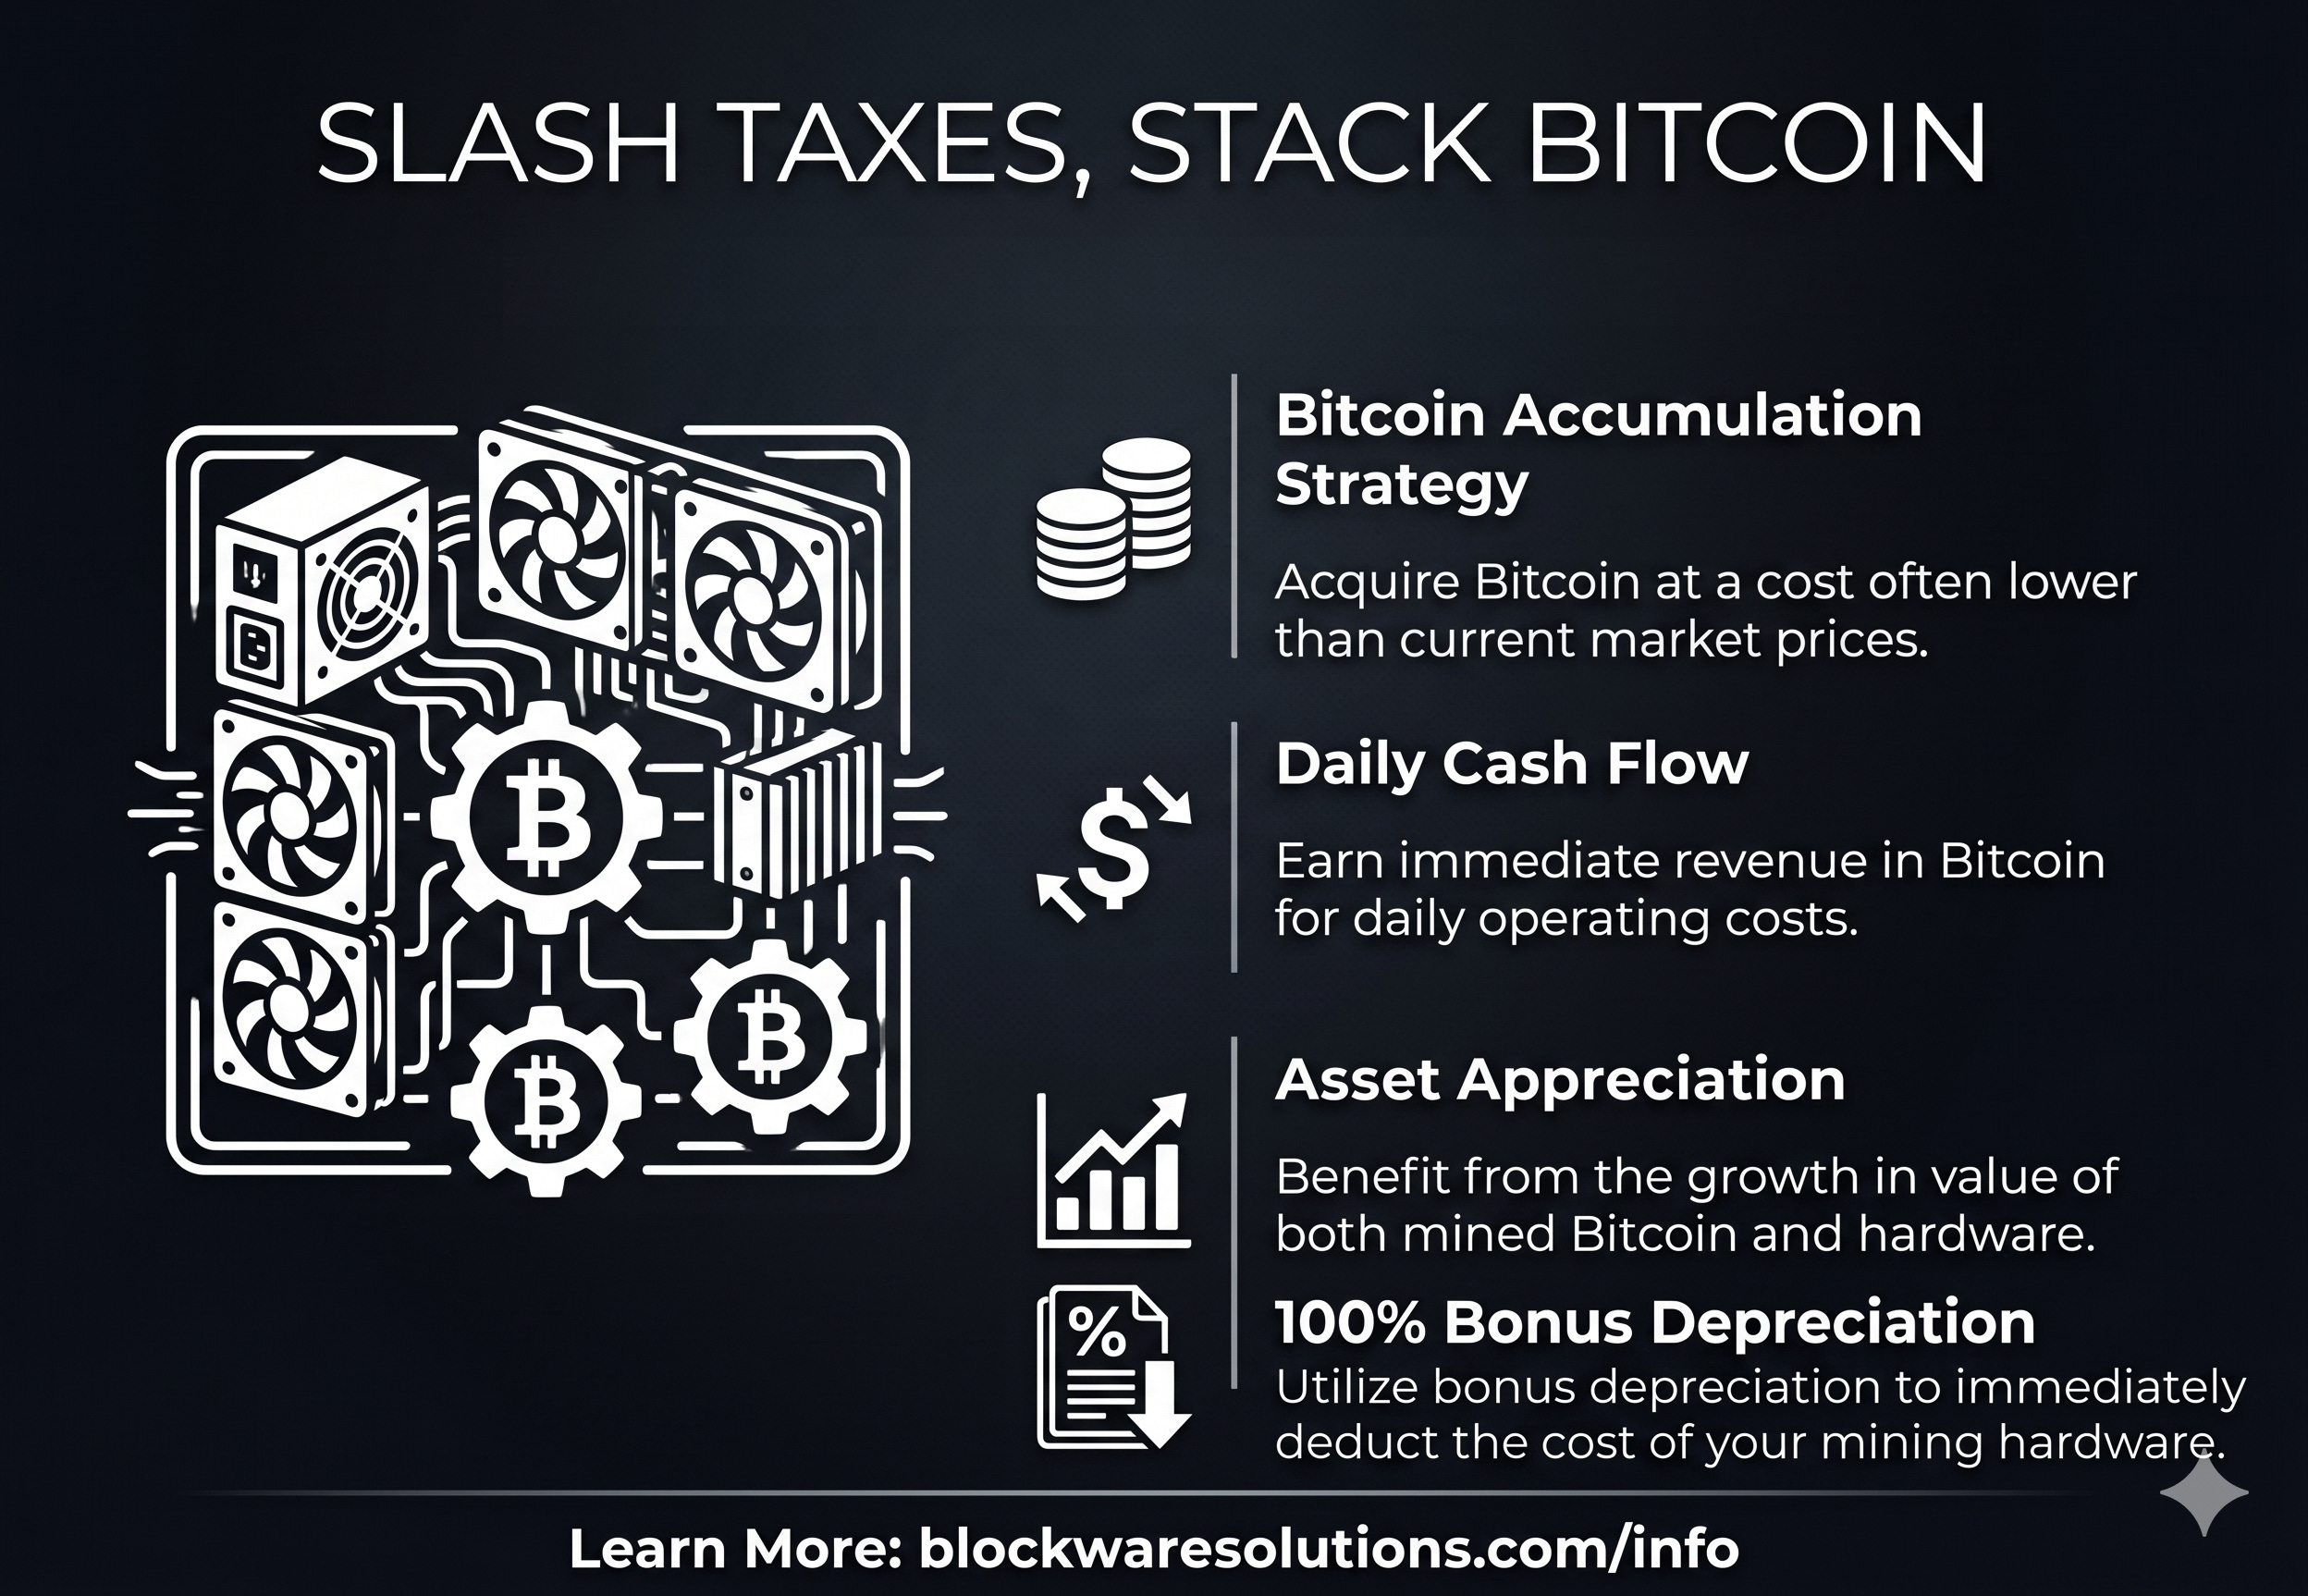
Stack Bitcoin, Slash Taxes
There has never been a better time to deploy capital into Bitcoin mining, and the tax advantages available right now make the decision even more compelling. Under current U.S. tax law, Bitcoin mining hardware qualifies for 100% Bonus Depreciation, meaning the full cost of your machines can be deducted in year one. For high-income individuals, family offices, and businesses with meaningful tax liability, this is one of the most powerful accelerated depreciation opportunities available in any asset class today.
While large-scale miners convert megawatts to AI hosting and ASIC lead times extend, the miners who stay the course are quietly inheriting a less competitive network. Lower difficulty, longer machine lifespans, and a shrinking hashrate base all work in your favor. Blockware handles the infrastructure, the power contracts, and the operations. You own the machines and the Bitcoin they produce.
https://www.blockwaresolutions.com/info/