Blockware Intelligence Newsletter: Week 73
Bitcoin on-chain analysis, mining analysis, macro analysis; overview of 1/28/23-2/3/23
Blockware Intelligence Sponsors
If you are interested in sponsoring Blockware Intelligence email: sponsor@blockwaresolutions.com.
Blockware Solutions - Buy and host Bitcoin mining rigs. Bulk purchase the brand new S19J Pro+ from Blockware at a price below directly ordering from Bitmain. Limited remaining supply.
Summary:
Blockware Intelligence released a new report: “Ranking Public Bitcoin Miners - A framework to quantify the liquidity, solvency and profitability of publicly traded Bitcoin miners”
Personal Consumption Expenditures growth came in at 5.0% YoY and Core PCE came in at 4.4% YoY for the month of December.
FOMC increased the Fed Funds Rate by 0.25% on Wednesday.
Bitcoin remains range bound, however a clean break above $24k or below $22.5k would signal the likely direction of the next move.
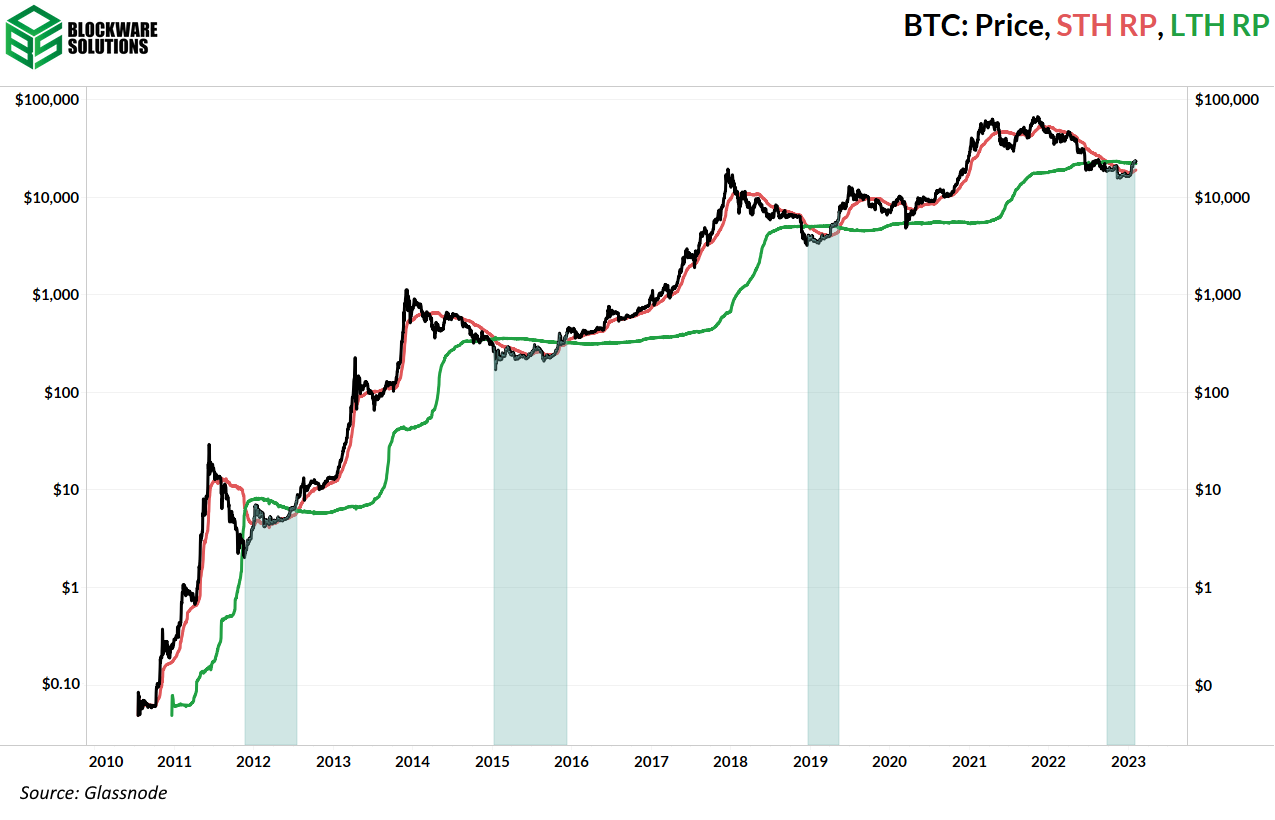
BTC has found support at the Long Term Holder Realized Price.
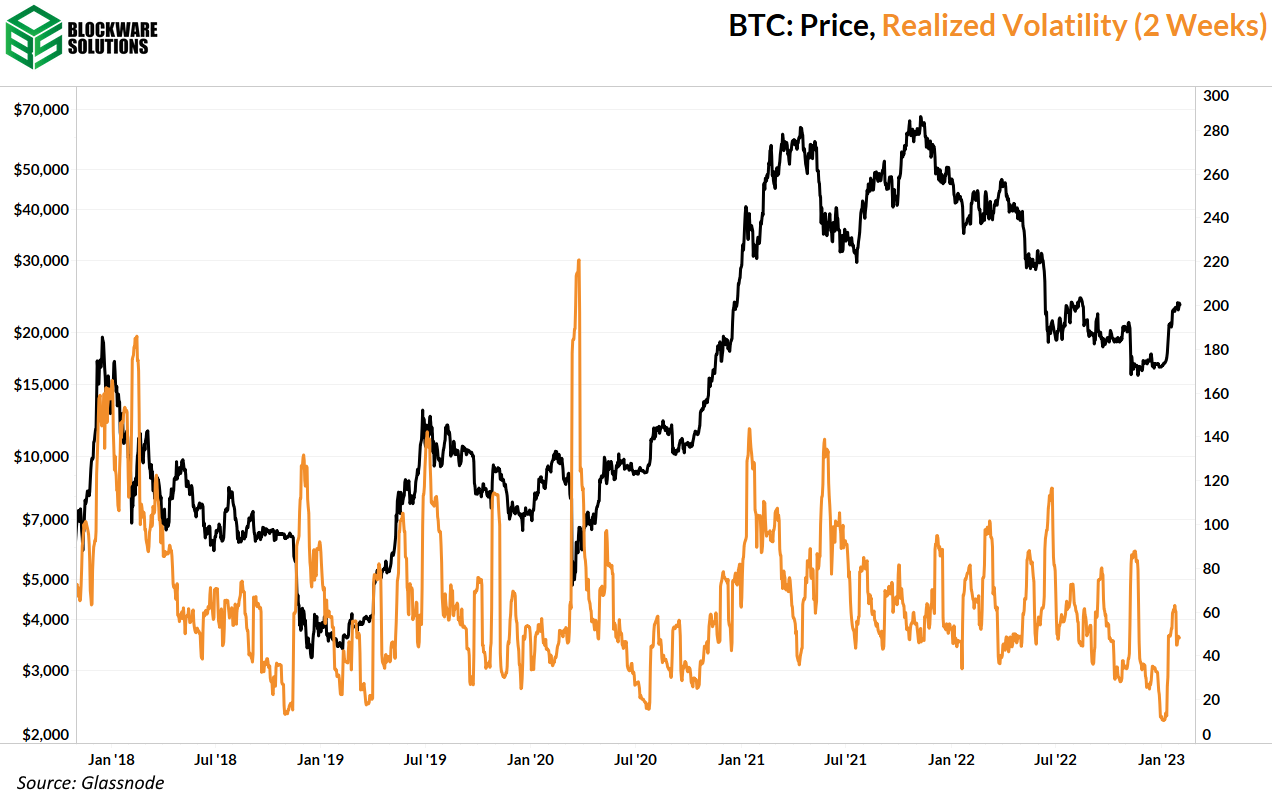
Bitcoin realized volatility is in decline despite the FOMC meeting, which has typically been a catalyst for heightened volatility.
Bitcoin has now passed LTH Realized Price and STH Realized Price.
A lack of an increase in unique addresses withdrawing from exchanges signals that the price jump was driven by a lack of sell-side pressure, not a massive increase in new buyers.
Perpetual futures open interest and the percent of futures contracts margined with crypto both indicate traders are still in “risk-off” mode.
Ordinals (NFTs) are now on Bitcoin, and miners have another potential revenue source from block space demand.
Energy Gravity sits at $0.13, up ~ $0.01 from last week, indicating that miners are feeling a sigh of relief.
General Market Update
It’s been another wild week across the markets with a couple key economic developments. We’ll begin by discussing one of the Fed’s favorite metrics, PCE.
Headline PCE (YoY), 1M (TradingEconomics)
Last Friday, Personal Consumption Expenditures (PCE) for the month of December came in at 5.0% YoY growth. This was down from 5.5% in November, and 6.1% in October. On a MoM basis, PCE grew by 0.1%.
PCE is an inflation measurement which attempts to measure how much prices have increased based on how much consumers spent. This is different from CPI, which measures the prices that producers are charging for finished goods.
Simply put, CPI assumes that if spending behavior stayed fairly stagnant, how much would prices have increased for the average consumer. PCE on the other hand, takes into account behavioral factors such as switching to generic brand cereal after name brands have grown too expensive.
Core PCE, which is PCE excluding food and energy spending, came in at 4.4% for December. Core PCE was also down from November (4.7%) but saw an uptick in MoM growth, coming in at 0.3% for December, up from November’s 0.2%.
Core PCE is now down to its lowest YoY rate of increase since October 2021’s 4.2%. Prior to that, core PCE hadn’t surpassed 4% since January 1991.
While it is certainly bullish from the declining inflation growth perspective, it could roll over into classic recessionary declines in consumer spending.
Declining core PCE growth was certainly a contributing factor for the decision made by the Fed Open Market Committee on Wednesday.
Target Fed Funds Rate Upper Limit (TradingEconomics)
In case you missed it, the Fed raised the Fed Funds Rate by 25bps. This was an overwhelming consensus that market participants were expecting. The target range for the market interest rate now sits at 4.5-4.75%, its highest level since 2007.
Despite decreasing the size of the rate increase for the second meeting in a row, Powell reaffirmed to investors that “ongoing increases will be appropriate”. In other words, we’re moving closer to the pivot, but it may not come as soon as many expected.
At this point, it appears likely that FOMC will implement 25bps hikes in at least 1 more meeting.
FedWatch Tool (CME Group)
The futures market is currently pricing in a 85.6% probability that the Fed hikes 25bps again in March, and a 14.4% probability of the Fed leaving the FFR at 4.50-4.75%. At the moment, the futures market is also pricing in a roughly 58% probability that March’s theoretical 25bps hike will be the last of this cycle.
Our friends across the pond also met this week to discuss rates.
Both the European Central Bank and the Bank of England both elected to increase their market interest rates by 50bps citing decreases in the size of rate hikes to come. Based on posturing from the Fed, ECB, BOE and BOJ, it appears most central bankers are expecting a successful soft-landing. This is potentially a cause for concern.
In the equity market, we’ve seen yet another strong week of buying as of the time of writing. The Nasdaq set in stone its best January since 2001.
Invesco QQQ, 1D (Tradingview)
The chart above shows the Nasdaq ETF QQQ, which we’ve included to show a particular AVWAP on the index.
After Thursday’s price action, buyers appear to be a little worn out. This combined with the fact that price is nearing a significant resistance area and the Volume Weighted Average Price anchored from previous all-time highs leads our team to believe that there is a strong likelihood of a pullback or consolidation beginning here.
That being said, we have been due for a pullback for well over a week now and yet here we are making YTD highs. The bid strength of the last few weeks has certainly been impressive.
As we’ve mentioned in the last several newsletters, just because something is overbought doesn’t mean it can’t become even more overbought.
Treasury yields have largely continued their decline this week alongside the dollar. However, DXY had a strong day on Thursday that could usher in sell pressure on Treasuries and stocks.
Crypto-Exposed Equities
The Blockware Intelligence is very excited to share a new research report covering Crypto-Exposed Equities:
Ranking Public Bitcoin Miners - A framework to quantify the liquidity, solvency and profitability of public Bitcoin miners
In 2022, a spotlight was shined on the financial health of publicly traded Bitcoin mining firms. Excessive leverage parlayed with higher interest rates, mining difficulty, energy costs, and a broad-based decline in asset prices all contributed to the financial distress shown across the Bitcoin mining industry. In order for investors to effectively navigate this environment, proper analysis of the most recent financial statements of public Bitcoin miners is crucial. This report utilizes methods practiced by traditional financial professionals to quantify the financial health of public miners and calculates a “Miner Score” to rank them based on the following criteria:
Breakeven Cost to Produce Bitcoin - Divides Cost of Revenue by the quantity of BTC mined over the same period to estimate the production cost of 1 Bitcoin. By Q3 2022, many public miners were unprofitable from this lens.
Current Ratio - Divides Total Current Assets by Total Current Liabilities to estimate the ability of a company to pay its short-term financial obligations.
Debt-to-Equity Ratio - Divides Total Liabilities by Total Shareholders Equity to show how much a company relies on debt vs. equity financing. By Q3 2022, this ratio pointed out several miners who would run into solvency issues in Q4.
Cash Ratio - Divides Total Cash and Cash Equivalents by Current Liabilities to estimate the ability of a company to repay short-term debt obligations solely using cash on-hand.”
Our team is very excited to share this report with you and hope it brings you some value. The Miner Score is a proprietary metric our team created just for this report, and you’re among the first in the world to see it!
Bitcoin Technical Analysis
As of Friday morning Bitcoin has continued to struggle to get above $24,000.
Bitcoin / US Dollar, 1D (Tradingview)
The sideways consolidation of the last few weeks has been interesting in that buyers have essentially maintained control throughout.
Generally speaking, we like to see a period of strength followed by a downward sloping consolidation period. This allows prices to find short/mid-term moving averages and incentivizes more buyers to step in after a short decline.
So far, this isn't what we’re seeing from Bitcoin. It doesn’t mean that prices cannot go higher from here, but it will likely be a bit tougher.
Bitcoin’s break above $24,000 followed by a reversal was a failed breakout for BTC. It shows us that despite a robust demand for satoshis, sellers have retained a significant amount of control at the moment.
Heading into this weekend, our team is looking at the channel highlighted above to confirm the direction of the next move. Watch for a clean break above $24,000 or below $22,500.
Bitcoin On-chain and Derivatives
Bitcoin continues to hover in the $23k to $24k range.
Despite the FOMC meeting this week, which usually leads to heightened volatility, the price has remained relatively stable.
Now that Bitcoin has passed LTH Realized Price and STH Realized Price (as we predicted would happen this year in our 2023 forecast), and it appears to be sustaining this key onchain support level, we are now becoming increasingly confident that the worst of the bear market is in.
As always, this is not financial advice. Bitcoin is still a highly volatile asset and taking leveraged directional exposure is risky. As the saying goes: “stay humble and stack sats.”
While we are on the topic of volatility, the two week measurement of realized volatility has begun declining. Notice how the chart of Bitcoin volatility almost resembles that of a heart beat. At this point in time, just as a heart beat is essential to an animal’s survival, volatility is essential to Bitcoin. Volatility to the upside brings many new market participants, volatility to the downside wipes away misallocated capital. Moreover, you cannot expect a change in the global approach to money, which is the promise of Bitcoin, to occur without volatility.
Realized profits-to-value adds another tally to the “bottom is in” column.
This measures the amount of realized profits relative to the realized cap of Bitcoin. Realized cap, for those who are not regular readers of this newsletter, is simply a measurement of BTC’s market cap based on the price of BTC at the time each coin was last moved.
Low measurements of realized profits-to-value indicate market participants are not realizing many profits relative to the total amount of value paid into the network (realized cap). As some market participants have now been able to realize profits for the first time in months, the metric has rebounded sharply just as it did at the conclusion of previous bear market bottoms.
The 30-day moving average of realized profit/loss ratio has flipped positive for the first time since April 2022. This is yet another on-chain indicator that shows the current state of the market is conspicuously similar to the end of previous bear markets.
This metric shows the number of unique addresses withdrawing BTC from exchanges. What I'm looking for here is to see if many new market participants are stepping in on the buy side, or is the upward price movement just caused by sellers running out of coins. The latter appears to be the case so far.
The flurry of exchange collapses in 2022 resulted in this metric increasing during the bear market as people rushed to withdraw BTC from exchanges. The longer the price spends in its current range, the more confidence the market will have that the bottom is in, and we will likely see the number of withdrawing addresses increase as market participants step back in.
Another likely factor for the increase in withdrawing addresses is that Bitcoin’s underlying adoption curve continues to expand despite the bear market.. Of course, bull markets will still increase the rate of adoption significantly. However, the rate of new on-chain entities was noticeably higher at the bottom of this bear market compared to the last. Should the price continue to push higher this year it will likely be the result of new entities stepping back into the market.
“New entity momentum” has just flipped positive as the 30D moving average of new entities surpassed the 365D moving average.
As mentioned in last week’s newsletter, ideally we don’t want to see a massive build up in open interest as the price begins to rally. The absence of excessive leverage will allow for more sustainable and less volatile (relatively speaking) price appreciation.
Perpetual futures open interest with respect to market cap is still in a downward trend which is a good sign that most traders are fearful and waiting for further confirmation before re-entering the market.
The percent of futures margined with crypto has continued to decline as well; another sign of risk-off behavior. This shows that a higher percentage of futures contracts are being collateralized with USD or USD-pegged stable coins vs with Bitcoin or the respective crypto-token (ETH collateral for ETH futures etc.)
Obviously, collateralizing using BTC as collateral for a BTC futures contract increases your risk as downward price action also decreases the value of your collateral, increasing liquidation risk.
Continued declines in the percentage of futures margined with crypto is a good sign.
Bitcoin Mining
Ordinals (NFTs) on Bitcoin
This week part of the Bitcoin community has been chatting all about inscriptions, ordinals, and NFTs. What does any of that mean?
After taproot (a Bitcoin soft fork) was enabled in 2021, Bitcoin’s scalability and privacy were improved. In addition, users can now more easily store any data they want on the Bitcoin blockchain as long as they convince a miner to include it in a block, usually by paying a fee to do so.
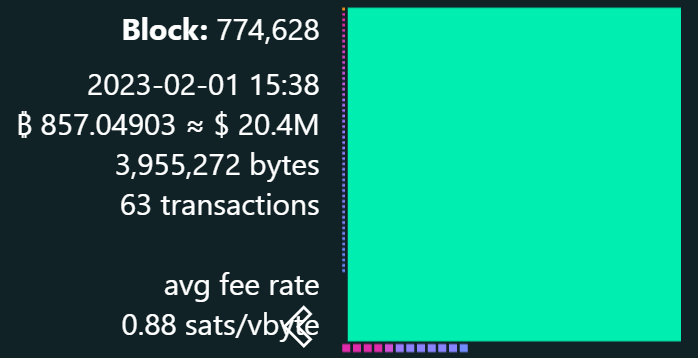
This has caused a small amount of controversy as now some blocks look like this. That big green square is data containing a JPEG image, and the smaller squares are normal Bitcoin transactions.
Bitcoin has something called a block size and block weight limit. This means Bitcoin blocks can’t be larger than a certain size. The current maximum limit is 4 million weight units, which is about 4 MB. The reason the limit exists is to drive down the costs of running a Bitcoin full node. Bitcoin is unique among all crypto assets and traditional assets in that its monetary policy is the least uncertain.
There will only be 21,000,000 BTC because it is easy and inexpensive to run a Bitcoin full node, and each Bitcoin full node sets its own rules within the network consensus. If everyone can easily run a full node, it prevents segments of the Bitcoin community or even large portions of the Bitcoin community from altering critical components of Bitcoin, like the 21,000,000 maximum supply.
All other cryptos either have a group that can push consensus-altering changes, or it is simply too expensive or difficult for most people to run a full node, making their asset more uncertain as future changes could occur.
Some people argue that storing large JPEGs on Bitcoin wastes block space for no real purpose, and others argue that if someone is willing to pay the transaction fee to a miner, they should be able to put whatever they want in blocks.
For miners, this arguably could be beneficial as blocks are now more full and fee pressure could rise as a source of revenue. However, it’s questionable whether inscriptions will be used extensively or if this is just a short fad.
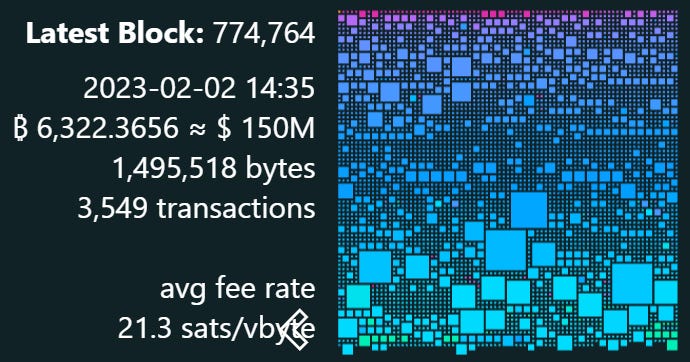
Additionally, for comparison, here is a more normal-looking block filled with many different Bitcoin transactions.
Future Bitcoin Supply
Bitcoin is fascinating in that the amount of BTC left to be mined continues to trend toward 0, yet the total Dollar value of the remaining BTC continues to increase.
As Bitcoin eventually starts another parabolic bull run, the value of remaining BTC yet to be mined will likely go back into the hundreds of billions and potentially into the trillions if Bitcoin reaches gold parity this decade.
Energy Gravity
The following chart is based on a previous Blockware Intelligence Report that models the relationship between the price of Bitcoin and its cost of production. The model makes it easy to visualize when the price of Bitcoin is overheated or in the process of bottoming.
Again, we continue to see more confirmation that Bitcoin is likely in the process of bottoming and that Bitcoin has significant room to move higher if macro conditions allow it to.
All content is for informational purposes only. This Blockware Intelligence Newsletter is of general nature and does consider or address any individual circumstances and is not investment advice, nor should it be construed in any way as tax, accounting, legal, business, financial or regulatory advice. You should seek independent legal and financial advice, including advice as to tax consequences, before making any investment decision.


Great read as usual!
Once Again Will and his team didn’t disappoint