Download your FREE Bitcoin self-custody guide from the Bitcoin Way to learn how to secure your stack properly:
http://www.thebitcoinway.com/guides/bitcoin-self-custody?utm_source=partner-blockware
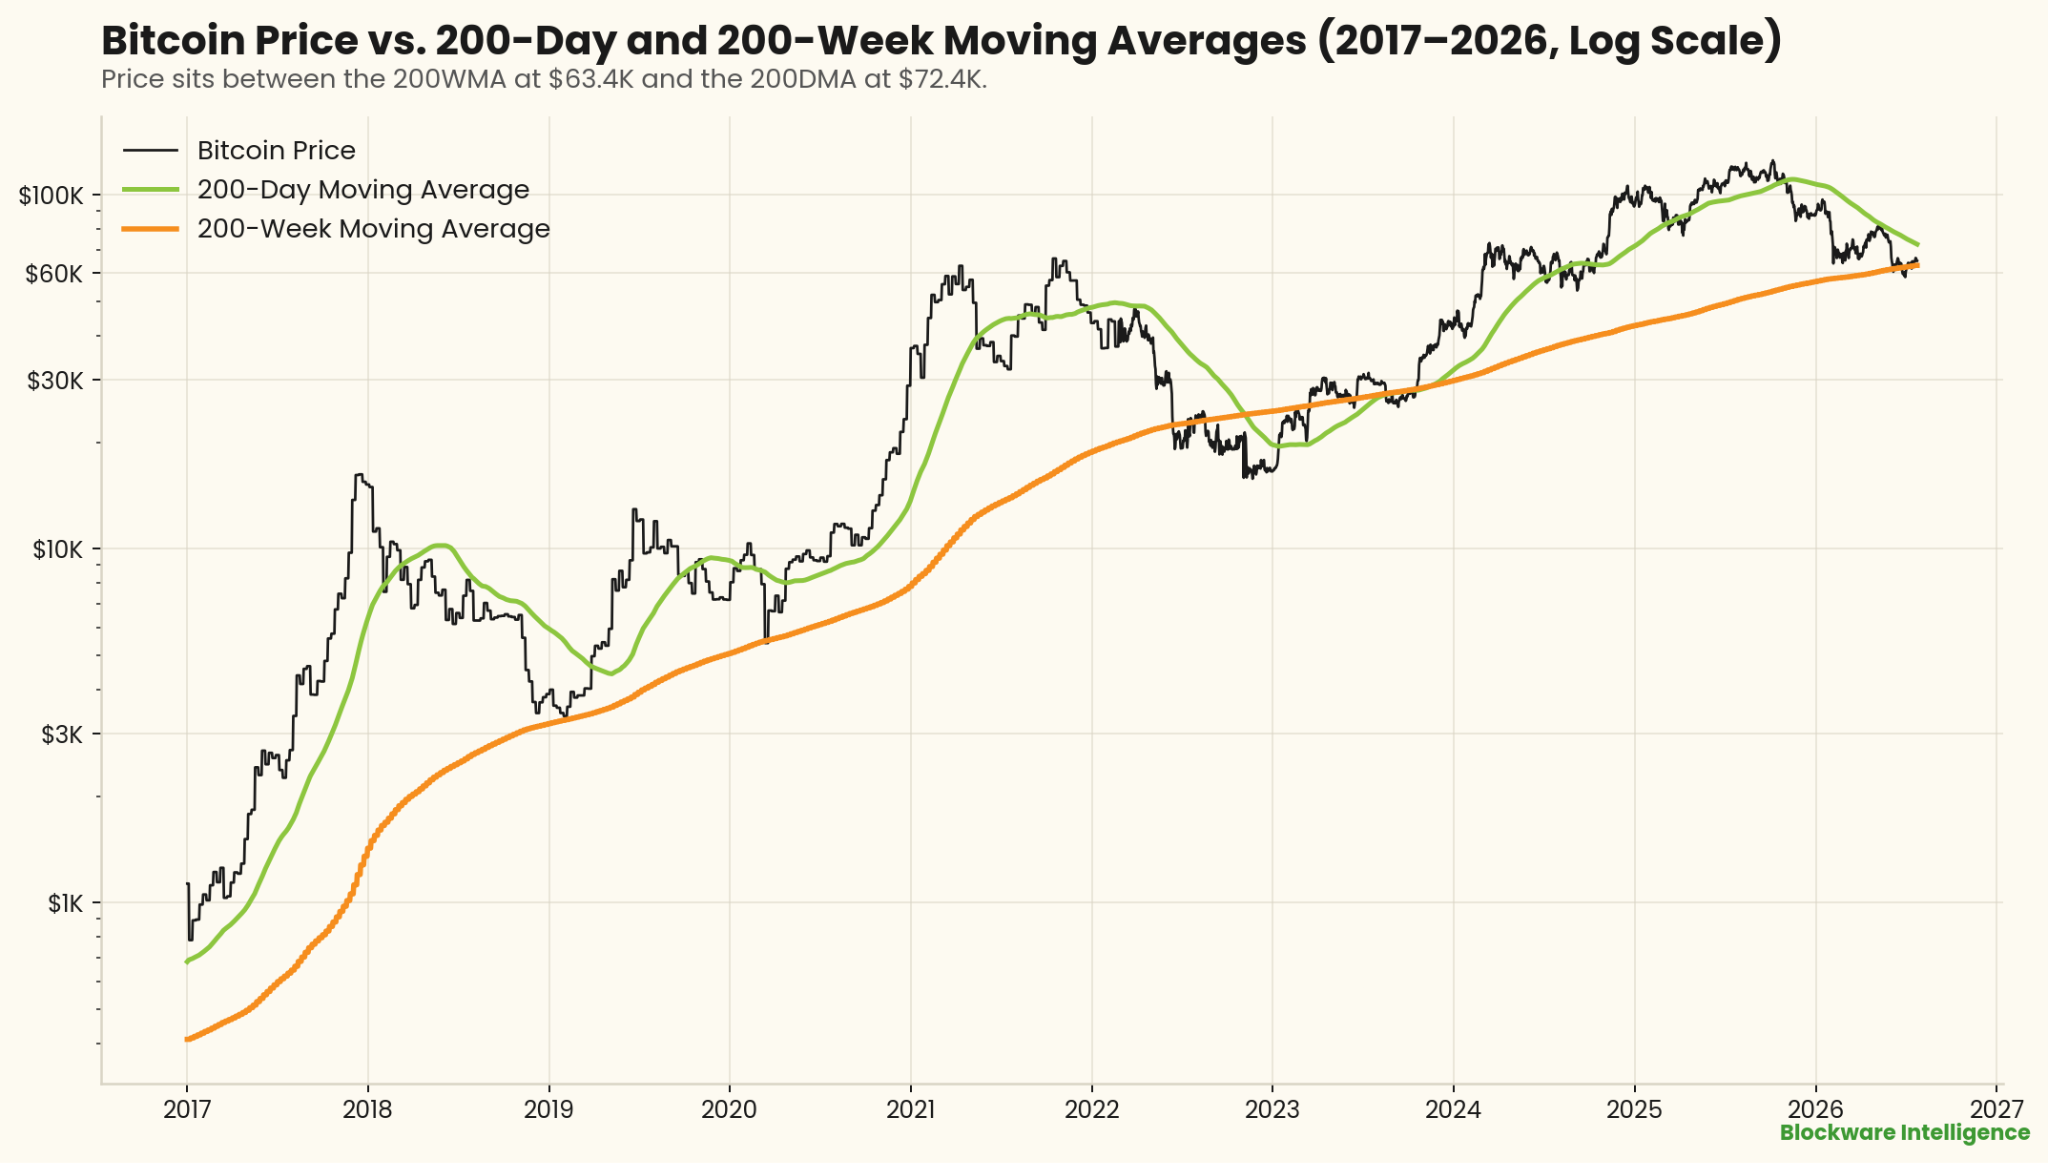
Bitcoin reached a local high of ~$66,000 earlier this week and currently trades at ~$63,900; wedged between two important moving averages:
200 Day MA: $72,446
200 Week MA: $63,356
Bitcoin crossing back above the 200-Day Moving Average has historically signaled the bear market has reached its trough; we’ll be eyeing a date with this level later in Q3.
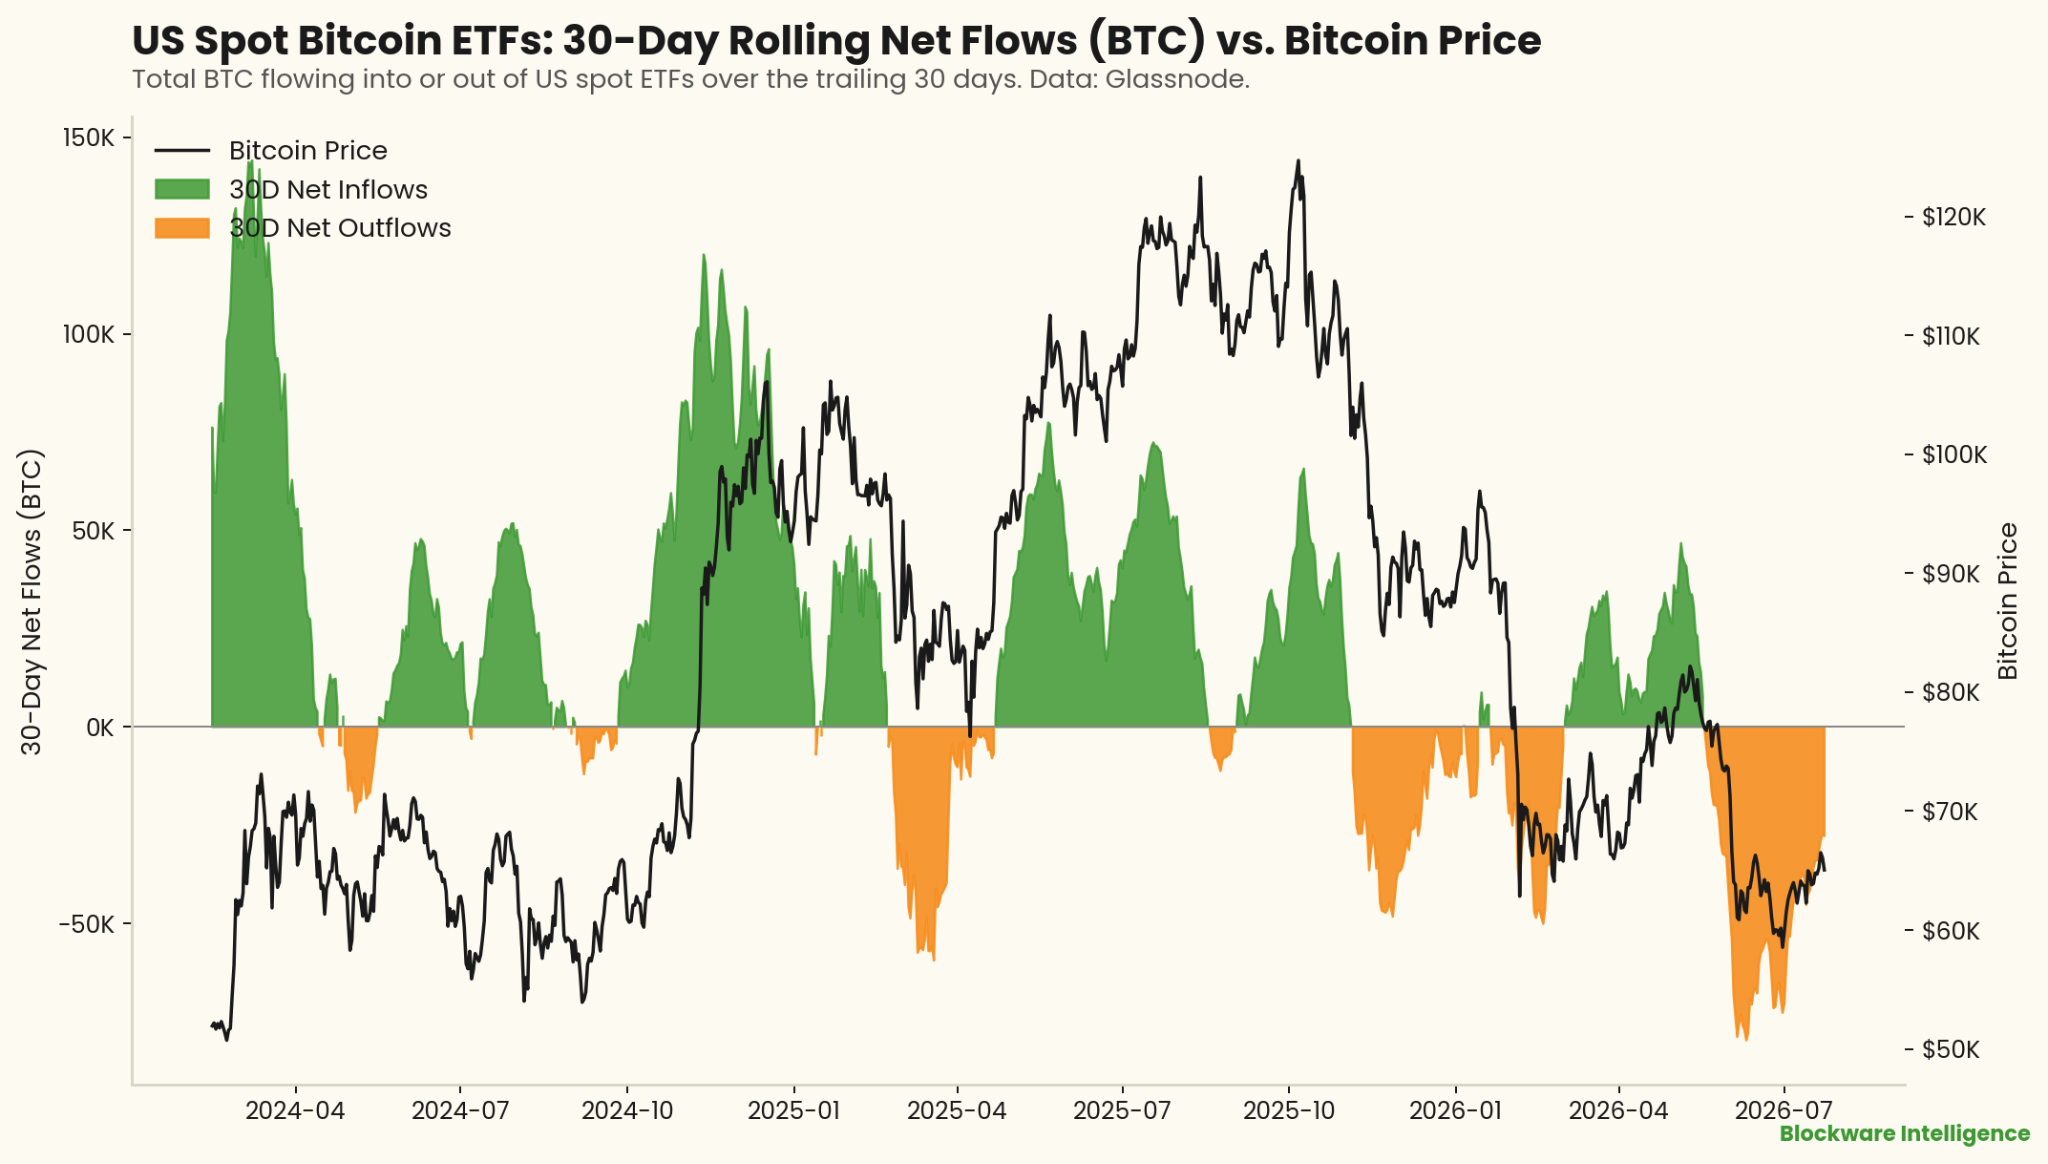
On a near-term basis, it’s prudent to remain cautiously optimistic. Many longer term metrics are indicating “extreme value” / bottom formation (covered in-depth in this video). However, we’re also seeing net-outflows from Bitcoin ETFs over the past 30 days which could present headwinds over the next few weeks.

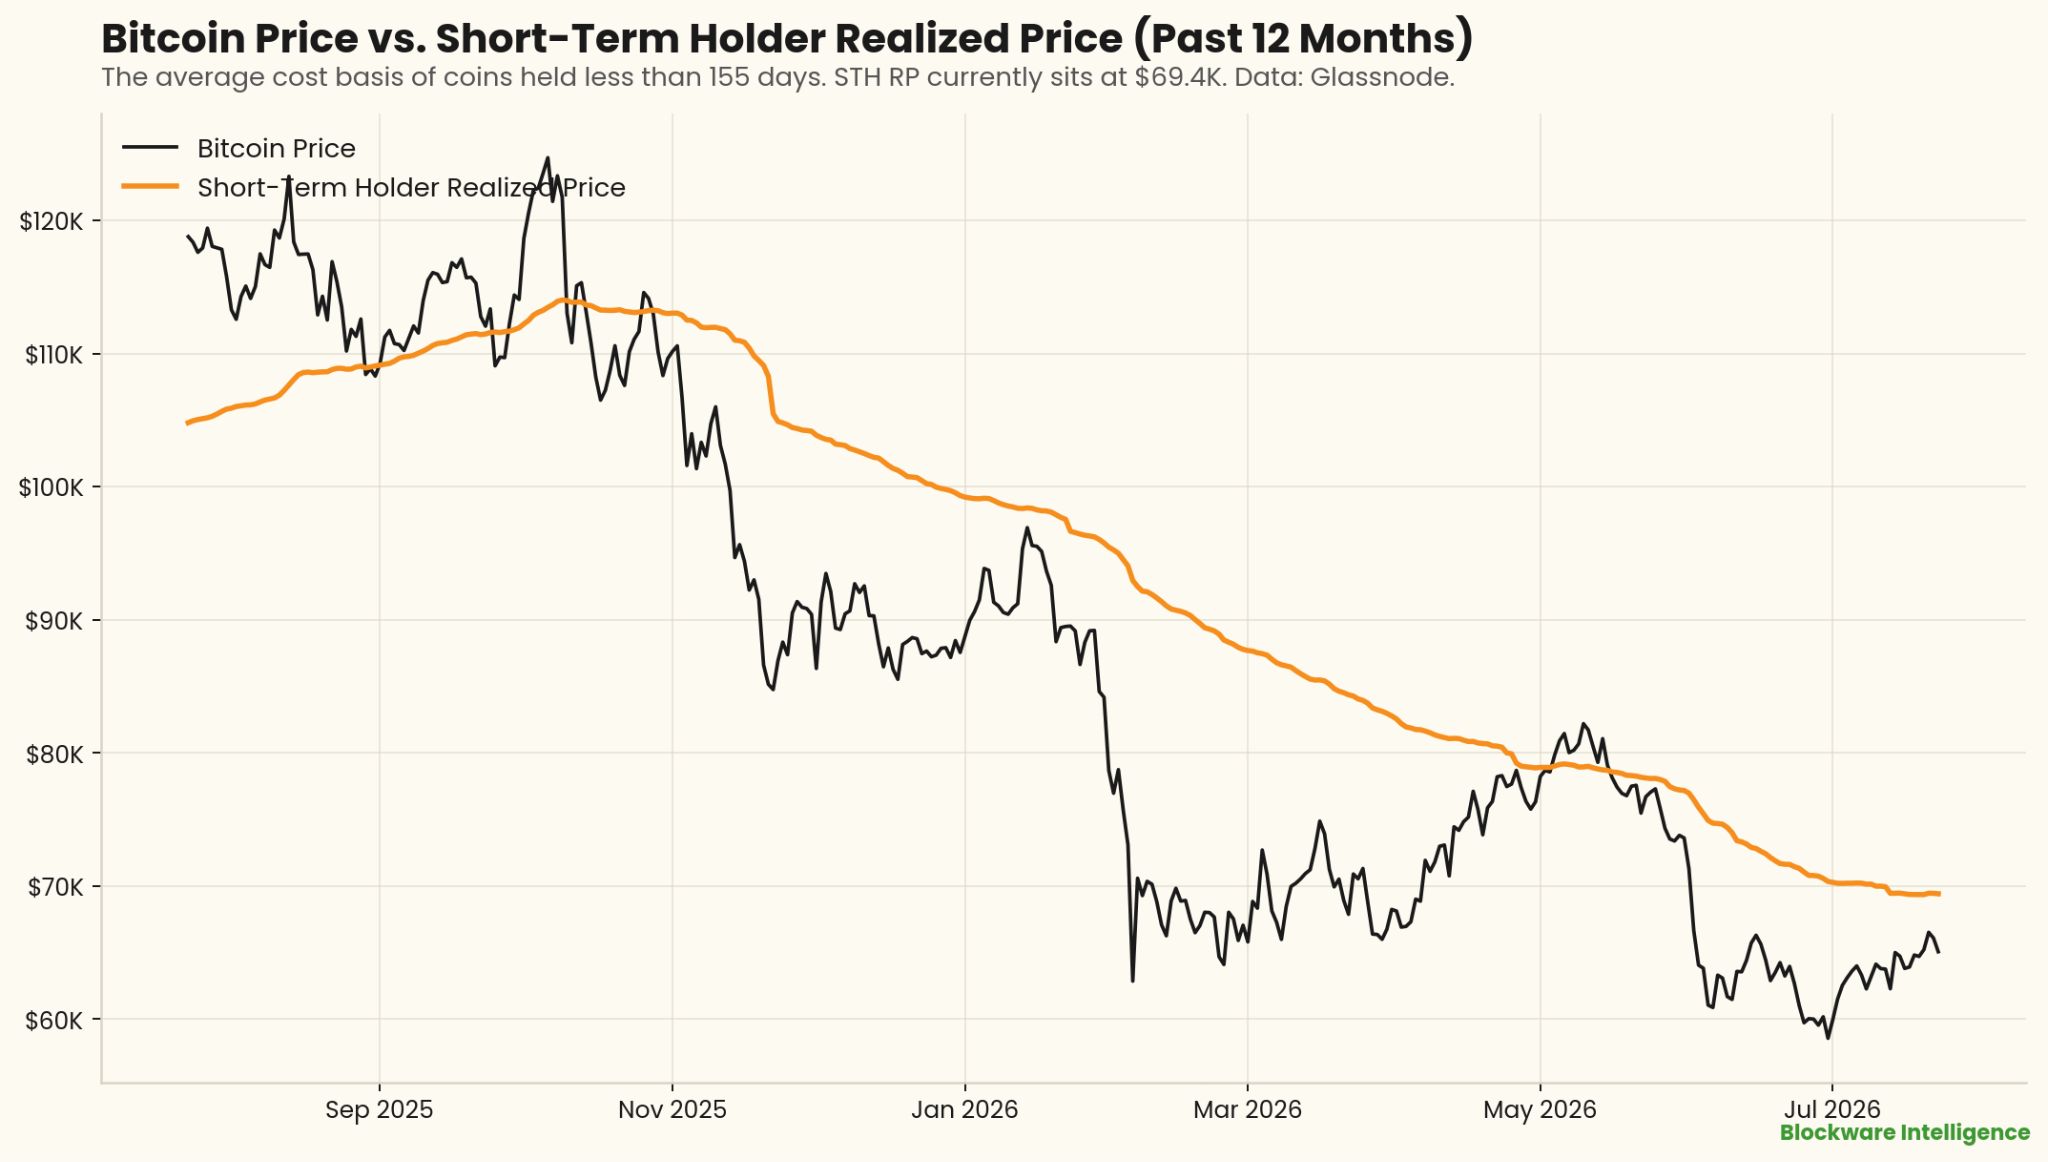
The short-term holder realized price is now at ~$69,000; Bitcoin’s test of this resistance level is likely to take place in the next 2 to 3 weeks. If BTC sustains a breakout above this key on-chain cost basis metric, that will provide strong confirmation that the worst of the bear market (price wise) is behind us. However, a failure to break resistance (like we saw in June) will likely lead to at least another 6 to 8 weeks of down or sideways price action.
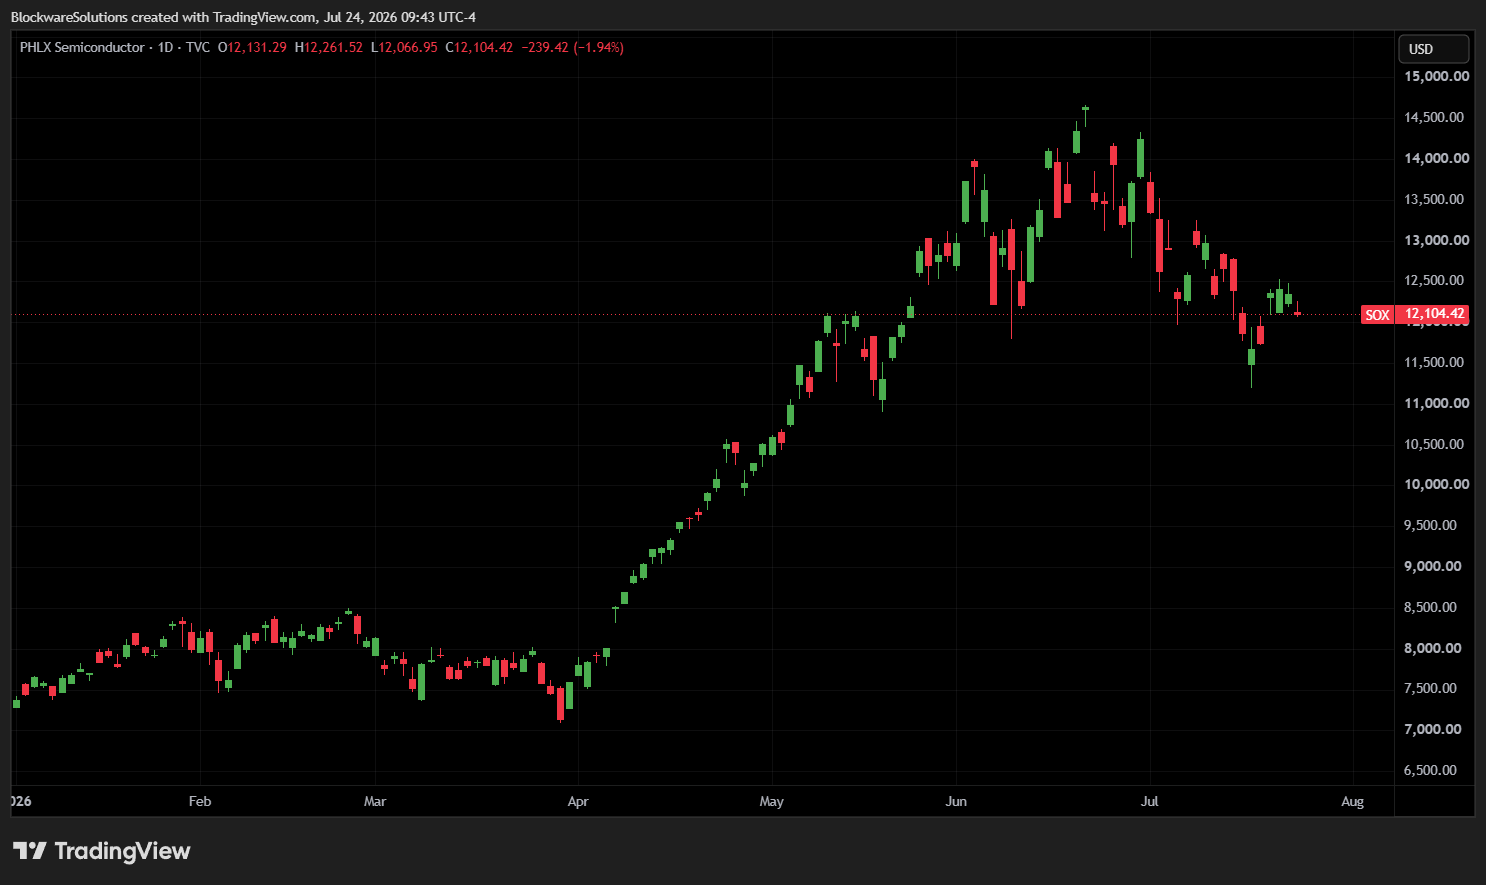
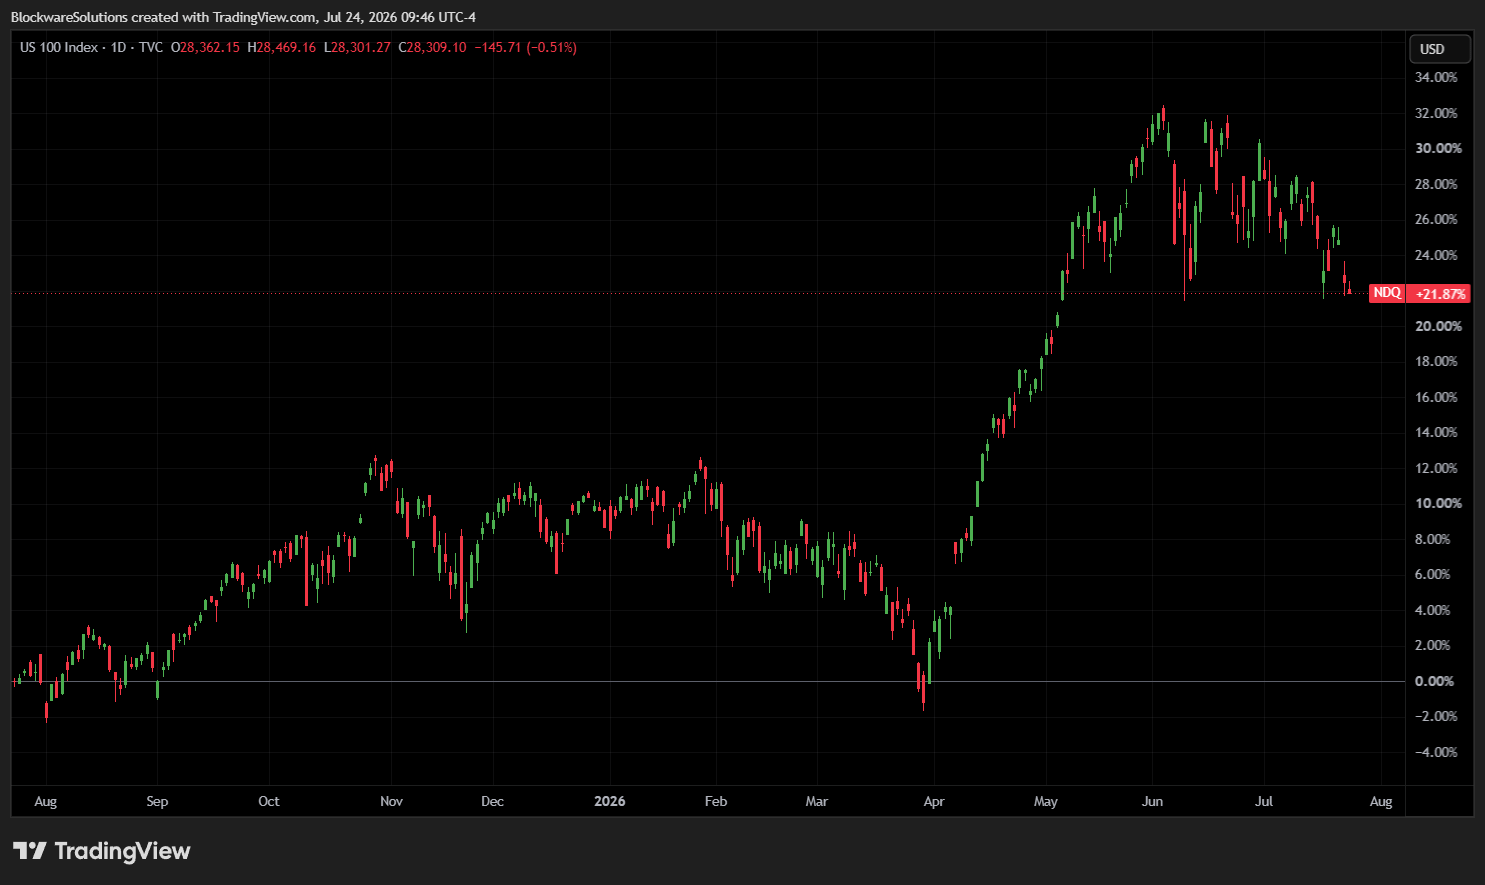
The Ai-trade continues to cool off after an incredible Q2 performance. The semiconductor index ($SOX) is down ~16% from its June high, formulating a series of lower-highs throughout July. Likewise, the Nasdaq 100 ($NDQ) is down ~7% since early June.
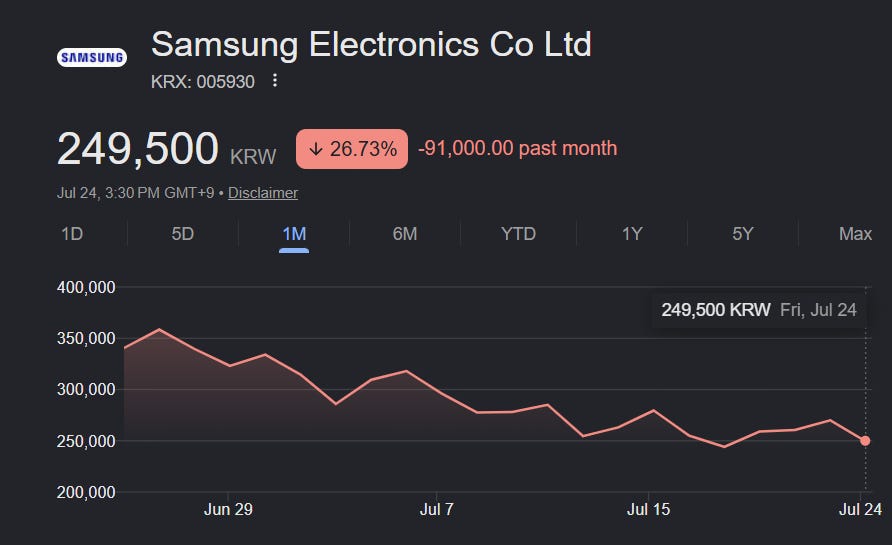
At the forefront of the Ai industry, Samsung missed revenue estimates, in-spite of record high operating profits in Q2 of $325 billion (59% YoY increase).
Chip stocks led the entire risk asset complex higher in the first half of 2026, and their rollover drags liquidity and sentiment down with them. Our base case for the next 12 months is that a portion of this risk-on capital rotates back into Bitcoin as market expectations shift & Ai investors look to lock in profits.
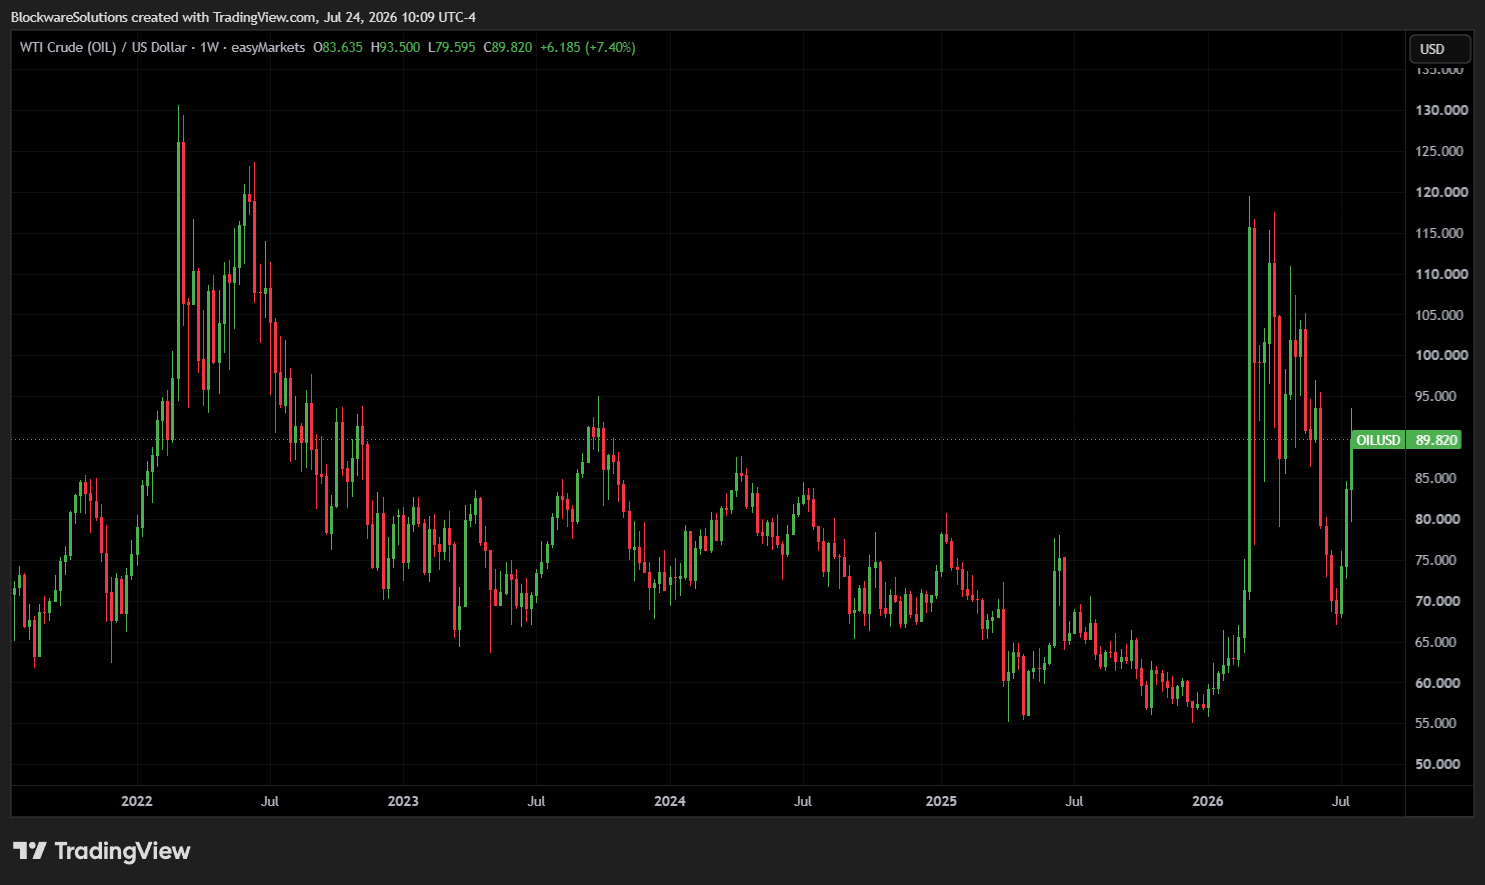
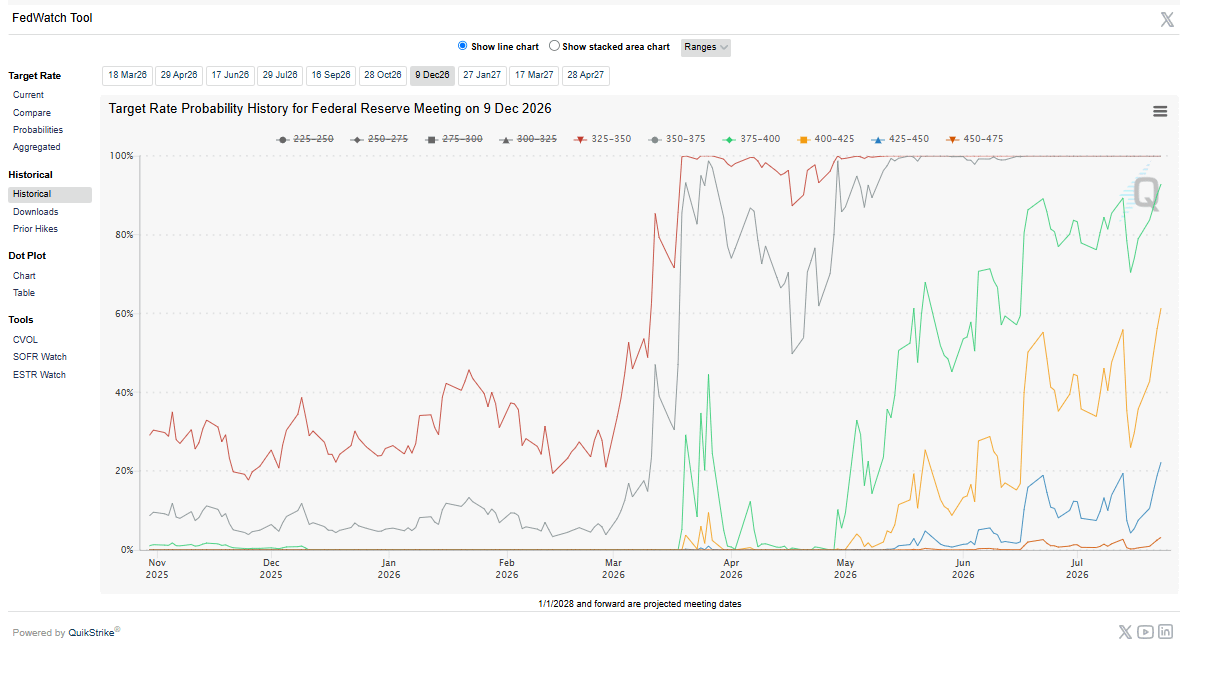
Alongside the surge in oil (back to ~$90), market expectations of a hawkish Fed are surging higher. Based on CME futures, the market is now pricing in a ~93% probability that the Fed hikes rates by 50 basis points or more before the end of the year.
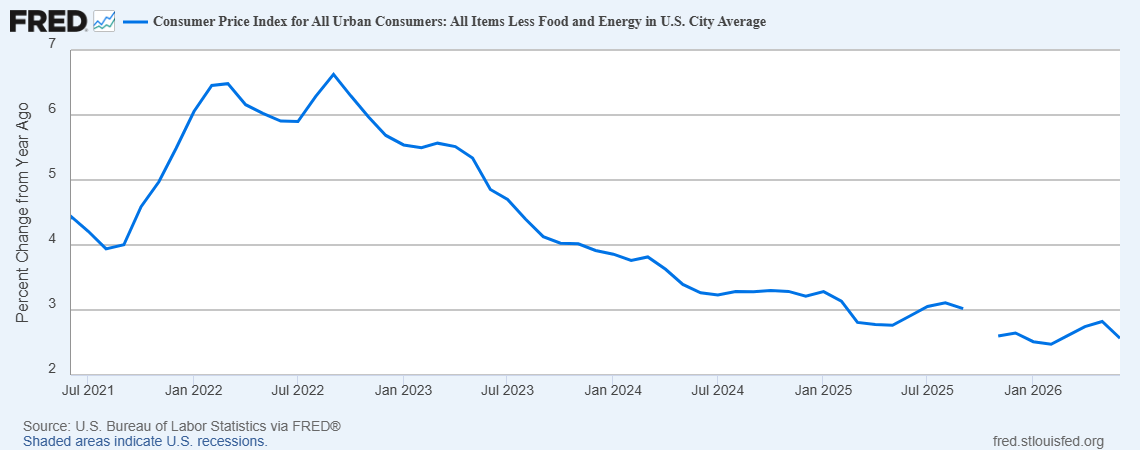
We believe these expectations are misaligned with the newly established frame work & tasks forces from Kevin Warsh. Energy prices are the primary forcing function here and the market is extrapolating a very linear conclusion: higher energy prices = higher CPI = Fed should/will hike rates. However, Warsh has still refused to submit a dot to the dot plot and has committed to overhauling the data guiding the Fed’s policy decisions. Energy prices are being forced higher entirely due to the U.S. conflict in the Middle East; which, optimistically, is a finite, one-time event, rather than a perpetually present inflation catalyst (like the 2020/2021 stimulus and subsequent inflation boom). The broader trend is that CPI has been in a gradual decline and Core CPI even more so; a Fed that is insistent on reacting to data holistically, rather than hyper focusing on one specific indicator, is likely to take this into account.
As far as Bitcoin is concerned here, this provides further evidence of present asymmetry. Bitcoin is being priced as if the Fed is going to hike, meaning a shift in expectations merely to keep rates the same, not even cuts, will likely result in Bitcoin moving higher.
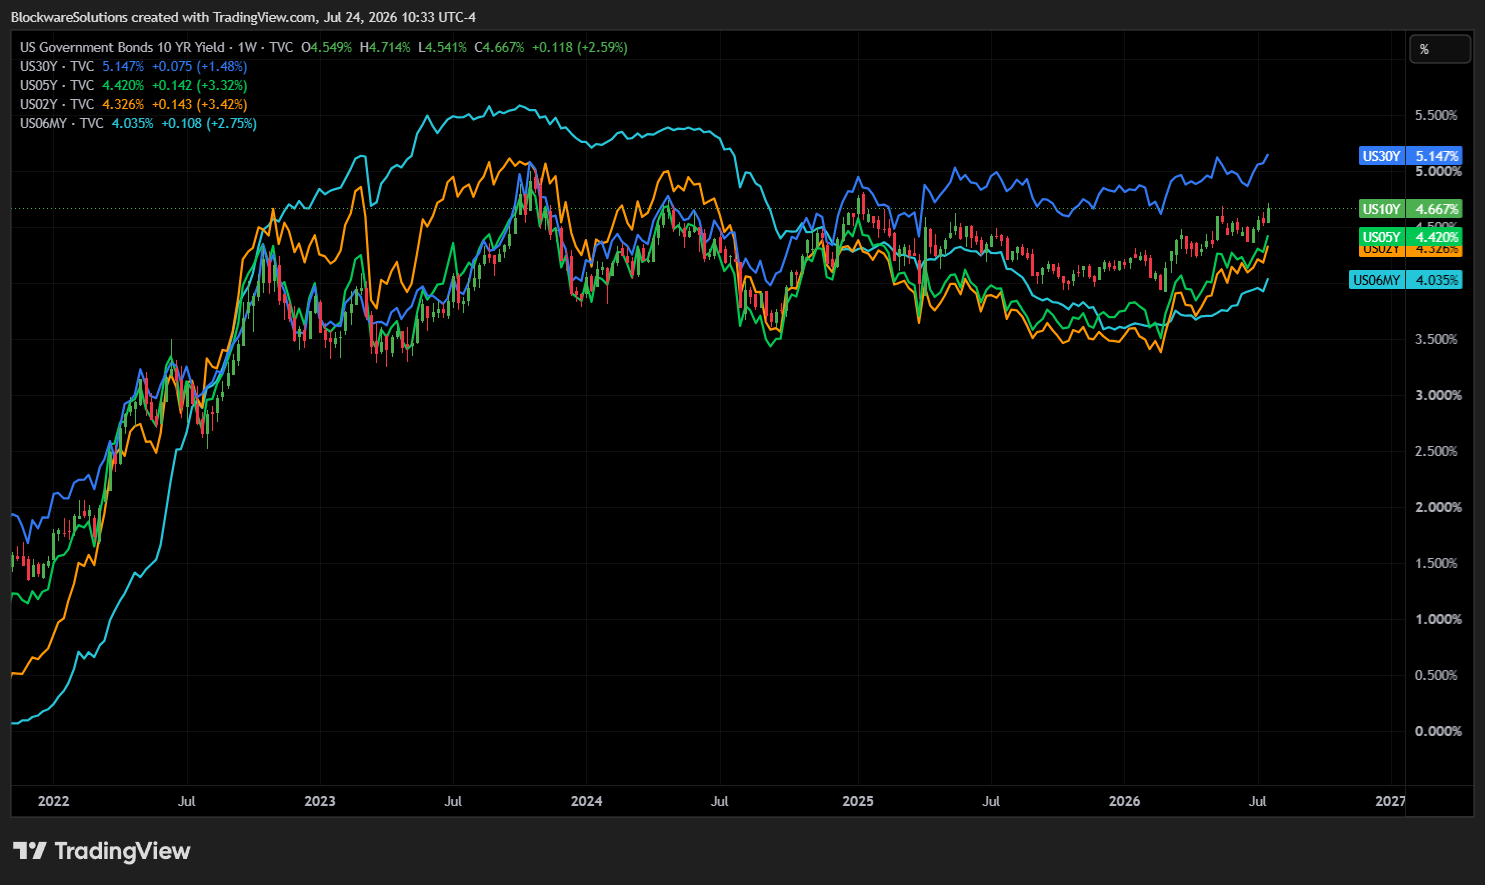
Pressure continues to mount on the fiscal side. The US 10-Year Treasury is up nearly 50 basis points on the year and is on the precipice of its upper bound over the past 5 years. The rest of the yield curve has moved higher alongside the benchmark; with the 30-Year at ~ 5.14%, its highest since 2007. On the short end, the 2 year & 6 month treasuries are up ~80 and 40 basis points YTD respectively.