Blockware Intelligence Newsletter: Week 29
Bitcoin on-chain analysis, mining analysis, equity-analysis; overview of 3/04/22-3/11/22, including guest writer Nik Bhatia
Summary
Spot premium regime persists, over 3 months
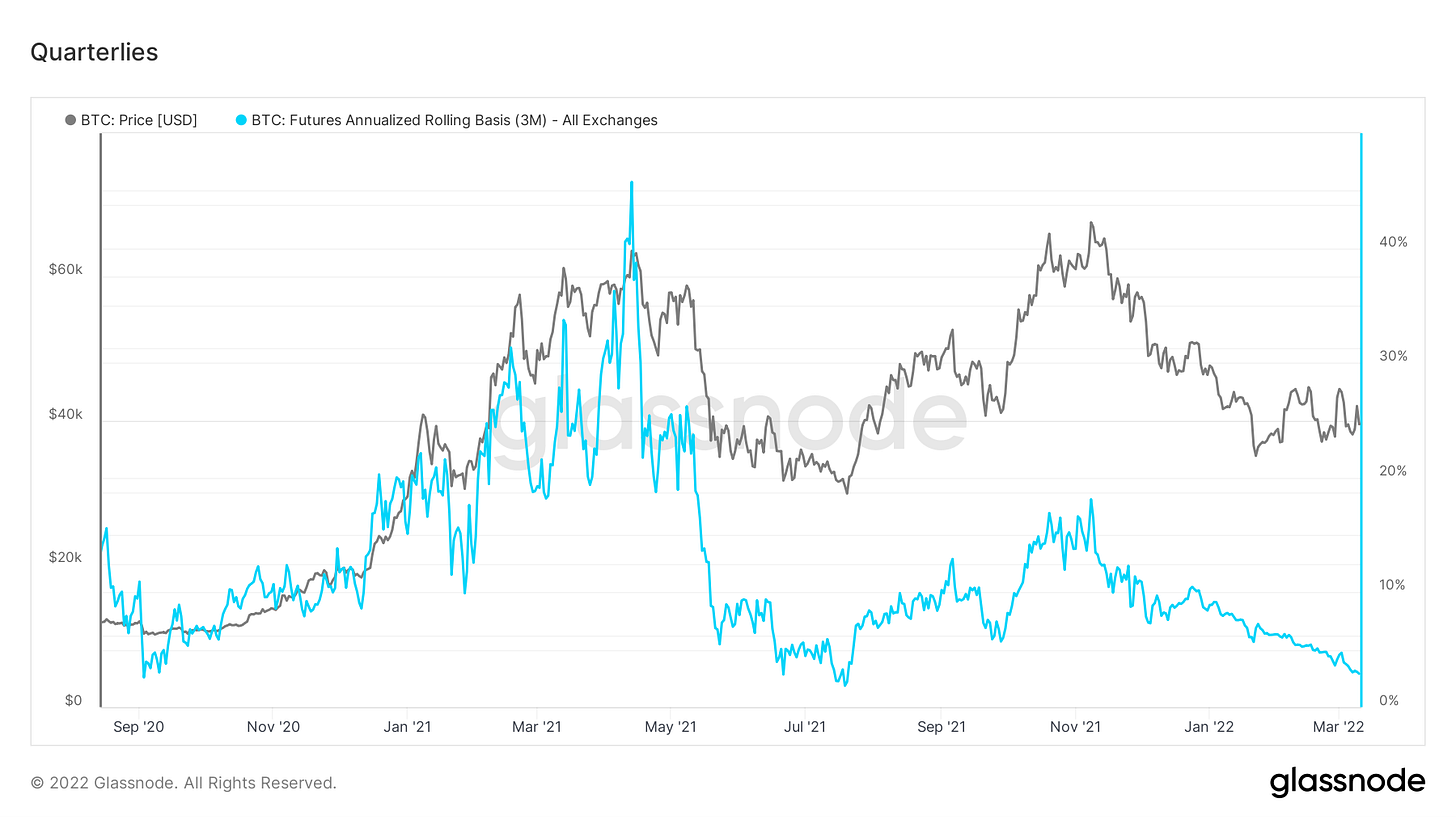
Quarterlies now below 3% (2.914% to be exact)
19.5% of Bitcoin’s supply has now moved in this several week long range between $36K-$45K
The general market is continuing the downtrend and chop while fear remains elevated, but not extreme.
IREN and CLSK are the two clear technical standouts among crypto-exposed equities.
NEW RESEARCH: New Generation Mining Rigs Are Safe Haven “Bitcoin Dividend” Assets
New hash rate distribution table by machine model and electricity rate.
In a simulated stress test on the Bitcoin network, old-generation miners get turned off and new-generation miners earn more BTC.
General Market Update
Despite what felt like quite a crazy week, not much has changed from a technical standpoint in the general market since we last spoke a week ago.
Gold and oil/gas continue to dominate, as discussed here for the last 4 weeks. These commodities appreciating, alongside bond yields, is a potentially dangerous situation for risk assets like tech stocks and cryptoassets.
Rising yields and commodities suck capital from the equity markets into those sectors of the market that are perceived as safer during this type of macro environment.
And still, the narrative for Bitcoin has never been stronger. Thursday with the meeting of the Fed Open Market Committee (FOMC), we saw the release of the new consumer price index (CPI) data.
The CPI number announced was 7.9%, signifying that the price for a basket of commonly consumed goods is up that much from one year ago. Yet we know that, in reality, true inflation is likely much higher.
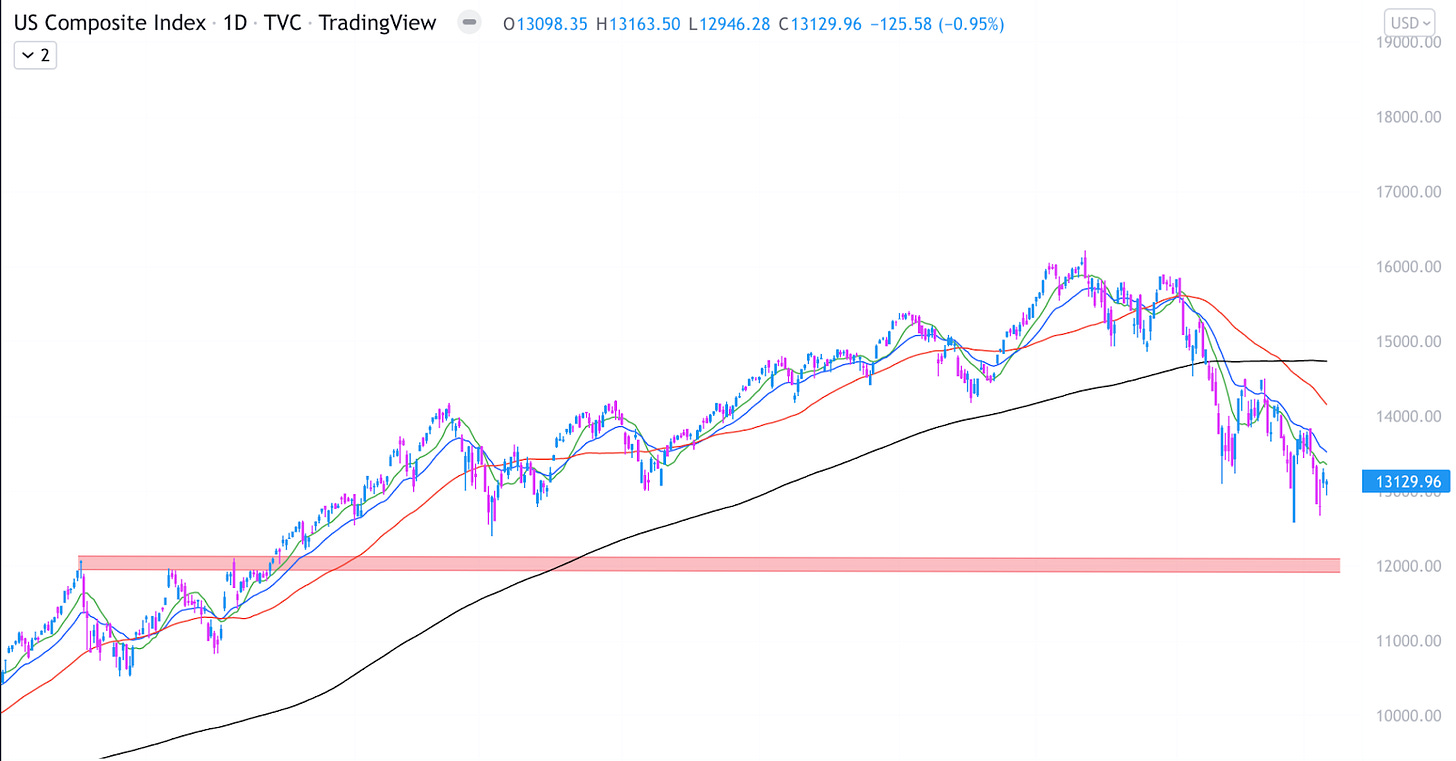
For the indexes, it has also been a continuation of what I’ve previously discussed, a choppy mess drifting downwards. In other words, it’s a bear market in the midst of a probable recession.
$11,900-12,100 would be the next support area I'm watching for the Nasdaq, if it’s unable to hold these current lows. But Thursday was a constructive day for the indexes, signified by upside reversal candles.
Nasdaq Comp. 1D (Tradingview)
Despite the trend being down, it’s still important to have your eye out for a follow-through day. They can come at any time and signify an attempt for the market to start a new uptrend. If we’re too focused on fear of further downside we could miss a rally.
Once again, a follow-through day can occur, at least, four days after the market bottoms. It is signified by a day where any index is up >1.5% on volume greater than the previous day.
Since we haven’t taken out the lows from February 24th, a follow-through day could occur at any time.
As I’ve discussed the last few weeks, fear remains elevated but we’re not seeing the level of panic that is common in a true bottom.
VIX 1D (Tradingview)
Here’s an update on the VIX, the S&P 500’s volatility index. The VIX is commonly referred to as the fear index. As you can see, volatility (AKA fear) has fallen steadily everyday this week.
What is particularly interesting to me is that the VIX has been falling alongside the S&P. Generally, the VIX rises when the S&P falls, telling us that most investors fear further downside.
Yet still, the VIX is clearly elevated at the moment, signifying that there is sizable fear in the market. But a VIX value of ~30 is historically not very high. For example, at the bottom of the 2020 COVID crash we saw the VIX in the low 80s.
Today, the VIX isn’t even higher than it was 2 months ago despite the Nasdaq being down ~6% since then.
Another fear metric I follow is CBOE’s equity-only put/call ratio. This gives us an idea of the net direction of derivative trades on equities.
A high put/call ratio would indicate that there are a lot of participants buying put options. This would mean that sentiment is overwhelmingly bearish and fearful of further decline.
As you can see above, the equity-only put/call is in a similar boat as the VIX. It is elevated, but still not THAT high. Once again, this metric shows us that participants were more fearful in January than they are today.
All the evidence I’ve just presented leads me to the conclusion that further pain is likely to be felt in the securities market. But that’s just my opinion.
Crypto-Exposed Equities
For crypto-exposed stocks this week there are two names that vastly standout from the crowd, CLSK and IREN.
CLSK 1D (Tradingview)
As you can see above, CLSK is near the top of this short-term range and in the midst of a significant area of resistance. Keep an eye out for a break above $11.47.
Institutional demand is clearly quite high for CleanSpark. According to Marketsmith, 149 high quality institutions own CLSK, up from just 42 one year ago.
*Long-term investors should do their own due diligence and note there is an ongoing class action lawsuit against CleanSpark.
IREN 1D (Tradingview)
IREN looks the best of the public miners as it builds out this IPO base. That resistance at $18.50 will be a big spot for IREN to prove its strength before the ultimate test, and pivot point of the IPO base, at all-time highs.
To no surprise, IREN tops the rankings on the comparative excel sheet for this week. The average Monday-Thursday return of this group of stocks was 5.68%, more than double the 2.71% of BTC itself.
CLSK is the only name which remains in the top 5 from last week. CLSK has been in the top 5 every week for 5 weeks in a row now…
Macro update from Guest Writer Nik Bhatia:
Inflation has reached a 40-year high of 7.9%, and the impact from war-driven commodity price explosions hasn’t even started yet. The reflexivity of higher inflation, tighter monetary policy, and slowing growth should theoretically bring inflation back down over the next couple years, but the next several months will see astronomical statistical inflation relative to the past decade.
This will keep the Fed completely engaged—its credibility is once again in the crosshairs, and interest hikes will be delivered by the FOMC in the face of an overheating CPI. The first 25 basis point hike is all but guaranteed for next week, according to OIS markets. Remember that OIS markets are not economist forecasts, but liquid swap markets that reference Fed Funds rates into the future. December OIS rates are holding stubbornly above 1.5%, despite war and a Nasdaq that has already entered a technical bear market. Short-term traders continue to bet on the Fed hiking rates 25 basis points each time it meets this year.
How will we know when the Fed will reverse course, or at least pause its hiking cycle? A 20% decline in tech stocks hasn’t made them flinch. High-yield bond spreads, corporate new issuance, and money market displacements (FRA/OIS) will all cause the Fed to stutter if faced with liquidity concerns—as of now, we are seeing signs of weakness in all three of these areas, but nothing close to crisis levels. Rates markets will eventually tell us that the hiking cycle is over when the yield curve begins to steepen aggressively—for now, the curve remains flat as a pancake, which is the fixed-income market’s way of telling us the Fed is still committed to tightening monetary policy.
You can find Nik’s newsletter here:
On-Chain Analytics and Derivatives
We’ve finally seen some volatility step back into the market, with some whipsaw price moves in this range between 36k-45k.
Within this range, which has been shaping up for over a month now, a significant cluster of on-chain volume has formed. 19.5% of BTC’s supply has transacted or changed hands in this range.
In the upper right hand side of this chart you can see this consolidation talked about above, as well as the same key levels we’ve been eyeing for weeks. Nothing in that regard has changed from the last few weeks as BTC continues to consolidate.
From a derivatives perspective, still seeing a spot premium, which has now persisted for over 3 months or roughly 13 weeks.
Another indication of decrease in interest (no pun intended) from the derivatives side is the draw down in open interest dominance. This means there are fewer perpetual futures contracts being opened relative to the size of Bitcoin’s market cap. For a full explanation on open interest, click this Twitter thread below:
Although there has been a relative decline in open interest dominance, there has been a slight uptick in the percentage of contracts collateralized with crypto versus stablecoins. We have talked about what this means before, but to recap from a high level: Crypto margined contracts have a higher convexity to them, meaning if you’re long BTC with BTC as margin and price starts going down, not only is your PnL decreasing in value but so is the value of the collateral for that contract, making you more susceptible to getting stopped out/liquidated from your long. On the flip side, when margined with stablecoins, longs don’t have that convexity, while shorts are actually more susceptible to being stopped out/liquidated because they no longer have the “inadvertent hedge” that they would if collateralized with BTC. Overall the downtrend in the percentage of contracts collateralized with crypto is a healthy backdrop for the market. This uptick over the last week isn’t overly concerning but will be interesting to keep an eye on to see if this becomes a trend reversal.
Last note on derivs, quarterlies have been acting a bit strange in recent weeks. When I say quarterlies I’m referring to the difference between Bitcoin spot and the price of the 3M futures contract, the basis for what many people have gotten to know as the cash and carry trade. In a way, this is a “risk-free” (aside from counter-party risk) yield for BTC market participants. As you can see in the chart, this basis has generally followed price for the last two years, although didn’t reach nearly as high as it did in late 2021 (18%)as early 2021 (45%). Side note: I doubt it will ever get that high again as the market becomes more efficient -unless- you get exuberance driven by something huge like a central bank or Apple and Amazon announcing they bought Bitcoin. As you can see over the last month or so this has just been trending down, not quite following price. IMO is another signal of lack of exuberance from the derivatives market in addition to open interest and general spot premium to perps.
On-chain cost basis analysis is still one of my favorite metrics and most important to follow in my opinion. The pink line is short-term holder cost basis, the blue line is long-term holder cost basis, and the purple line is a ratio between the two of them. Notice at the bottom of the bear, you want to be buying when the two cost basis’ crossover, thus also pushing the ratio below the green line. Right now we’re sort of just hanging out in limbo, and I’m not saying this HAS to happen, but if it does, I will be stacking some major sats.
Also on this note, short-term holder cost basis sits at $46,500, as I’ve been posting on Twitter, ultimately think this is the level that BTC needs to reclaim for momentum continuation. Anything below that is really noise for momentum-based market participants IMO.
Another variant of realized price (or cost basis, same thing) is the realized cap net position change z-score (that’s a mouthful I know) that my good friend Checkmate from Glassnode created this last week. This uses some giga chad mafs that took me a while to wrap my brain around, but from a high level, shows the variance from the 30-day difference in realized cap’s trend. Another very interesting metric to keep an eye on, buying between the two green lines is a decent strategy to average into a long-term position efficiently.
And another metric actually created by Checkmate as well, we have the 28-day market realized gradient. If you can’t tell, realized cap is a backbone of many on-chain metrics and IMO the most important metric created in the field. The purpose of this is to essentially gauge the momentum of realized cap, or in other words momentum of capital inflows or value flowing in/out of the network. Was looking good over the last month, but after dropping below the mid-way point (red line), want to see that reclaimed to continue upwards momentum.
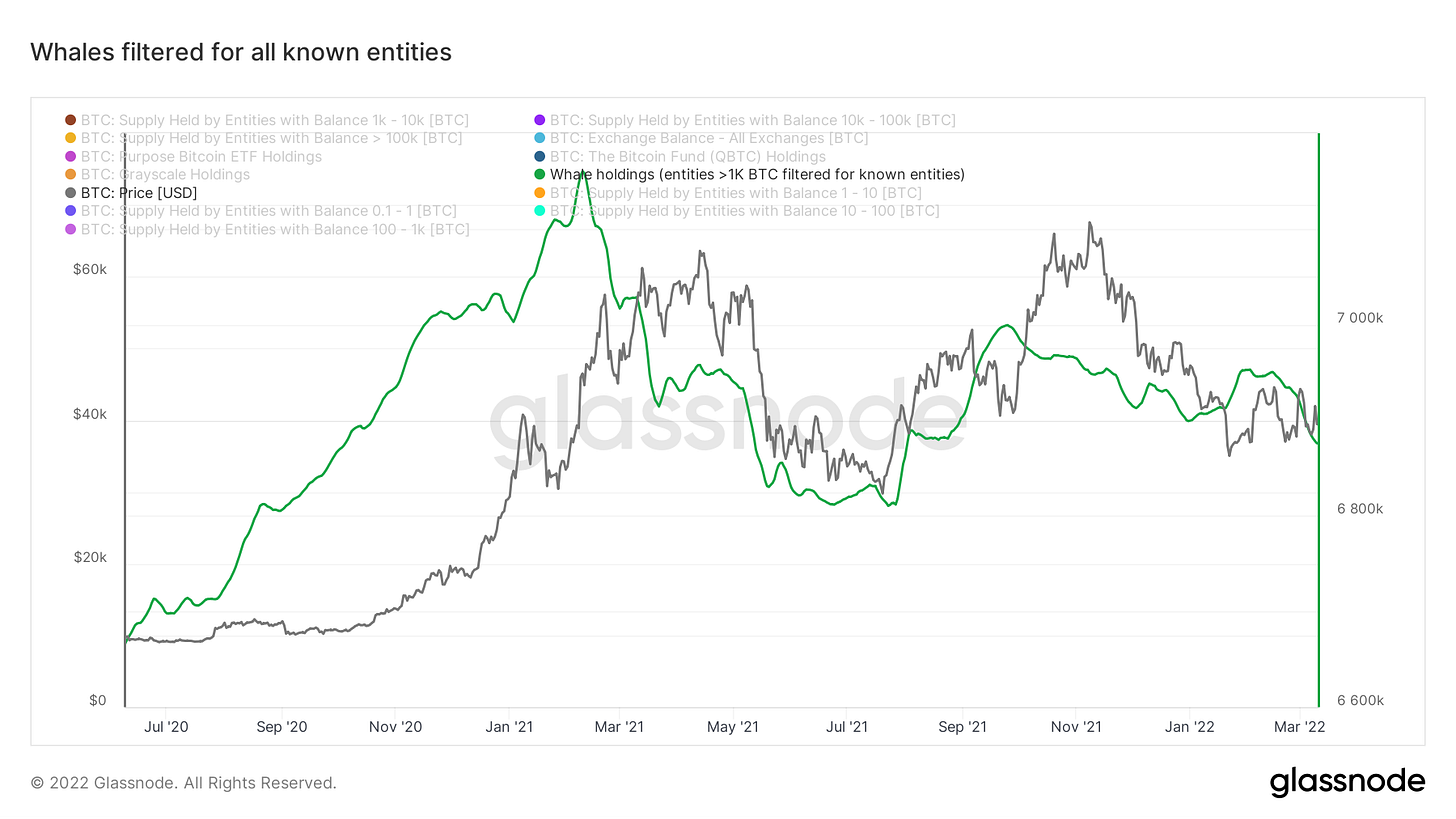
This drop-down is also shown in confluence with whale’s holdings. Over the last 2 weeks, the 7-day moving average of all entities with over 1,000 BTC (filtering out exchanges, grayscale, OTC desks that GN tracks, QTBC, Purpose ETF, etc.) has been trending down. Looks like whales have used these pumps to the upper end of this consolidation to offload some inventory. We’ll keep an eye on this and if there are any spicy developments will keep you notified.
This chart above can also be visualized by the chart below, which is a trend score of all the cohorts by size that Glassnode tracks (0.1-1 BTC, 1-10 BTC, 10-100 BTC, 100-1,000 BTC, 1,000-10,000 BTC, 10,000+ BTC). When the colors are darker, there are bigger entities increasing their holdings. (darker colors = big boys go nom nom nom)
Mining
New Generation Mining Rigs Are Safe Haven “Bitcoin Dividend” Assets
Blockware Intelligence just published a new mining research report titled, New Generation Mining Rigs Are Safe Haven “Bitcoin Dividend” Assets.
This section of the newsletter will be highlighting the key points of this research piece, and it will include the “network stress test” that highlights the cash flow safety of new generation rigs.
Abstract
As the macro landscape weighs on markets all over the world, many investors are flocking to traditional safe-haven assets. The Russian invasion of Ukraine, record-high inflation in the US, and a hawkish federal reserve have led to the price of Bitcoin falling from $69,000 to $38,000. While unconventional, new-generation mining rigs provide a unique opportunity for investors. Because of the algorithmic supply dynamics in the Bitcoin network (difficulty adjustment), these new rigs enable miners to earn a consistent positive cash flow even in the face of extreme volatility. Last, your machine dollar-cost averages into Bitcoin at a discount, which enables you to still capture massive future potential upside.
Key Points
Bitcoin’s historic Sharpe ratio outpaces all other asset classes.
Price is highly volatile, but that is the price investors pay for massive returns.
The S19XP has a very high operating margin (80%+) even after accounting for the recent price drop and increase in mining difficulty.
After a theoretical stress test on the price of Bitcoin, new generation machines would still be earning positive returns as old generation machines turn off first.
More Bitcoin would be mined by the new machines as old generation machines turn off.
At $19,000 BTC, an S19XP would still have an operating margin > 50%.
As ASICs commoditize, the new generation machines today have the potential to last significantly longer than older generation ASICs.
The time to deploy capital is now. By the early 2030s, 97% of all Bitcoin will be mined (currently at 90%). Demand inevitably will far exceed supply for the world's most valuable asset.
Network breakdown and volatility stress test on miners
In order to evaluate how a new generation machine would perform under extreme price volatility, it’s important to estimate the current breakdown and distribution of the global mining network. While it is impossible to know exactly what machines are currently hashing and how much they are paying for electricity, we can compile research from CoinShares and Blockware Solutions clients and partners.
Below is CoinShares Research’s estimate for the total network hash rate by hardware unit.
This hash rate distribution analysis from January 2022 can be broken down into three large buckets.
S9 - 22.8%
S17 (includes Whastminer M20s and Avalon 11s) - 11.4%
S19 (includes Whatsminer M30s and Avalon 12s) - 65.8%
Since the global hash rate has now grown to ~ 200 EH, we can assume that all additional network hash rate can be allocated to the S19 (and related models) bucket.
S9 - 20.0%
S17 (includes Whastminer M20s and Avalon 11s) - 10.0%
S19 (includes Whatsminer M30s and Avalon 12s) - 70.0%
In addition to hardware distribution breakdown, we can estimate miner electricity rate distributions using old Blockware research which was based on data obtained from client and mining pool relationships. For simplicity, this breakdown remained the same from the prior analysis completed in 2020.
https://www.blockwaresolutions.com/research-and-publications/2020-halving-analysis
From the 2022 CoinShares Research and the 2020 Blockware Research, we can estimate which hardware gets allocated to which electricity rate layer. In general, it is logical to assume that older generation machines inevitably move to the cheaper layers and new generation machines trend toward the more expensive layers.
Old generation machines move toward the cheaper electricity layers because that is where they are most profitable and the ROI is most attractive after accounting for both OpEx and CapEx. New generation machines typically get plugged into the more expensive electricity layers as that is where new hosting capacity is available, and it is the most attractive after accounting for both OpEx and CapEx at scale.
Expanding this breakdown further we can determine the breakeven price of each hardware unit group and each electricity layer.
This is calculated using a Bitcoin price of $44,500 and a hash price of $0.20.
Last, we can perform a stress test to see what machines would shut off before your machine. Since the S19XP is more efficient than older generation machines, ~ 89.2% of the network would have higher Bitcoin breakeven prices than an S19XP on layer 8 (paying ~ $0.07 per kWh).
Stress Test - Scenario: Bitcoin price falls to $19,000
At $19,000, ~ 11.5% of the network would have a breakeven price above the current Bitcoin price, meaning that those ASICs are now unprofitable.
If the price sustained this low level for an extended period of time, we could expect the network difficulty to drop by -11.5% as a result. Interestingly, as network difficulty drops, the BTC breakeven price for the remaining machines decreases.
An S19XP on layer 8 watched its breakeven price drop from $8,036 to $7,207. This is because the machine now will earn more BTC as a result of the drop in difficulty.
This means even at $19,000, an S19XP would have > 50% operating margins, and if the price fell further, then the breakeven price would continue to drop as the inefficient miners continued to drop off the network.
This is how new generation mining rigs protect your portfolio against short-term volatility. As weak inefficient miners can’t continue running profitably, you get rewarded with more Bitcoin.
Bitcoin Mining in Practice
While the Bitcoin mining case is compelling, it is difficult to procure ASICs, build large mining facilities, and source cheap scalable electricity all on your own. As an institution, hedge fund, or high net worth individual, it makes sense to purchase and host ASICs with a trusted partner like Blockware Solutions.
With Bitcoin mining experience dating back to 2013, Blockware Solutions has sold over 250,000 ASICs, hosted 200+ MW of clients, and mined thousands of BTC from the Blockware Mining Pool.
If you are looking for a trusted partner to assist you in deploying capital to the Bitcoin mining space, Request a Quote from Blockware Solutions.


