Blockware Intelligence Newsletter: Week 69
Bitcoin on-chain analysis, mining analysis, macro analysis; overview of 12/30/22-1/6/23
Blockware Intelligence Sponsors
If you are interested in sponsoring Blockware Intelligence email: sponsor@blockwaresolutions.com.
Blockware Solutions - Buy and host Bitcoin mining rigs. Now is the time to start mining BTC. Both S19j Pros and S19 XPs are available for bulk purchase.
Summary
Stemming from a recessionary narrative shift in the Treasury market, we’ve seen an overall weak, albeit low volume, past few sessions from the equity market.
December CPI is to be released before the open on Thursday, January 12th.
Bitcoin saw a slight bounce on Wednesday, but is structurally unchanged from the sideways price action of recent weeks.
General Market Update
The team at Blockware Intelligence wants to start out the first newsletter of the year by wishing everyone a happy and healthy 2023. Fingers crossed for a profitable one too.
Following two consecutive shortened trading weeks, and a quiet week of economic data releases, there isn’t too much to update for this week.
We received the FOMC minutes on Wednesday, which didn’t provide much change from what market participants were expecting to hear from the Fed. FOMC officials stated that they do not foresee any rate cuts for 2023.
FOMC forward predictions don’t tend to be very accurate, but decide for yourself whether you believe that the Fed will be forced to pivot, or if Powell truly has the spine to crush demand.
Nasdaq Composite Index, 1D (Tradingview)
On Tuesday, the Nasdaq Composite gapped up nearly 1% at the open. Within 10 minutes, we saw that the pre-market strength attracted sellers as the index reversed to close down 0.76% on the day.
To be frank, this was slightly unexpected. The final day to sell stocks to harvest capital losses for 2022 tax deductions was on December 28th. For this reason, many analysts believed that we would see a short rally to start out January. The price action from the 29th and 30th appeared to be an early validation of this theory.
But as you likely know if you’re a consistent reader of this newsletter, the market rarely does what the masses are expecting. Based on Tuesday’s price action, it would appear that a retest of the October 13th lows is in the cards for January.
That being said, Blockware Intelligence unfortunately cannot see the future.
Wednesday saw similar price action, at first. The index gapped up to begin the session and then faded mid-day. By the close, we saw an upside reversal, albeit on fairly weak volume.
On Thursday, we saw another weak session as the Nasdaq closed down nearly 1.5% on the day.
The chart above shows the average monthly return of the S&P 500 dating back to 1900 plotted next to the finalized returns for 2022. As you can see, it was obviously an extremely volatile year.
If you’re reading this, congratulations! You survived the toughest market year since the 2008 financial crisis.
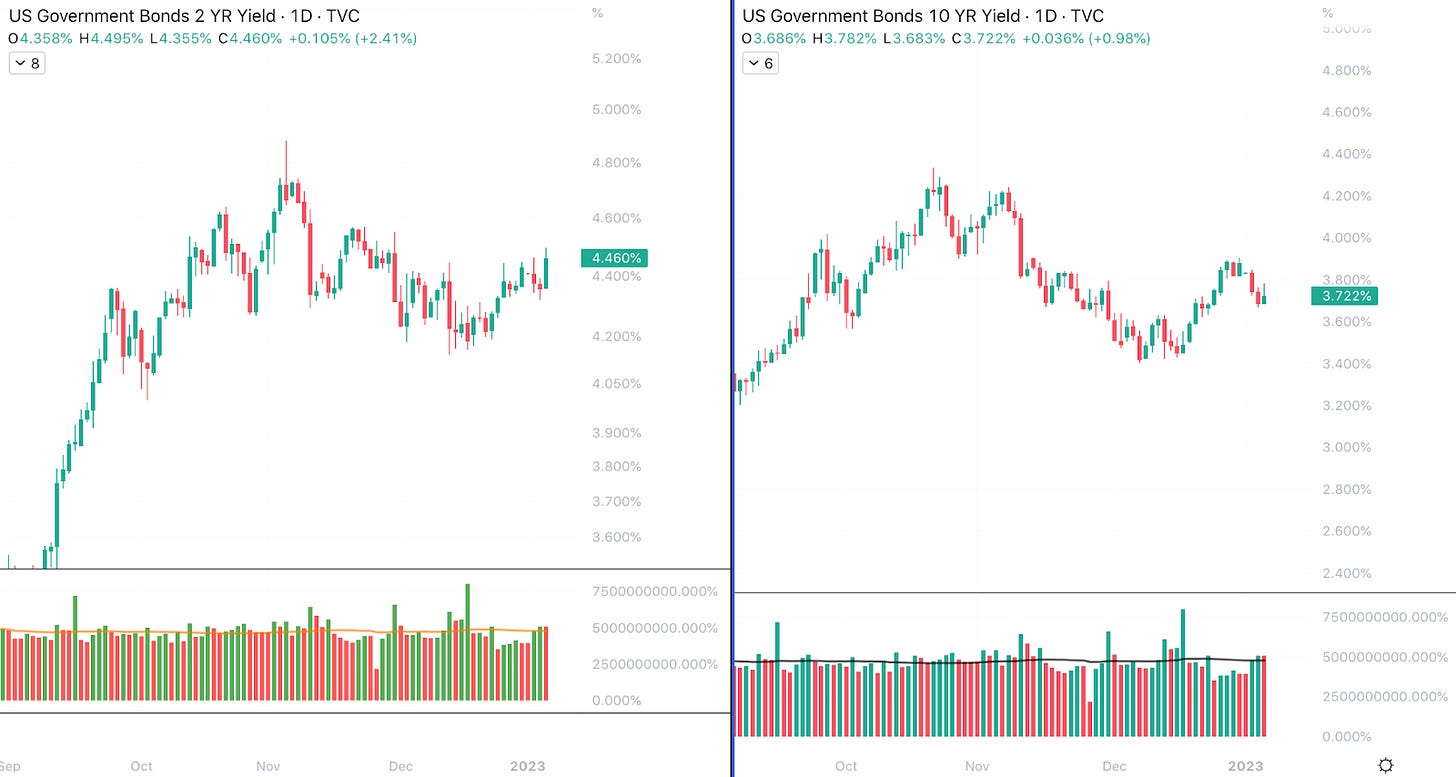
Driving the weak price action from equities was an even weaker few sessions from shorter maturity Treasuries.
In the later weeks of 2022, and now in 2023, we’re seeing a narrative shift underway from the fixed-income market. Earlier in 2022, the narrative from the bond market was that a sharp rise in yields was coming as the result of historically high inflation.
Inflation means that we’re seeing a steep decline in the purchasing power of $1, for that reason, the value of the future interest payments and principle to be received from buying and holding a bond is lower.
Now, as the inflation narrative is well priced into the market, the narrative appears to be shifting towards traditional recessionary price action. In these types of environments, investors seek the protection from recession by tying up their money into long-term fixed-income securities.
US 2-Year vs. 10-Year Treasury Yield, 1D (Tradingview)
As previously mentioned, this week we’ve seen a rise in the yield of shorter dated Treasuries, and a decline in the yield of longer-dated ones. The 2Y yield is up ~3bps this week, while the 10Y yield is down ~16bps.
As a reminder, yield and price are inverses. Therefore, the 2Y price dropped while the 10Y price rose, as investors see greater interest rate, market, and credit risk in the short term.
As we head into next week, keep in mind that December's CPI data will be released 1 hour before market open on Thursday, January 12th.
Crypto-Exposed Equities
With the slight bounce we saw from Bitcoin on Wednesday, it wasn’t much of a shock to see swift bounces from many crypto-equities.
These stocks have been sold quite aggressively in recent weeks, therefore it doesn’t take too much buy pressure to produce a sharp bounce higher. Furthermore, these names were one of the easier shorts of 2022, and are generally sitting on extremely high levels of short interest.
That being said, one bounce from their lows up into short-term moving averages likely isn’t anything to get overly excited about.
Greenidge Generation, 1D (Tradingview)
The most eye catching price action from the miners came from Greenidge Generation (GREE) on Wednesday. On seemingly no news, GREE was up nearly 72% at one point in the session.
GREE then put in a fairly large reversal to close up 32% on the day. This is likely simply the result of a remotely large position being built in an EXTREMELY illiquid stock.
GREE only trades at $0.40 per share and has an average daily trading volume of $277,000. Personally, I use $20,000,000 daily volume as my benchmark for adequate trading liquidity.
In other news, it was released Thursday morning that Silvergate Capital was indeed impacted by the FTX contagion, and was forced to sell assets to cover ~$8 billion in customer withdrawals. Furthermore, roughly $150M of SI’s deposits were from customers who have filed for bankruptcy.
On this news, SI shares were down nearly 43% at the close yesterday.
Per usual, the chart above shows the Tuesday-Thursday performance of several crypto-equities in comparison to BTC and Valkyries Mining ETF.
Bitcoin Technical Analysis
In the world of Bitcoin price action, there isn’t much to update this week.
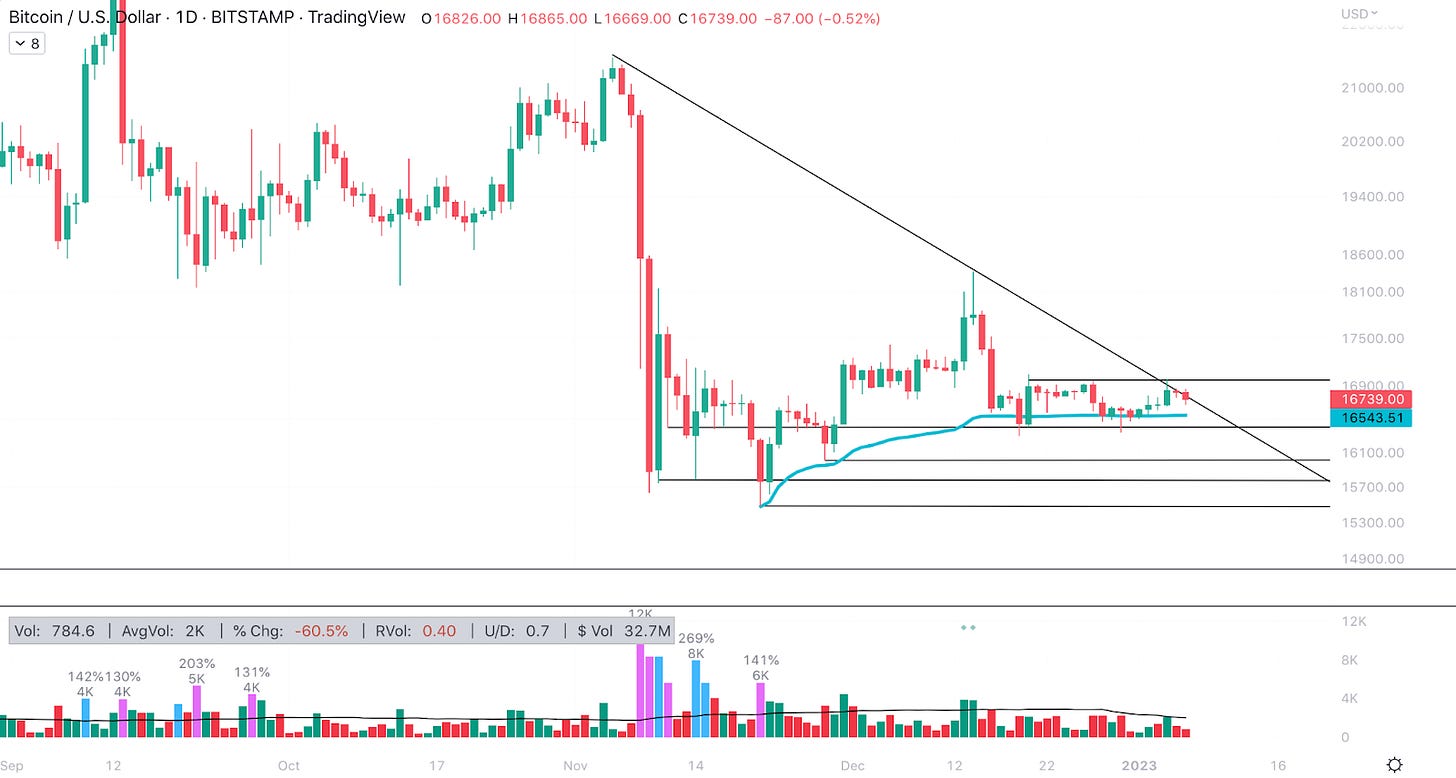
Bitcoin/US Dollar, 1D (Tradingview)
Although we did see a small $175 bounce on Wednesday, BTC has basically gone straight sideways since mid-December. So while there hasn’t been any exciting updates on the spot USD denominated value, it has been very interesting to see the slight degree of decoupling from the equity indexes underway.
It would appear that with all of the bearish news in the crypto market in recent months, investors were obviously much more bearish on crypto than they were on stocks. This created the short, aggressive sell offs in November and mid-December, and now the quietness as investors await macro signals.
In the time being, $17,000 appears to be the major level that investors are watching as a signal to get long in the short-term.
Bitcoin Onchain and Derivatives
The cost basis of short term holders is now under $18,000. It shouldn’t be much longer before this keynote resistance level is tested.
To reiterate from previous editions of the newsletter, we view this as the most important on-chain metric for determining the short-term path of the BTC price for this reason: when the price is equal to the cost basis of short term holders, they are provided with an opportunity to ‘breakeven’ on their BTC purchase. Long term holders do not have this same behavior with regards to price as they are not interested in making quick fiat-denominated gains.
Barring a macro-induced liquidity crunch affecting all markets, we can expect BTC to continue trading relatively sideways until it encounters this resistance level.
Zooming out, it still is an incredible opportunity to acquire BTC if you have a long time horizon. Even were the price to drop another leg down, entering the market at this point would give you a lower cost basis than a majority of market participants, as evidenced by the price being below the aggregate cost basis of the network (realized price.)
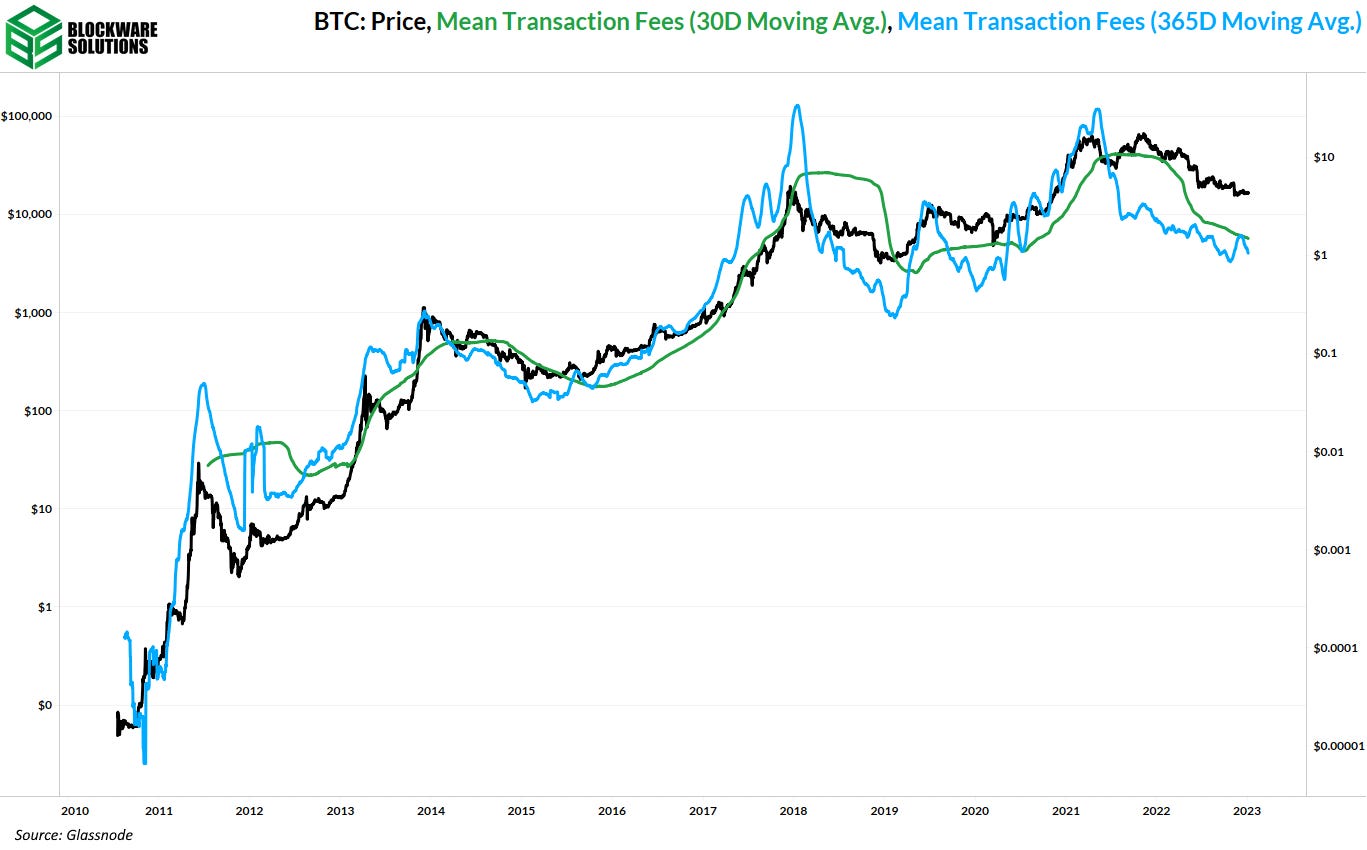
Looking at transaction fees does a good job of encapsulating the current market environment in Bitcoin. Fees have not been this low since prior to the beginning of the last bull market in late 2020. This is indicative of the “boring” state of the market. The weak hands have come and gone, demand for transactions is low, prevailing sentiment is incredibly bearish, and a limited time opportunity to buy Bitcoin at an extreme discount has presented itself.
The position of the 30-day moving average of transaction fees relative to the 365-day moving average is a signal we are watching as we look for any signs of new life in the market.
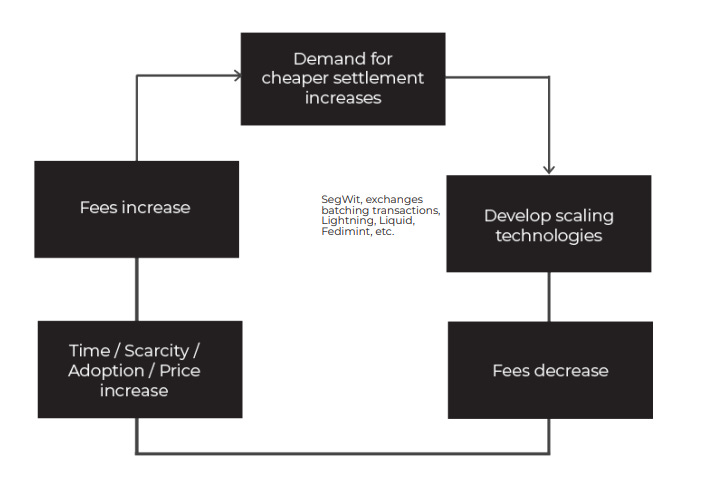
The flowchart below (borrowed from this Blockware + Riot Report) illustrates the cyclical nature of Bitcoin transaction fees. The lightning network serving as a viable scaling solution, coupled with the lower demand courtesy of the bear market, has transaction fees reaching a (likely) local bottom). The next phase in the cycle is increased Bitcoin adoption and a higher price; which will lead to higher layer 1 transaction fees.
The mania of accumulation from smaller on-chain entities has mostly died down. The supply held by entities with 1-10 BTC has increased by ~6,800 BTC over the past seven days compared to a weekly increase of over 60,000 BTC in the immediate aftermath of the FTX collapse. Keep in mind, retail-sized entities are still accumulating, but with less eagerness than when the price initially dipped.
We have reached somewhat of a stalemate between buyers and sellers at this $16.5k - $17k range. Whichever side runs out of steam first will determine which direction the price breaks. In the long run, the buy side will never run out of steam as Bitcoin HODLers will continue to buy even if the price goes lower.
Notice how each leg down in price has resulted in increasingly large accumulation by HODLers. The drop to $30k last May had a spike of accumulation, the drop to $20k had a larger spike, and the drop to $16k had an even larger spike.
A point to note is that the massive accumulation coincided with a slight spike in the number of active addresses.
My theory here is that you have two groups of people who bought the dip. First is the HODLers. These are your diehard Bitcoiners that are stacking sats all the time regardless of the price; a daily DCA strategy. The second group is more methodical; not necessarily buying everyday but waiting for massive dips to deploy large amounts of capital.
The on-chain data supports that theory. The spike in active addresses both at the initial drop to $20k as well as the drop to $16k indicates a greater quantity of users accumulating on the network. The slight drop off in active addresses shows the second group has got their stack at this price level and is now waiting to see what happens. But the still positive accumulation by retail is indicative of the HODLers that are daily DCA’ing.
Both strategies, the daily DCA and the “wait for a massive-dip to deploy capital”, have merit. It’s up to each individual to approach the current environment as they see fit. Having dry-powder to deploy in the case of another March-2020 type of dip is nice. However, sats at the current price are objectively valuable for the long-term and sacrificing the opportunity to buy here in hopes of a lower price could result in getting burned.
To continue hammering on the theme of diminishing activity and sideways price action in the market, the two week measurement of realized volatility is at an all-time low.
The funding rate on perpetual futures has been positive for the past few weeks; meaning that long positions have to periodically pay short positions.
What we are not seeing is a massive buildup in futures volume alongside the positive funding rate. While the volume of futures does remain relatively high with respect to BTC’s market cap, there hasn’t been a significant increase in actual futures volume. That further illustrates the diminishing presence of speculators and short-term market participants.
The last chart I want to show is the performance of Bitcoin vs other assets since the last macro crises in March of 2020. Bitcoin is still up tremendously and no asset comes close.
Since March 20th, 2020:
- BTC +169%
- S&P +65%
- NDSQ +50%
- VNQ +38%
- Gold +24%
- ARKK -19%
Bitcoin Mining
ARBK and CORZ
Argo Blockchain and Core Scientific are two names in the public mining space that recently received an inflow of capital. Argo (ARBK) agreed to sell its Helios mining facility in Texas and its related operations to Galaxy Digital for $65M. This greatly reduced its total liabilities and potentially enables them to survive the bear market. Core (CORZ) just received $17M from Blackrock as a convertible note. It’s questionable how much the current CORZ equity holders will get back as the company restructures, but the secured debt convertible noteholders will get equity from the restructuring plan.
Miner Capitulation
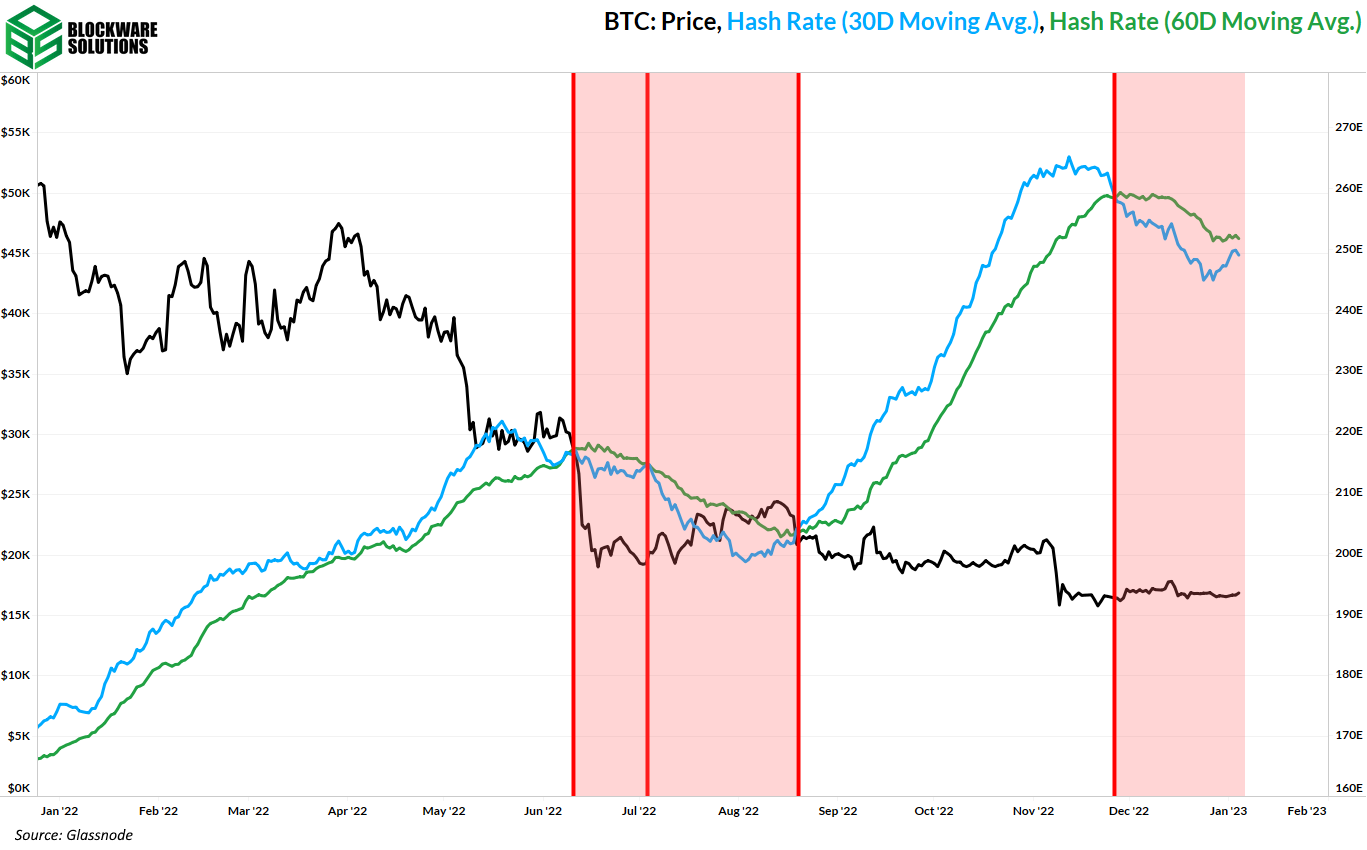
The second wave of miner capitulation started at the end of November 2022. Now starting off the new year, hashrate is back in an uptrend, and this temporary capitulation according to the hash ribbon metric may be almost over. Once miner capitulations end, that historically has left little future downside for BTC.
Energy Gravity
The following chart is based on a previous Blockware Intelligence Report that models the relationship between the price of Bitcoin and its cost of production. The model makes it easy to visualize when the price of Bitcoin is overheated or in the process of bottoming.
ASIC Breakeven Prices
The table below shows where various ASIC models will become unprofitable and likely shut off after a period of time.
All content is for informational purposes only. This Blockware Intelligence Newsletter is of general nature and does consider or address any individual circumstances and is not investment advice, nor should it be construed in any way as tax, accounting, legal, business, financial or regulatory advice. You should seek independent legal and financial advice, including advice as to tax consequences, before making any investment decision.


