

Blockware Intelligence Newsletter: Week 215
Bitcoin on-chain analysis, mining analysis, macro analysis; overview of 6/15/26 - 6/19/26

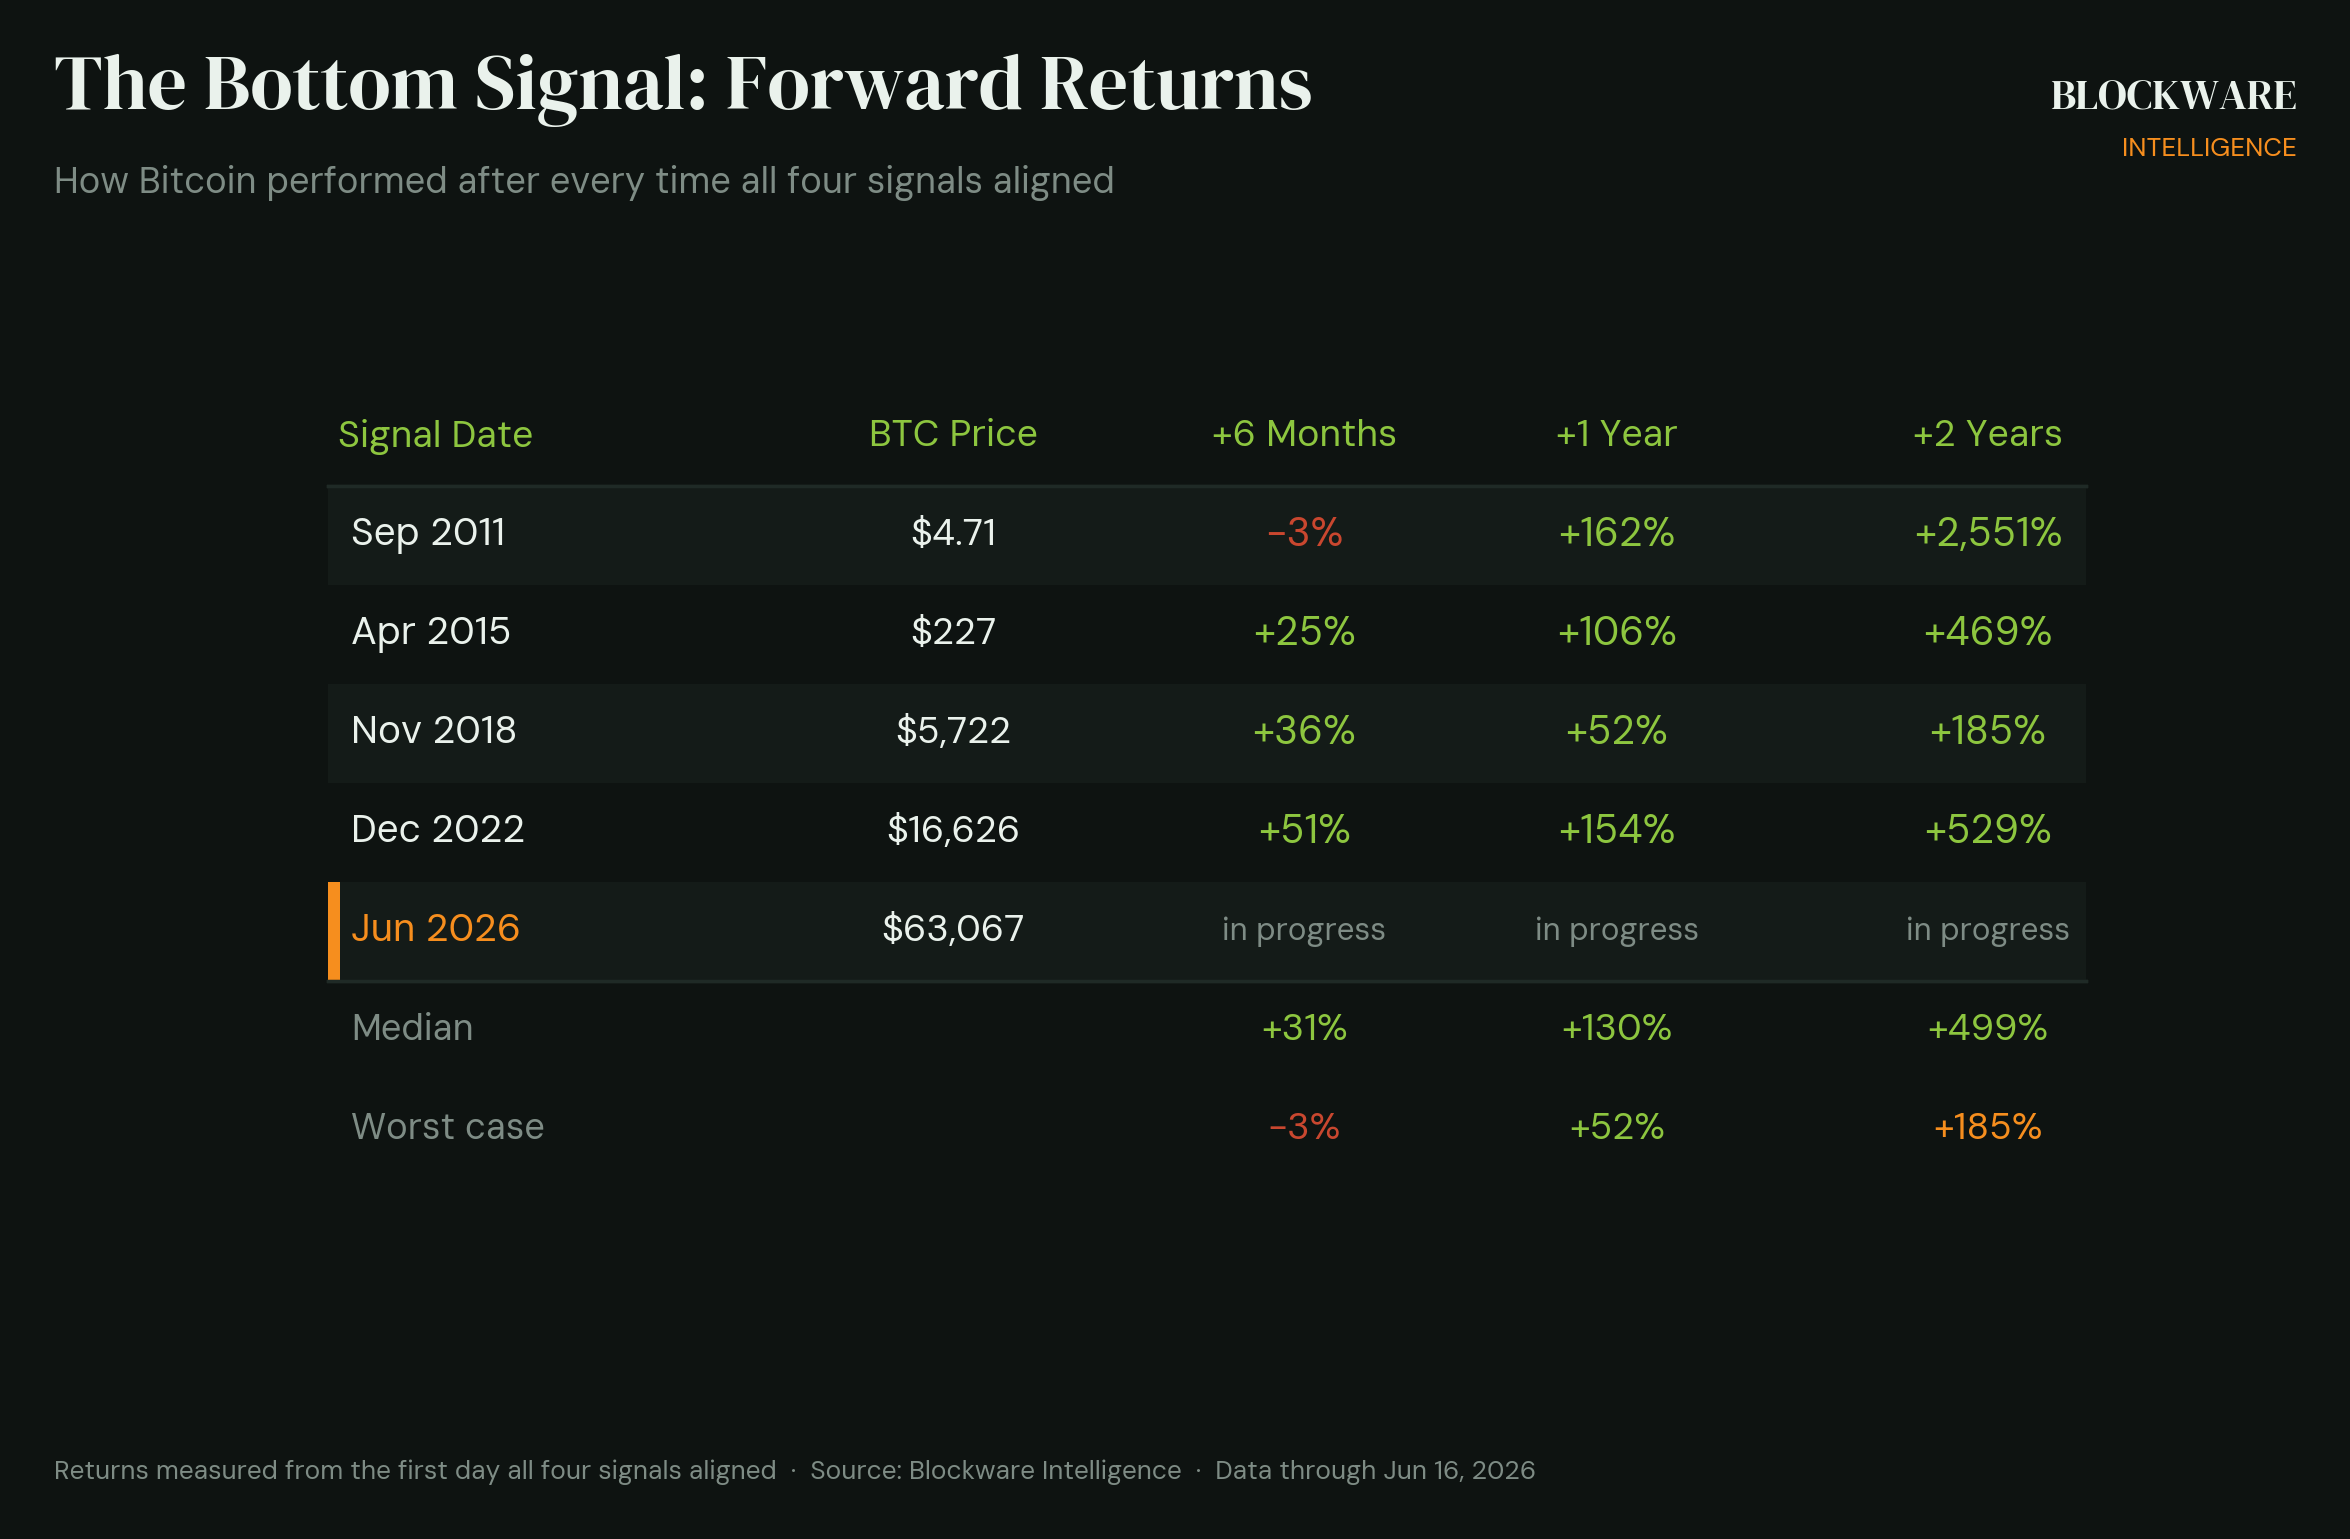
Four on-chain conditions just aligned for the fifth time in 15 years. Every prior alignment marked a cycle bottom.
Bitcoin trades near $64,000 this week, down roughly 50% from its bull market high high. By the standard of previous bear markets, that is a shallow drawdown. The picture underneath the price is heavier than the price alone suggests.
Four separate on-chain conditions have moved into bottom-zone territory at the same time. Each one carries a long history of marking the floor of Bitcoin bear markets. Read alone, any single metric can mislead. Read together, they form one of the most reliable bottoming signals in Bitcoin’s history.
These four conditions have aligned only five times in 15 years. The fifth alignment registered last week.
Every prior instance marked a cycle bottom. One year later, Bitcoin traded a median of 130% higher. Two years later, the median gain was 499%. The weakest one-year outcome in the entire sample was still a 52% gain.
We never read a single metric in a vacuum. Markets are dynamic, and every data point needs context from the data around it. What follows is each of the four signals, the combined track record, and the one structural change that could weaken the pattern this time.

Source: Blockware Intelligence. BTC price, log scale. Data through June 16, 2026.
Here is what each of the four signals measures, where each one sits today, and why the confluence matters.
Signal 1: Percent Supply in Profit

Share of all bitcoin whose last on-chain move was at a lower price than today.
This metric measures the share of all bitcoin whose last on-chain move happened at a price lower than today. When it sits well above 50%, most of the network holds its coins at a gain. When it falls to 50% or below, roughly half of all coins in existence are underwater.
That lower condition is rare. It has only appeared at the depths of past bears: 2012, 2015, 2018, the March 2020 Covid crash, and 2022. The metric just dropped to that line again and reads near 50% today.
Bitcoin is only down about 50% from its high, which looks mild next to past cycles. The pain underneath that number runs deeper. Roughly half of every coin in circulation last changed hands above $63,000, which puts roughly half the market in the red. We can measure this precisely because every coin records the price at which it last moved on-chain. Pain at this scale has historically clustered at market bottoms.
Signal 2: The Hash Ribbon

Ratio of the 30-day to the 60-day moving average of Bitcoin network hash rate.
The Hash Ribbon compares the 30-day moving average of network hash rate against the 60-day moving average. When the 30-day average falls below the 60-day average, the ribbon is flaring, and that flaring signals miner capitulation. The ratio sits at 0.987 today, below the 1.0 line.
This is the signal we watch most closely at Blockware, because it speaks directly to mining economics. A flaring ribbon means miners are powering machines off, network hash rate is contracting, and difficulty is adjusting lower. Two forces are driving the current capitulation.
The first is the marginal operator. When Bitcoin traded above $100,000, a miner could run older, less efficient hardware at a higher power rate and still clear a profit. As price fell, that margin disappeared and those operators were forced to shut down. These miners are large net sellers by necessity. They sell most of the bitcoin they produce to cover power and operating costs. When they capitulate, that recurring sell pressure leaves the market, and the disciplined operators with efficient hardware and low power costs absorb a larger share of the block reward.
The second force is structural. The largest public miners are leaving Bitcoin mining to host AI compute. The infrastructure overlaps heavily. Land, power capacity, transformers, and containers all transfer from one use to the other. AI hosting contracts lock in consistent revenue for up to ten years, and some of those contracts pay more than mining produced even when Bitcoin traded at $125,000.
The result is a shrinking field of miners competing for a fixed block reward. Blockware clients are currently earning roughly 15% more bitcoin per machine than they were at the start of 2026. Every deep flare in the Hash Ribbon has coincided with a major bottom.
Signal 3: Cost Basis of Coins Acquired in the Last 2 Years

Supply-weighted average price paid by everyone who bought within the past two years.
This signal takes every coin acquired over the trailing two years and calculates the supply-weighted average price paid. That figure currently sits at $88,000. With Bitcoin near $64,000, the average buyer from the last two years is underwater by about 25%.
Price has only dropped below this two-year cost basis during bear markets: 2015, 2018, and 2022. Each of those instances proved to be a strong long-term entry point.
One caution belongs here. Price can remain below this level for an extended stretch. It stayed under the line for roughly a year in 2015, and the 2018 and 2022 episodes told a similar story. This level marks a favorable accumulation zone. It rarely calls the exact bottom to the day. Anyone entering Bitcoin should be working with a time horizon of at least four years. On that horizon, buying below the two-year cost basis has historically rewarded patience.
Signal 4: Long-Term Holder Position Change

30-day net change in the supply held by long-term holders.
The final signal measures the 30-day net change in supply held by long-term holders, defined as any wallet that has held its coins for six months or longer. When the reading is positive, long-term holders are accumulating. When it is negative, they are distributing.
There are only two reasons a long-term holder sells. The first is exuberance, which shows up at the top of bull markets when unrealized gains are largest. That is the source of the deep red spikes in 2013, 2017, 2021, and 2024. The second is capitulation, which shows up at the bottom.
Long-term holders capitulated in February when Bitcoin fell to $60,000. They released coins into the market, and those coins have been steadily absorbed by buyers since. Over the past three months the reading has stayed positive, with long-term holders now adding roughly 43,000 BTC over the trailing 30-day window.
The shift from capitulation to accumulation is the part that matters. Bitcoin’s supply is fixed, demand from the strongest hands is now net positive, and that imbalance tends to resolve through higher prices. The adjustment can lag, but the direction is set.
The Confluence
Each signal carries weight on its own. The reason this week matters is that all four are flashing at once.
Supply in profit near 50%. The Hash Ribbon flaring. Price below the two-year cost basis. Long-term holders accumulating. That specific combination has occurred only five times in 15 years, and every prior occurrence sat at a cycle bottom.
The forward returns from those bottoms were substantial. One year later, Bitcoin posted a median gain of 130%. Two years later, the median gain was 499%. The weakest single one-year result in the sample was a 52% gain.
The overview chart at the top of this issue also marks the near-misses, the moments when three of the four conditions lined up but long-term holders were still distributing. Those instances did not carry the same signal. The fourth condition, long-term holder accumulation, is the confirmation that turns three coincident signals into a historically reliable bottom. As of last week, that confirmation is in place.
If this alignment rhymes with the four before it, the implied floor is roughly $180,000 per bitcoin by the summer of 2028, with a median path closer to $375,000.
Turn the Money You Owe the IRS Into Bitcoin
The same miner capitulation that flashes as a bottom signal is also a direct tailwind for disciplined operators. As weaker miners power down and the largest public miners redirect their fleets toward AI compute, the bitcoin those machines would have produced is redistributed to the miners who remain. That is why Blockware clients are earning more bitcoin per machine today than they were six months ago, even with price lower.
A single filer earning $150,000 in 2026 will owe $24,734 in federal income tax. That capital leaves your balance sheet for good the moment the check clears.
Section 168(k) bonus depreciation offers another path. A Tier 2 Blockware package puts roughly $150,000 of enterprise mining hardware to work, and under current law you deduct 100% of that cost in the first year. That single deduction is large enough to offset $150,000 of income and take that federal tax bill to zero.
The money you would have sent to the IRS buys hardware instead. It runs at a locked power rate across our seven facilities and sends Bitcoin straight to your wallet every single day. A sunk tax expense becomes a Bitcoin-producing asset you own.
See the full strategy at blockwaresolutions.com/info.
This newsletter is for informational and educational purposes only and does not constitute financial, investment, or tax advice. Bitcoin and Bitcoin mining involve significant risk, including the potential loss of capital. Consult a qualified professional before making any investment or tax decision.