Blockware Intelligence Newsletter: Week 56
Bitcoin on-chain analysis, mining analysis, macro analysis; overview of 9/17/22-9/23/22
Blockware Intelligence Sponsors
If you are interested in sponsoring Blockware Intelligence email: sponsor@blockwaresolutions.com.
Blockware Solutions - Buy and host Bitcoin mining rigs to passively earn BTC by adding blocks to the blockchain. Your mining rigs, your keys, your Bitcoin.
Have fun and learn more about our Bitcoin future at Pacific Bitcoin, the largest Bitcoin conference on the West Coast. Nov 10-11 in Los Angeles. Get 30% OFF tickets with code BLOCK.
Located in Europe or want to take a trip? Go to the Bitcoin Amsterdam conference Oct 12-14. Use code: BLOCKWARE for 10% off.
Summary
FOMC’s meeting this week resulted in a 75bps increase to the Fed Funds Rate, putting the upper limit of the range at its highest since 2008.
Despite 75bps being the increase that most market participants were expecting, we’ve seen a selloff in the equity and fixed-income markets as a result.
Bitcoin’s price structure remains largely unchanged from last week with the most likely scenario being a retest of June’s lows around $17,600.
Bitcoin On-Chain metrics show extreme value for BTC
The risk/reward profile for BTC is more attractive than in past bear markets
Global Bitcoin adoption is price ignorant
Riot Blockchain and Blockware Solutions Report Published
General Market Update
It’s been another wild week across the general market with the Fed’s 0.75% increase to the overnight lending rate. As a result, the upper limit of the Fed Funds Rate now sits at 3.25%, its highest value since 2008.
This increase of 2.25% to the Fed Funds Rate we’ve seen across the last 3 FOMC meetings is an unprecedented rate of change in the post-Volker era of the 1990’s-2020’s.
Without a meeting in October, the Fed will now have 1.5 months of data before determining their next interest rate move on November 2nd.
Fed Funds Rate Upper Bound (@LizAnnSonders)
The current 3.0-3.25% range for the FFR puts us into what Powell referred to as “the very lowest level of what might be restrictive”. A restrictive market interest rate refers to a level at which high interest payments will begin to suppress demand and bring down inflation.
According to Fed officials, they believe that we’ve now entered that range. In reality, it could very well be quite a bit higher.
The Fed likely believes that the restrictive range for the FFR is from about 3-4.5%, which means that in order to aggressively tackle inflation, we will likely see the Fed raise rates by another 1.25% in the remaining 2 meetings left for 2022.
The question then will be whether that level is enough to bring down CPI inflation. It’s very possible that this historically high supply-side inflation will take greater than the Fed’s 4.6% median 2023 FFR estimate to be resolved.
The 75bps hike was the rate increase that the market was expecting, as we’ve discussed in this newsletter for the last several weeks. But just because we got the rate increase that was “priced in” didn’t necessarily mean that we would see a bounce in the markets.
In fact, we got quite the opposite on Wednesday with the downside reversal we saw across the major equity indexes. On Thursday and Friday, we’ve seen a continuation of this selling.
Nasdaq Composite 1D (Tradingview)
After running into its 10-day EMA on Wednesday, the Nasdaq ultimately reversed to close -1.79% on strong volume.
As of Friday morning, price is right around a potential support zone of ~$10,800, but it would appear that a retest of the YTD lows at $10,565 would be most likely, as discussed in this newsletter last week,
We would not be surprised to see the index form a short and aggressive rally at or before reaching those lows. The index is now quite oversold below key moving averages and some short-covering is likely to take place.
This market proved on Wednesday that even though 75bps appeared to be priced-in, the market is clearly not at the point where bad news is good news.
When the news cycle or economic data has been extremely poor we will eventually reach a point that more bad news causes a bounce in the market. This is because there is simply nobody left to sell, and tends to mark the bottom of bear markets.
Based on Powell’s speech on Wednesday, and the market's reaction to it, we’re clearly not at the reactionary point of a market bottom.
Furthermore, Treasury securities have been selling off for a long time now but in the last week or so, since August’s CPI numbers came in, that selling has really intensified with 9 straight days of positive yield.
US 2-Year Treasury Yield (Tradingview)
On Wednesday, we saw the 2 Year’s yield crack above 4% for the first time since 2007.
The Treasury market is signaling to us that the Fed now has even more work to do to create price stability, and that there’s likely still pain to be felt from investors. Higher than expected CPI values invalidate the work done by the Fed to bring down demand.
This says to us that although headline CPI inflation may be coming down slightly over the last couple of months, we are extremely far from being out of the woods.
As we discussed in the beginning of this letter, there’s still a lot of room for the Fed to move rates and hold them there. The selloff in the fixed-income market is reflecting this.
High yields on shorter-dated Treasury notes like the 2-year are a screaming signal to the Fed that the market can handle, or wants, higher rates.
US 2/10Y Treasury Spread (FRED)
Furthermore, on Wednesday the 2/10Y Treasury spread closed at -0.51, its lowest value since 1981. Simply put, the Treasury market is indicating that investors are the least confident in short-term economic conditions in over 40 years.
Crypto-Exposed Equities
There isn’t much to update on the crypto-exposed equity front beyond what we can say about the stock market, and Bitcoin.
These stocks have been very weak for quite some time now and this week has been no different. After Thursday’s continued selloff, many of these names are at or near their YTD lows.
This could be a signal that Bitcoin may do the same shortly. This wouldn’t be the first time that price action in crypto-related equities has been a leading indicator of what’s to come from BTC itself.
There are names that are relatively strongER than the rest of the group. As of Thursday, I would say that RIOT, IREN, MARA, BRPHF, COIN, and HUT fall into that category.
These stocks are all selling for a discount and this is likely one of the greatest opportunities to dollar-cost average names for cheap. That being said, investors should absolutely do a deep dive into the financials of the companies whose shares they wish to purchase.
With the general market and price of BTC where it is, it places extreme financial pressure on these companies. While this newsletter never provides investment advice, be sure to understand exactly what it is you’re buying into.
Above, as always, is the excel sheet comparing the Monday-Thursday price action of several crypto-exposed equities.
Bitcoin Technical Analysis
Not too much has changed since last week’s newsletter in terms of what we’re expecting from BTC’s price action.
BTCUSD 1D (Tradingview)
On Thursday BTC got a solid 5% bounce around the support level of ~$18.6K, but at the time of writing on Friday morning, it doesn’t look like we’re going to see much follow-through.
The strength that BTC showed over the major equity indexes on Thursday was of note, but Friday’s decline has been enough to drag BTC down with it.
BTC’s primary trend remains bearish with the next major support level being at the YTD lows of $17,567.45. As discussed in this newsletter last week, the most likely scenario is a test of that low.
Whether we hold it or break through it is anyone’s guess.
Bitcoin On-chain and Derivatives
BTC has spent another week teetering around the $19k range.
All of our favorite valuation metrics remain at near record low levels, indicating that BTC is extremely cheap right now.
Short Term Holder Realized Price and Long Term Holder Realized Price are now within $200 of each other. These metrics crossing will likely occur before next week's newsletter. Dollar Cost Averaging in this range has historically led to high returns.
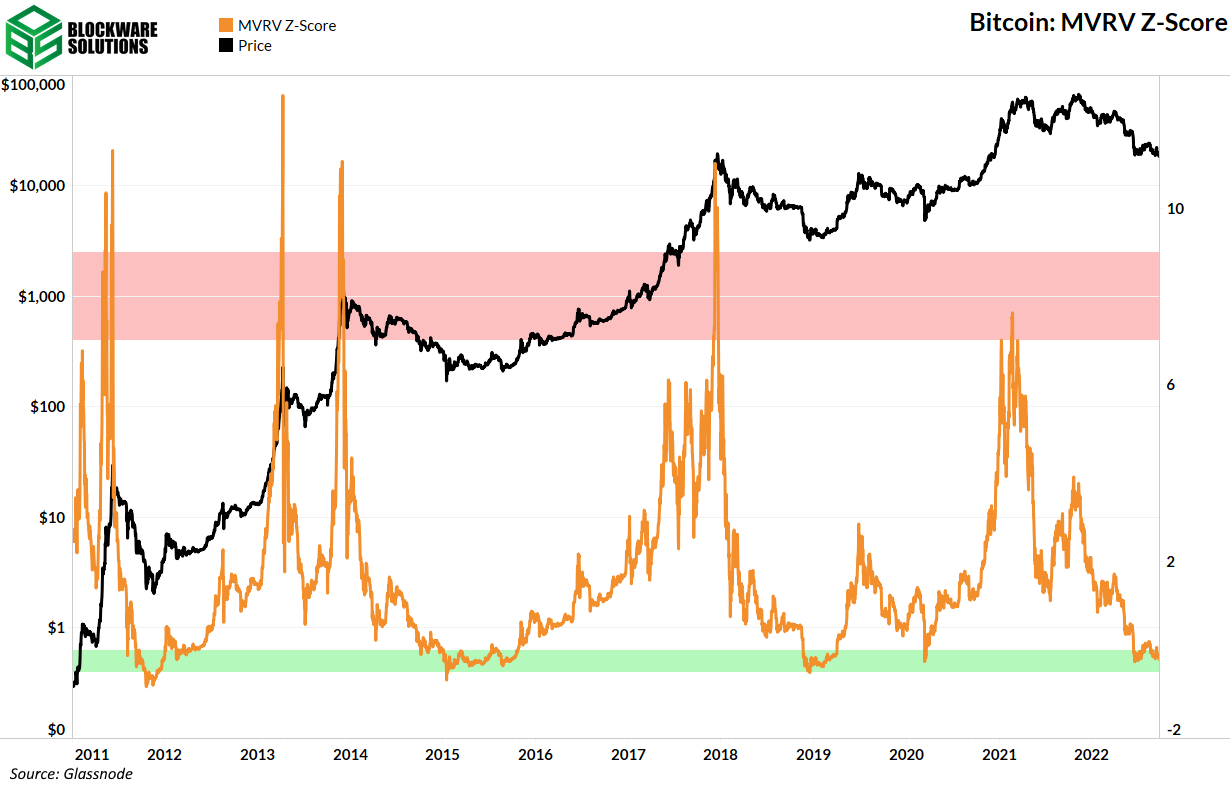
MVRV Z-Score is calculated by subtracting realized cap from market cap and then dividing by the standard deviation of the market cap. This metric is used as a gauge for how cheap or expensive BTC is relative to its realized price.
The range MVRV Z-Score is in now has historically signaled Bitcoin bottoms.
Puell Multiple divides the daily issuance value of BTC by the 365 day moving average of the daily issuance value. If we continue to crab in the current price range through November we can expect this metric to exit the value zone as last year's all-time high, and the high prices before and after, will no longer be included in the denominator of the calculation. However, if we go lower before then, the numerator in the calculation will of course decrease and Puell Multiple could go lower.
Either way this metric is showing extreme value right now.
One particular metric has historically been a phenomenally accurate indicator of exact BTC bottoms. Before we discuss that metric we must first look at Coin Days Destroyed.
We discussed CDD on the newsletter a few weeks ago but as a reminder, this metric shows on-chain movement of BTC with each coin weighted by the last time it was moved on-chain. For example: if you move 10 coins that were last moved 10 days ago you will create 100 coin days destroyed. If you move 1 coin that was last moved 100 days ago you will also create 100 coin days destroyed. This allows you to measure time and volume.
CDD is currently low which signals that generally speaking the old coins (coins that haven’t moved in a long time) are staying put.
Coin Days Destroyed has two dimensions, price and volume. Multiplying it by the USD Price adds price as a third dimension; dubbed Value Of Coins Destroyed (VOCD).
The metric below is called Cumulative Value Days Destroyed (CVDD). CVDD is a ratio of VOCD and the age of the market (in days). Willy Woo created this metric and his article here explains it in further detail. The TL;DR is that this metric is potentially useful in serving as a lower bound during Bitcoin bear markets.
In the 2015 and 2018 bear markets the lowest daily closing prices for BTC reached within 12% and 11% of CVDD respectively. Should this metric produce similar results this bear market then we would see a bottom bitcoin price of around $16,500; slightly below the $17,700 tag that it reached briefly, but was unable to hold, in June of this year.
“HODL Bank” is similar to the numerator of CVDD above. Rather than summating Value of Coins Destroyed (VOCD), HODL Bank summates the 30 day rolling median of VOCD in order to eliminate exchange wallet migration transactions from the equation.
When Bitcoin holders HODL BTC they are choosing not to sell, presumably because they believe the price will go higher. HODL Bank represents the cumulative value in dollars that Bitcoin holders have not sold at; or in other words: the cumulative opportunity cost. This resistance to sell can be interpreted as holders being confident in Bitcoin long term.
Understanding HODL Bank sets us up for…
…Reserve Risk.
Reserve Risk = Price / HODL Bank
This creates a ratio of the BTC price and the confidence level of holders.
Reserve risk is currently at an all time low. There is an extreme mismatch between the price and confidence level of holders. The risk/reward ratio of Bitcoin has never been greater. Even past bear market bottoms did not have as great of a risk/reward opportunity as we have right now.
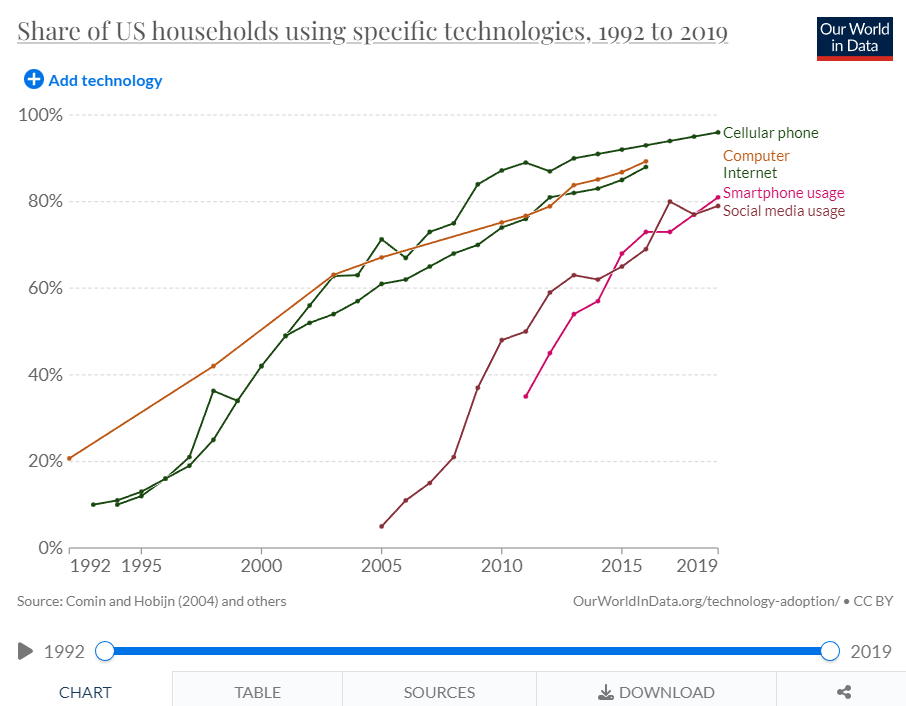
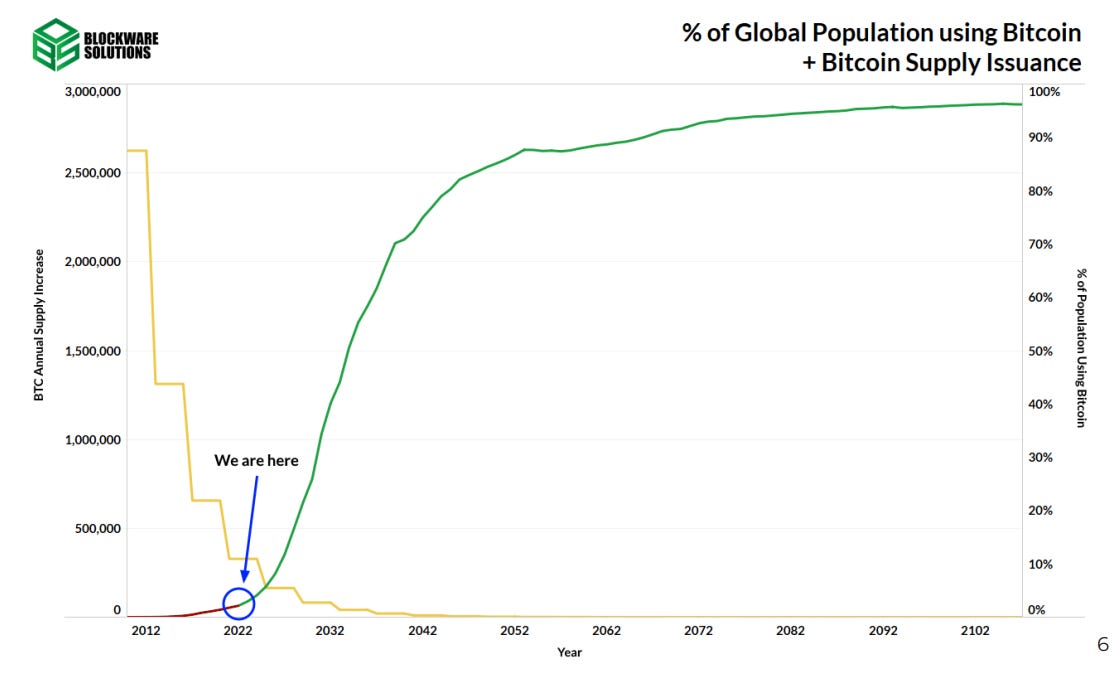
Earlier this year we published a User Adoption Report. The main idea of this report is that Bitcoin has an underlying “S Shaped Adoption Curve” just like all revolutionary technologies to come before it.
At the time of publication the macroeconomic sentiment was not nearly as bearish as it is today. Now that the sentiment has shifted so greatly I thought it would be helpful to see if the adoption curves of other digital age technologies were slowed down by the 2008/9 recession.
The answer is no. Bad economic times do not stop the adoption of a technology whose time has come. This will be especially true for Bitcoin whose adoption requires no cost. Creating a Bitcoin wallet is absolutely free and a majority of the world already has a phone/computer with internet access with which to do so. No matter how poor the global economic situation gets there is zero cost to begin saving in Bitcoin. Buying Bitcoin is not the same as buying consumption goods whose demand will be negatively affected by a recession. Buying Bitcoin is just converting your monetary value from one form of money into the best form of money.
This bear market we have seen the network hash rate hit an all time high as well as some of the largest financial institutions in the world, including Blackrock and NASDAQ, get involved with Bitcoin. Bitcoin adoption has become price ignorant. Increased adoption divided by a limited supply of 21,000,000 can only result in one outcome in the long run.
Bitcoin Mining
Blockware + Riot Report
What happens after the block subsidy dwindles to zero? Is Bitcoin not secure? Post-block subsidy (after all 2,099,999,997,690,000 satoshis have been mined), your BTC will be as secure as it is today. The report covers this and the future of Bitcoin Transaction fees in detail, however, a quick summary is below.
Bitcoin Scaling Cycle
The Bitcoin Scaling Cycle illustrates how increasing adoption (settlement throughput) makes transaction fees rise, which incentivizes more scaling technologies to be developed and implemented.
This Scaling Cycle has repeated through multiple Bitcoin price cycles.
During periods of low fees the skeptics of Bitcoin have suggested the finality, or "security", of transactions is at risk of being undermined.
However, Bitcoin has reliably settled trillions of dollars worth of transactions monthly without needing any trusted third parties.
If Bitcoin goes from ~ 32M total entities to 8B+ total entities using Bitcoin as both a SoV and a MoE, then transaction throughput will need to increase by ~80,000x.
BTC will continue to be adopted due to its superior monetary properties and lack of uncertainty.
Mining is not about Bitcoin’s “security.” It is about settlement finality. Bitcoin’s security and consensus rules are defined by private key storage and nodes respectively, not miners.
The Bitcoin network's dynamic fee market makes it resilient against adversaries. If miners censor transactions, fees increase. If users are worried about settlement finality, they simply wait for more confirmations.
If your transaction does not confirm, you increase your fee.
Miners have the ability to only do one thing: propose blocks that nodes (who set the consensus rules) verify, accept, and use to update the ledger. Miners can only censor specific transactions they do not want to include in their own blocks. All attacks stem from censorship.
If an attack does occur, increasing transaction fees and waiting for more confirmations will be the natural market-based response that enables more confidence in transaction settlement.
If an attack does not occur, Bitcoin continues operating as normal.
In the long run, the market will naturally find an equilibrium for on-chain fees. It will reach a point where there is not much more demand for scaling technology and fees are high enough to avoid censorship after X blocks.
If you want to learn more about the future economics of Bitcoin settlement finality, read the full report produced by Riot Blockchain and Blockware Solutions.
https://blockwaresolutions.com/s/Bitcoin-Transaction-Fees-Final-Draft.pdf
All content is for informational purposes only. This Blockware Intelligence Newsletter is of general nature and does consider or address any individual circumstances and is not investment advice, nor should it be construed in any way as tax, accounting, legal, business, financial or regulatory advice. You should seek independent legal and financial advice, including advice as to tax consequences, before making any investment decision.


