


Blockware Intelligence Newsletter: Week 75
Bitcoin on-chain analysis, mining analysis, macro analysis; overview of 2/11/23-2/17/23


Blockware Intelligence Sponsors
If you are interested in sponsoring Blockware Intelligence email: sponsor@blockwaresolutions.com.
Foundation builds Bitcoin-centric tools that empower you to reclaim your digital sovereignty, starting with Passport, the new standard for Bitcoin hardware wallets. Passport combines best-in-class user experience with air-gapped security, and pairs perfectly with our companion mobile app, Envoy. Use code: BLOCKWARE for $10 off!
Blockware Solutions - Buy and host Bitcoin mining rigs.
Summary:
Despite the rate of increase for headline CPI declining, select categories show that inflation remains persistent in multiple major spending categories
Retail sales rose 3% in January
US credit card debt hit an all-time high in Q4 2022, according to the NY Fed
Fixed-income securities have sold off on the previously mentioned data, with risk assets appearing to be starting to catch up as of Friday morning
Short-term holder realized price is close to surpassing realized price, which has historically occurred at the end of bear markets.
Long-term holder supply remains incredibly sticky and long-term holders continue to accumulate. Spot buying and a diminishing amount of supply for sale is pushing the price up.
On-chain transaction count and the number of entities are increasing, showing that increased demand is slowly taking place.
Shorts were squeezed on the recent move up but not to the same degree as the price movement from the start of the year. $25,300 is a key level of short liquidity.
The funding rate for perpetual futures contracts is positive, however, there has been no significant build up in open interest. Thus, there is no concern for a mass liquidation of longs. Those that did ape into a long on the rally have already been liquidated.
$CLSK and $IREN both made large ASIC purchases this week capitalizing on incredibly cheap prices.
Energy Gravity sits at $0.13, indicating that most modern miners have positive operating cash flows, and significant upside still remains.
General Market Update
It’s certainly an interesting time to be in the markets as we received a few pieces of inflation data this week.
On Tuesday morning, data from the BLS showed that headline CPI rose by 6.4% YoY in the month of January. This number was lower than December’s 6.5%, but hotter than the 6.2% that was expected.
Food prices continued to see large YoY growth, but the rate of increase continued to fall in January. Energy prices saw an uptick in growth for January, coming in at 8.7% compared to 7.3% in December.
This left Core CPI at 5.6% YoY for January.
Despite the declining food and energy price growth, we did see increasing inflation (as a YoY %) across a few other categories.
Shelter costs are becoming a major concern here. In 2021, American households spent nearly 34% of their income on shelter.
As you can see above, shelter costs have been rising swiftly. In January, this component grew by 7.9% YoY, its largest increase since June 1982.
As interest rates rise, we tend to see a corresponding increase to rent expenses as property owners pass on increased costs to their tenants. Furthermore, CPI’s shelter component treats all residential properties as rentals, regardless of whether they’re actually rented out or not.
With shelter accounting for a major percentage of most consumer’s spending, the chart above shows that inflationary pressures are very much still relevant.
Service costs also make up a large portion of consumer spending. The chart above shows the YoY growth to the services (excluding energy services) component of CPI.
The services component takes into account the cost of medical service, internet service, car service, etc. As you can see, this component rose 7.2% from January 2022.
The combined effect of rising service and shelter costs likely had a large effect on the retail sales number we got on Wednesday.
According to the US Census Bureau’s advanced estimate, retail sales grew by 3% in January. This was up from the -1.1% growth in December, and well above estimates of 1.8%.
The chart above shows the MoM change to retail sales, the shaded regions indicate US recessions. As you can see, recessionary periods are usually accompanied by a slowdown in sales.
This makes sense because if consumers are buying less, or retailers are selling less, we generally see a decline in the output of the economy. For January, retail sales are estimated to be at their highest level since March 2021.
Ignoring the 2020’s, consumers are now spending the most since October 2001.
Every category considered to measure retail sales grew in January, with food service (restaurant) spending growing the most at 7.2%. This was its largest month of growth since 2021’s re-opening following the pandemic.
All in all, the two major economic data releases this week show two things:
Inflation remains a major threat based on a few major spending categories
Consumers are spending more than most expected
These two factors draw the same conclusion, the Fed will likely be forced to raise rates higher than previously expected.
Furthermore, the Household Debt and Credit Report released Thursday from the New York Fed shows that debt levels were still growing in Q4, despite higher interest rates.

Credit card debt reached an all-time high of $986 billion. We did see an uptick in delinquencies (payments >30 days past due), but they remain below pre-pandemic levels.
The Producer Price Index data for January was also released on Thursday. PPI it came in at 6.0% YoY, which was down from 6.2% in December but hotter than consensus estimates of 5.4%.
This shows us that once again, despite headline numbers falling from last month, inflation is stickier than most expected.
As debt levels rise while in a restrictive financial environment, and inflation remains stubbornly high, we see yet another reason why the Fed will likely be forced to raise rates for longer.
The bond market would agree with this conclusion, as yields continue to rise across the curve this week.
If costs are rising and consumer demand is robust, it clearly creates an incentive for the Fed to raise rates even higher in order to effectively restore “price stability”. If the market is expecting rates to be higher in the future, that means that bond prices will fall and thus, yields will rise.
This is also creating demand for the dollar as investors across the world seek historically high yield from US Treasuries.
As of Thursday’s close, the 2-year’s yield is up 0.125%, the 10-year yield is up 0.123%, and DXY is up nearly 0.5% on the week.
Higher yields and relative USD value tends to place downward pressure on risk assets like stocks and cryptoassets for several reasons. Most simply put, rising yields mean that investors can earn higher returns for less risk than owning stocks.
Nasdaq Composite Index, 1D (Tradingview)

Following last week’s pullback to below the 10-day EMA, the Nasdaq showed some serious strength when it bounced higher earlier in the week.
That being said, Wednesday’s upside reversal came on light volume. When combined with the yield dynamics previously discussed, it could indicate significant downside risk for the equity indexes.
Furthemore, the Nasdaq had a very weak close on Thursday, erasing all progress made towards closing the gap and closing down -1.78% on the day.
At the moment, fixed-income investors appear concerned about higher future rates. Risk asset price action appeared to be shrugging these concerns off, instead betting on a soft-landing (or a no-landing) to come for the US economy.
Thursday’s close could be an indication that risk assets are going to follow fixed-income’s lead, but much is left to be seen.
That all being said, investors seem pretty confused here. Certain economic data points are pointing us in different directions, and people seem to be waiting for Fed officials to point us in the next direction.
As discussed in this newsletter last week, downside risk is likely at its highest of 2023 here. With Fed officials stating that they supported 50bps in February, investors would be wise to stay vigilant.
Also note that today (2/17) is options expiration which will likely inject volatility.
Crypto-Exposed Equities
It’s been another crazy week of price action among crypto-exposed equities with Bitcoin up over 9% on the week as of Friday morning.
Both Iris Energy (IREN) and Cleanspark (CLSK) announced that they are increasing their mining capacity in 2023. IREN announced that they’re nearly tripling their hashrate, leading to their stock price jumping nearly 136% this week (as of Thursday’s close).
For more discussion of these two companies, and the announcements they made this week, be sure to check out the mining section of this newsletter.
SDIG also had a strong week as they provided an update on their capital restructuring.
Beyond that, keep an eye on BTC price performance here to determine the next move for these stocks. If BTC can maintain these levels, and then head higher, we could see some crazy price action from these names.

Above, as always, is the excel sheet comparing the Monday-Thursday price action of several crypto-equities.
Bitcoin Technical Analysis
Following the short-term weakness shown last week, it’s been a very strong week of price action for Bitcoin.
Bitcoin/US Dollar, 1D (Tradingview)

Despite putting in a large downside reversal candle on Thursday, BTC remains above $24,000 at the time of writing. This is very impressive given the dynamics discussed in the “General Market Update” section above.
Last week we noted that we’d like to see buyers step in around $21,500. This is almost exactly what we saw with BTC bouncing at $21,355 this week.
Bitcoin then ran into sellers after breaking above $25,000 for the first time since August 15th, 2022. This is likely going to be a tough level to crack through sustainably.
Big whole numbers like $25,000, $50,000, $100,000, etc. are what we in the business refer to as Livermore Levels. These are psychologically attractive areas for sellers to get out, or buyers to step in.
Furthermore, $25,000 became a major support and resistance level in 2022, as shown on the chart above. The larger the previous support/resistance, the harder it will be to break through it.
Our team finds the most likely short-term scenario to be a choppy sideways consolidation between $21,500 and $25,000. This would allow BTC to consolidate the gains made over the last 1.5 months and eliminate the frothiness of largely bullish sentiment.
That being said, we wouldn’t rule out other scenarios, and hodlers should keep a close eye on price action in this type of environment.
Bitcoin Onchain and Derivatives
This week’s rally has (almost) put us in a place where we can definitely call the bottom based on on-chain data.
Short-term holder realized price is about to pass realized price, which every time this has previously occurred turned out to be a bottom signal. A signal that tends to occur at bear market bottoms is price falling below realized price (grey indicator) and then regaining it (yellow indicator); this has already happened.

As regular readers of this newsletter know, the common denominator among bear markets is long term holders serving as buyers/HODLers of last resort. As these entities, who are convicted in the long-term value proposition of BTC, accumulate an increasing percentage of the absolutely scarce supply, and are unwilling to sell, eventually, sellers run dry and the price has nowhere to go but up.
Despite BTC being up 45% year-to-date, long-term holders have yet to begin selling coins. In fact, they are still in a regime of net-positive accumulation. Given the fact the LTHs still are not selling, the condition of the market from a supply/demand perspective is still favorable to the price having to go up. Until we see some of this supply begin to leave the hands of LTHs it is not unreasonable to expect the price to continue to increase in the short to medium term.


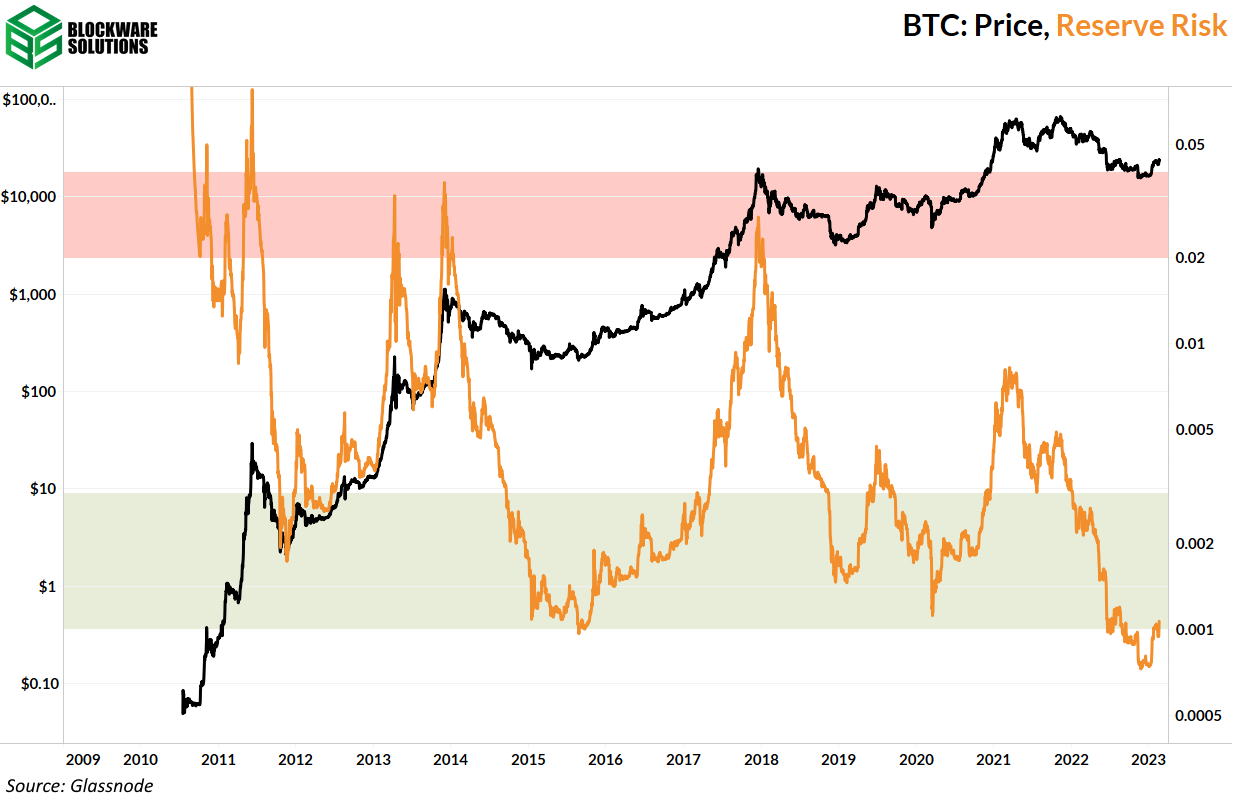
Reserve risk quantifies this idea. Low values of reserve risk indicate a “low risk” bottom, as in, the price is down from the all-time high as well as a large % of the supply is held by LTHs.
As you can see, despite the price increase, because the supply held by LTHs remains sticky, we are still in a zone of historically low risk/high opportunity, as indicated by reserve risk.
Given the fact that supply is being HODLed by LTHs, and we have no reason to believe this will change under current market conditions, looking at demand indicators should provide decent signal for short-term price action.
New entity momentum has been our go-to for measuring demand recently. Momentum continues to increase as the 30-day moving average of new entities is soaring past the 365-day moving average.

Transaction count momentum is positive too as the 30-day moving average has begun taking off. Part of the increased transaction count can be attributed to the rise in ordinals/inscriptions, but that cannot be driving all of it.
Demand is beginning to creep back into the market and this will only become more so as time goes on, and the likelihood of BTC returning to what may have been the bottom diminishes.
Now let’s discuss derivatives.
The rally this week did result in short liquidations, but the number of liquidations pales in comparison to the previous rally from the start of the year.
Minimal short liquidations means this rally is driven by spot buyers, not forced buyers, and diminishing marginal sellers.

A really nasty short squeeze would likely begin if/when the price hits $25,300. Notice the massive wall of shorts at that price. A squeeze would likely push the price up to resistance at $28,000, the point where there is a break in liquidity.

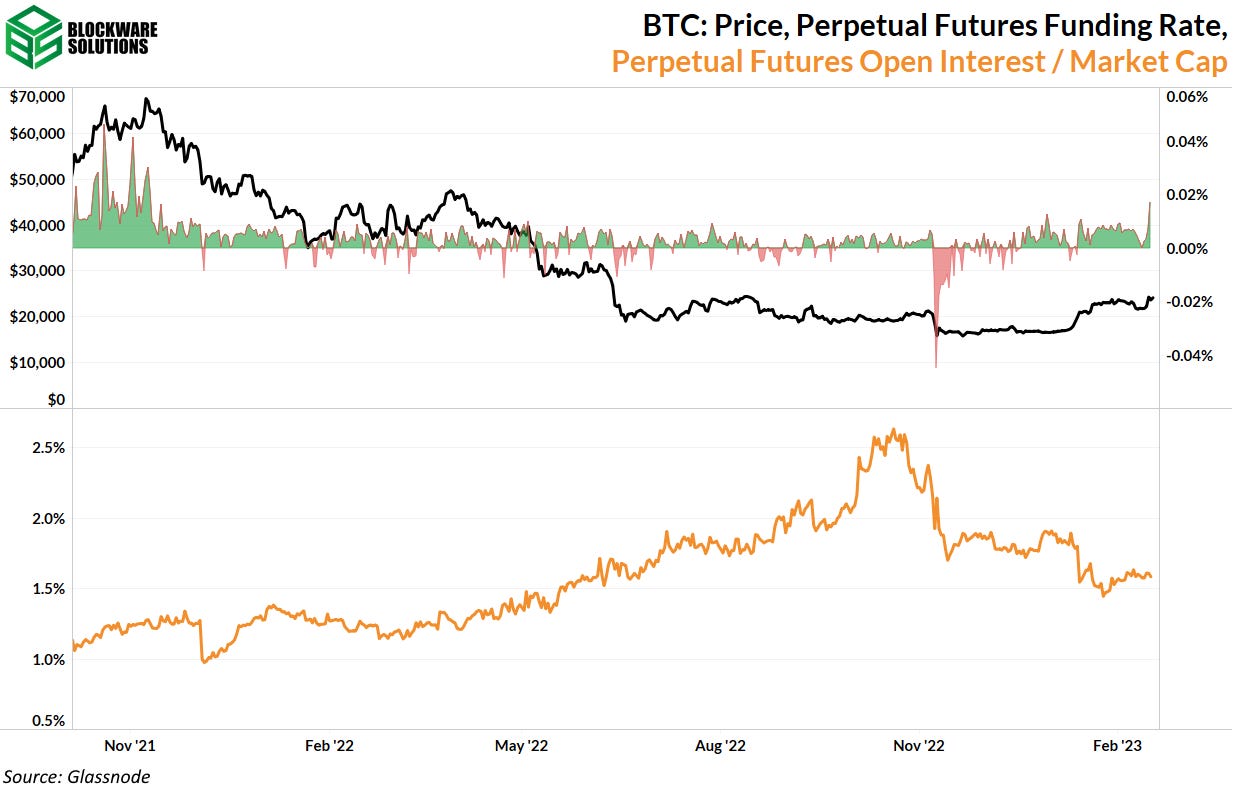
The funding rate for perpetual futures contracts did hit its highest rate of positive funding since November 2021, when Bitcoin was hitting a new all-time high.
However, we don’t need to be concerned about an excess of longs quite yet as open interest relative to market cap remains relatively flat.
Those that did ape into long positions on the rally have already been liquidated. This chart is zoomed in and has an hourly view. The drop from the local high at $25k back to just under $24k liquidated newly placed longs.

Bitcoin Mining
CleanSpark ($CLSK) purchases 20,000 S19j Pro+s
One of the most successful Bitcoin mining companies during the 2022 bear market was CleanSpark. Unlike many other large mining companies, CleanSpark took a more conservative approach during the bull market and decided to sell most of the BTC mined. This enabled them to make multiple purchases and acquisitions over the past few months at highly distressed prices.
As of yesterday, CleanSpark purchased 20,000 S19j Pro+s, Bitmain’s latest model. Next week the Blockware Intelligence Podcast will host Matthew Schultz, Co-Founder of CleanSpark, to discuss this purchase in more detail.
Iris Energy ($IREN) purchases 44,000 S19j Pros
Iris Energy is another miner expanding its operations. On Monday, February 13th, the Australian-based Bitcoin mining company announced it plans to triple its currency hashrate by purchasing an additional 4.4 EH/s worth of S19j Pros.
Learn more about how Iris Energy survived the bear market and is now thriving by listening to our podcast with Daniel Roberts, Co-CEO of Iris Energy.
BTC Price can soar overnight, difficulty can’t
As mentioned in our 2023 Market Forecast, due to ASICs commoditizing and the size of the total global hashrate, the growth rate of mining difficulty will likely continue to slow. Mining difficulty will still increase as you can see above that miners are constantly deploying more hashrate, but the growth rate will likely not be able to maintain double-digit MoM growth.
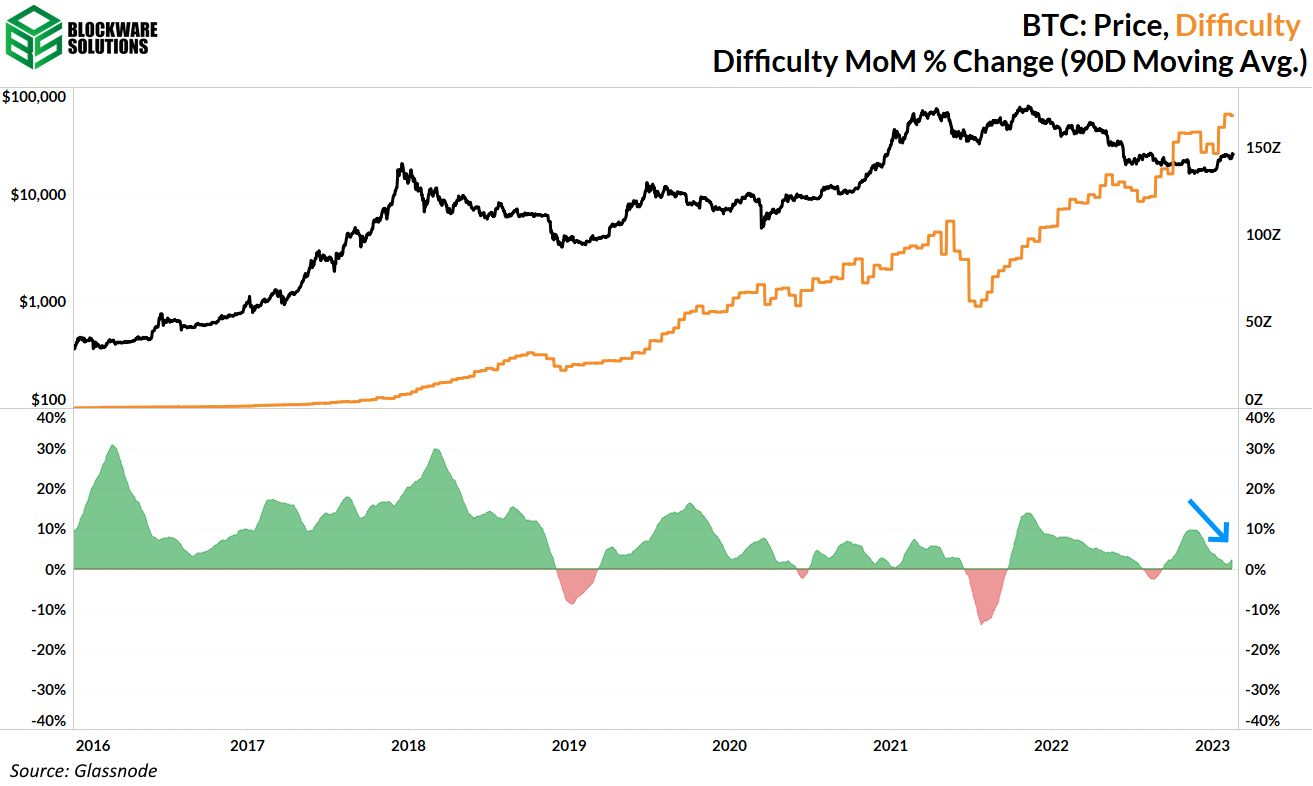
A great example of this is the most recent increase in price. On Wednesday the price of Bitcoin was up 7%.
An equivalent increase in mining difficulty cannot happen nearly as quickly. A 7% jump in hashrate would require another 20 EH/s to come online. This would be plugging in ~192,000 S19j pros in one day. These machines would consume 658 MW of energy, which conservatively would power 329,000 homes.
For comparison, it will likely take multiple quarters for Iris Energy and CleanSpark to ship, receive, and deploy all of those 64,000 mining rigs.
In short, physical energy and infrastructure constraints will limit the growth of mining difficulty even during a massive bull run for the price of BTC. When this occurs, incumbent miners will be profiting off the difference between the price of BTC and its cost of production.
If you’re interested in deploying capital directly into the Bitcoin mining industry, consider buying and hosting mining rigs with Blockware Solutions.
Energy Gravity
The following chart is based on a previous Blockware Intelligence Report that models the relationship between Bitcoin's price and its production cost. The model makes it easy to visualize when the price of Bitcoin is overheated or bottoming.

All content is for informational purposes only. This Blockware Intelligence Newsletter is of general nature and does consider or address any individual circumstances and is not investment advice, nor should it be construed in any way as tax, accounting, legal, business, financial or regulatory advice. You should seek independent legal and financial advice, including advice as to tax consequences, before making any investment decision.
where is the charts man? in the beginning you wrote "the chart above", while there is no chart "above"!