Blockware Intelligence Newsletter: Week 58
Bitcoin on-chain analysis, mining analysis, macro analysis; overview of 10/1/22-10/7/22
Blockware Intelligence Sponsors
If you are interested in sponsoring Blockware Intelligence email: sponsor@blockwaresolutions.com.
Blockware Solutions - Buy and host Bitcoin mining rigs to passively earn BTC by adding blocks to the blockchain. Your mining rigs, your keys, your Bitcoin.
Have fun and learn more about our Bitcoin future at Pacific Bitcoin, the largest Bitcoin conference on the West Coast. Nov 10-11 in Los Angeles. Get 30% OFF tickets with code BLOCK.
Located in Europe or want to take a trip? Go to the Bitcoin Amsterdam conference Oct 12-14. Use code: BLOCKWARE for 10% off.
Summary
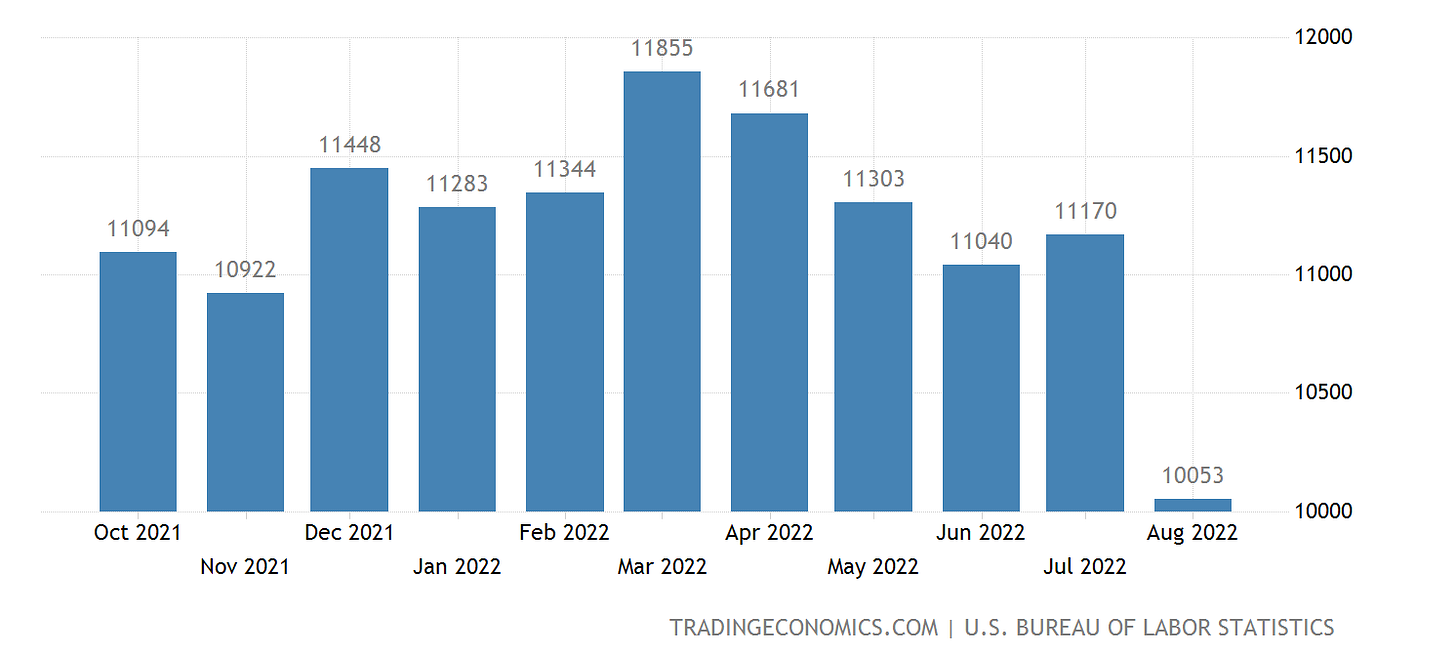
US Job Openings declined by 1.1M in the month of August, signaling a softening job market that hasn’t yet affected unemployment.
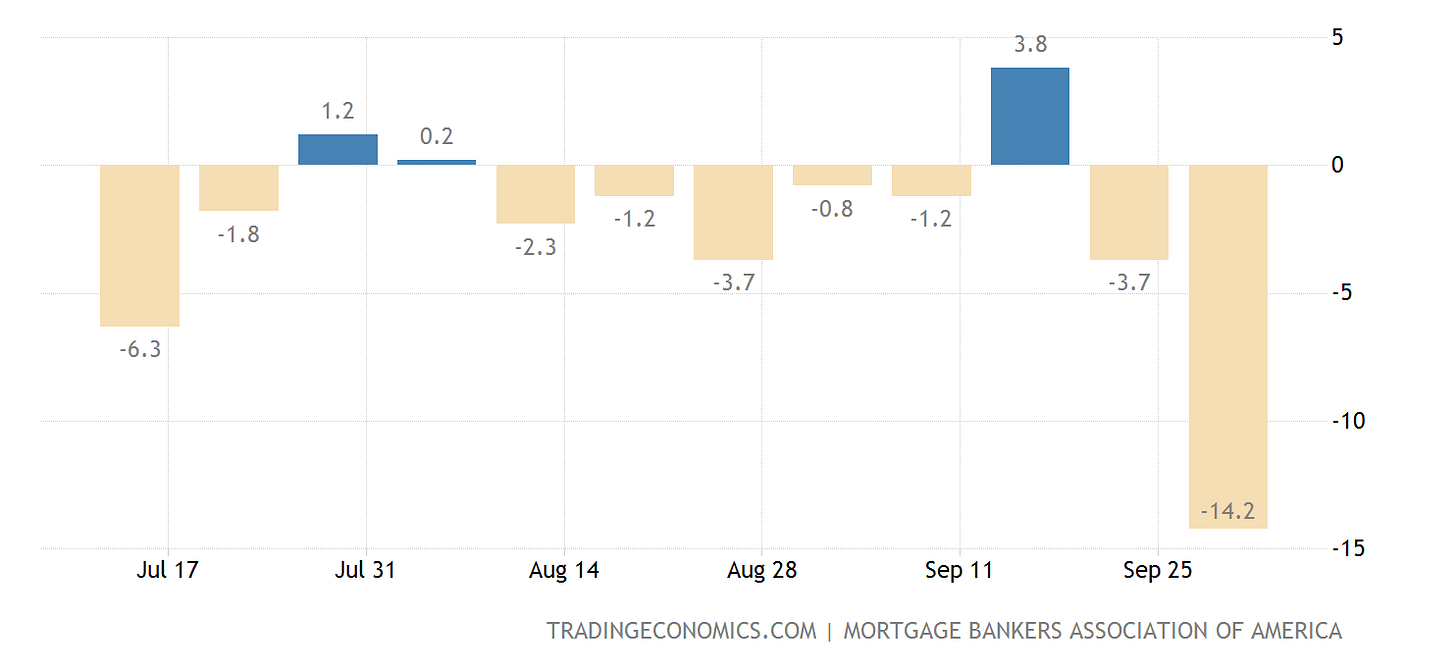
Last week saw a 14% decline in mortgage applications, which is the seasonally-adjusted lowest level of demand for mortgages in the 21st century.
The equity market has seen a bounce this week, but Treasuries and the US Dollar is signaling that this is more likely to be a countertrend rally than a true bottom.
Spot bitcoin price has also seen a bounce this week, but nothing significant enough to fundamentally change current price structure.
On-chain fundamentals still show Bitcoin is incredibly cheap despite the slight bounce this week.
Bitcoin Volatility Index has been relatively low signaling that we could be due for a big move soon
Long term holder supply has remained incredibly inactive; a behavior that aligns with bear market expectations.
Positive perpetual futures funding rate and an all-time high in perpetual futures volume relative to market cap signals that traders are anxiously awaiting a price rip.
Bitcoin Mining in Kenya is Reducing Consumer Energy Costs by up to 90%.
Bitcoin’s network hash rate is soaring.
Will Bitcoin see another miner capitulation wave during Q4 2022?
General Market Update
It’s been another interesting week across the financial markets, with lots to discuss here today.
One of the more interesting stories this week came from Switzerland with their country’s 2nd largest bank, Credit Suisse (CS), under serious pressure. With the equity and treasury markets bleeding market cap, higher leveraged banks are feeling the pressure of decreased NAV.
As a result, CS Credit Default Swaps are seeing extreme demand. To put it simply, a CDS is a security that pays the investor if the underlying party defaults on their debt (misses a debt payment).
This means that the market is pricing in an increasing default risk into CS issued bonds, and their publicly traded stock. Yields on CS bonds are up over 10% in the last year and their stock price is down over 24% in the last month.
A lot of folks are drawing comparisons to 2008’s Lehman Brother’s meltdown. While the market does appear to think there is a fairly significant chance of default that would require a bailout, this would almost certainly not play out in 2022, and likely not in 2023 either.
This headline, while significant and interesting, appeared to stir more FUD than risk to the international financial system.
In the job market, we saw some data this week to show that US job openings fell by 1.1M in August, the largest decline since April 2020.
US Job Openings 1Y and 5Y (TradingEconomics/BLS)
In the month of August, the number of quits and layoffs both remained relatively flat, showing that despite the fact that open positions should be generated, companies are not looking to rehire for those positions at this time.
Furthermore, it illustrates the fact that we’re seeing a hiring freeze affecting numerous sectors of the economy. This data comes alongside the announcement of a corporate hiring freeze from Amazon.
Pausing the hiring of new employees is always step 1 before laying off existing employees.
Initial Jobless Claims (FRED)
Looking at Initial Jobless Claims, or the number of Americans filing for unemployment benefits following job loss, we can see that initial weakness in the job market hasn’t caused major upticks in unemployment, yet.
September Manufacturing PMI (ISM)
This week we saw the release of September’s Manufacturing PMI report from the Institute for Supply Management.
The composite reading came in at 50.9%, meaning that sentiment among purchasing managers at manufacturing firms has now fallen to levels not seen since the midst of the COVID pandemic in Q2 2020.
This decline in sentiment likely stems from the decline in aggregated consumer demand for products. According to a report from CNBC, ocean freight shippers have seen a 20% decline in demand for their service in the months of September into October.
This combination of a softening job market, and declining PMI and demand helps support the thesis that the United States is likely not too far from entering a recession.
But as this newsletter often mentions, the classification of “are we in a recession or not” is arbitrary. The effects of a recession have already hit the financial markets to an extent, as we’ll examine below.
On the housing front, things continue to slide towards the worst environment for real estate since the ‘08 housing crisis.
Mortgage Applications (TradingEconomics/MBA)
Last week, applications for mortgages declined by 14.2% according to the Mortgage Bankers Association.
On a seasonally adjusted basis, total volume of mortgage applications is at its lowest level since 1997. This shouldn’t be too much of a surprise with 30-year fixed rates at their highest levels in 14 years with home prices still hovering around all-time highs.
Despite all the poor data this newsletter has just highlighted, we’ve seen a relatively strong week in the equity market. As we’ve discussed in this newsletter for the last 2 weeks, the market has been due for some degree of a bounce.
NASDAQ Composite 1D (Tradingview)
While the major indexes continuing lower is still more likely than not, countertrend rallies tend to come once the index reaches a high level of extension below key moving averages in a bear market.
At last Friday’s close, the Nasdaq sat -6.7% below its 21-day EMA. This large margin between price and a short-medium term moving average indicated that the selling was likely near exhaustion.
The more extended price is below a key moving average, the more difficult it becomes to push prices even lower. In these periods, you’ll tend to see shorts interested in taking profits and thus, a countertrend rally ensues.
Thus far, the rally has been on declining volume, meaning that we likely aren’t seeing institutional investors build large positions here and instead, we’re seeing short covering and smaller positioned long traders step in.
This is the reason why, as of Thursday, it would appear that this isn’t the bottom and more likely to be a short rally before continuing lower. That being said, things change very quickly in the markets and anything is possible.
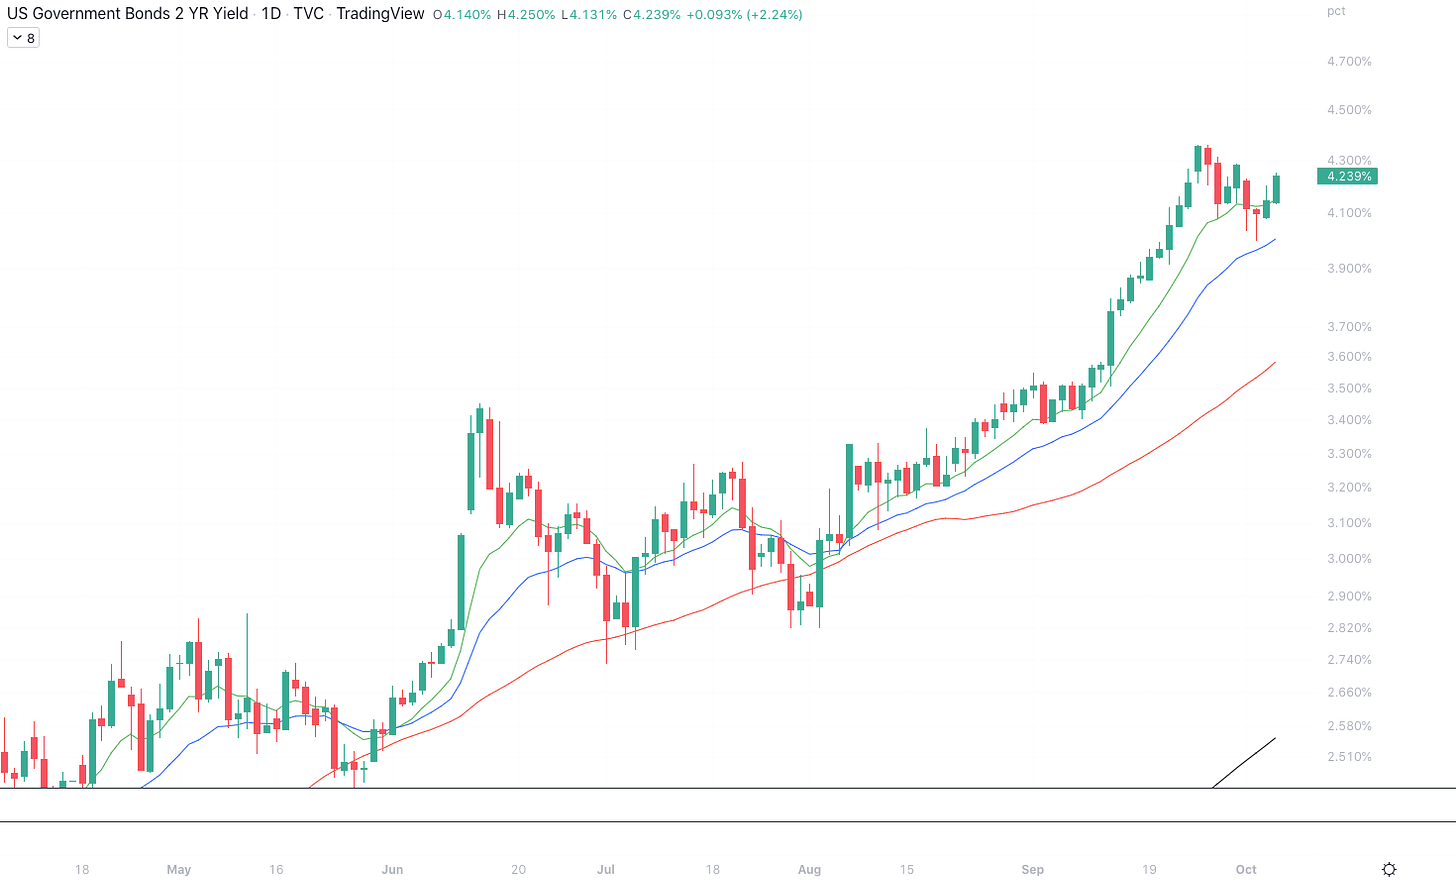
2Y Treasury Yield 1D (Tradingview)
Furthermore, we’ve seen Treasury yields bounce back higher this week after a short rally in the bond market last week ran into sellers around 4.0% yield. At the moment, there is a discrepancy between the price action of bonds and stocks.
Generally speaking, we’ve seen the bond market lead the stock market in 2022. If this is to continue to hold true, we would likely see a reversal towards lower prices in the major equity indexes.
This bounce in Treasury yields is likely to be the result of the bounce we’re seeing in the US Dollar Currency Index (DXY).
DXY 1D (Tradingview)
Last week, on news of weakening economic conditions on the European continent, we saw the Bank of England pivot their monetary policy back towards an inflationary regime, as discussed in this newsletter.
With that pivot, we saw both the pound and the euro moving increasingly stronger against the dollar. This week, things have begun to reverse yet again, ushering in another rally for the US Dollar.
As mentioned numerous times in this newsletter, a rising DXY generates sell pressure on both fixed-income and equity securities.
Crypto-Exposed Equities
Alongside the bounce we’ve seen in both the equity indexes and Bitcoin, it’s been a fairly strong week of price action for the crypto-exposed basket of stocks.
Per usual, there are varying degrees of strength being shown between these names. Stronger names have been able to retake key moving averages, with the strongest retaking their 50-day SMAs.
A few of the names that have stood out this week have been: MARA, WULF, CAN, and COIN.
WULF 1D (Tradingview)
TeraWulf has been one name in particular that has had a very strong last couple of weeks. First and foremost, it should be noted that WULF is a small market cap, illiquid, penny stock.
That being said, it's very easy for whales to move the price of illiquid stocks, so there are clearly some large players building positions down here. This is not, by any means, an advertisement to buy shares of WULF.
Instead, by comparing the chart of WULF to others in the group, it provides investors with a clear example of relative strength. We are always looking for names that are outperforming companies in the same industry group.
Above, as always is the sheet comparing the weekly price performance of several crypto-equities to that of BTC and WGMI.
Bitcoin Technical Analysis
Bitcoin has also received a decent bounce this week.
BTCUSD 1D (Tradingview)
In my opinion, the biggest testament to the strength of BTC over equities recently has been the fact that, so far, BTC hasn’t undercut its June lows.
At the time of writing, BTC has run into a bit of resistance around its Volume Weighted Average Price anchored from its June lows. This isn’t unsurprising, $20,310 is the price that the average participant has paid for 1 Bitcoin since bottoming on June 18th.
BTC has spent a significant amount of time below this price in the last month, therefore it is logical for investors to want to get out of some of their position at breakeven. So far, this selling has been fairly minor, but it is of note.
For Bitcoin to cross above this $20,300-400 range would likely provide bullish confirmation of a fairly significant rally underway. On the flip side, $18,900 is the spot for bulls to defend in the very near-term.
Bitcoin On-chain and Derivatives
Despite the mild upward price action of the past few days, BTC is still below its realized price of $21.3k.
Including the 30 day span from mid-July to mid-August in which BTC traded above the realized price, it has now been 115 days since it initially dropped below back in June. For reference, during the 2015 and 2018 bear markets, BTC was below realized price for 310 and 134 days respectively.
Stacking sats in this range has led to great returns historically.
Valuation metrics are still showing that BTC is EXTREMELY cheap right now.
LTH/STH Realized Price, Puell Multiple, MVRV Z-Score, and Market Cap to Thermocap Ratio are all at levels previously reached during bear market bottoms.
Don’t be lulled to sleep by the sideways price action of the past few months. BTC is in a range of incredible value right now and it won’t remain that way forever.
This chart, which we have discussed previously, shows the supply of BTC held by entities with .01 to 1 BTC; plebs for lack of a better term. Also shown is the 90 day change in this metric.
The plebs bought the initial dip to $20k with tremendous aggression. This mania of pleb accumulation has cooled off recently. Plebs are still still stacking, don’t get it twisted, but they are doing so with much less intensity.
Speculating on the reason for this cool off: the market is getting bored of this price range. Initially there was a euphoric “buy the dip” moment. That moment has passed and this extended dull period makes me believe BTC is due for a big move; up or down is to be determined.
The Bitcoin Volatility Index is in a relatively low state at the moment. This further confirms the idea that we are due for a big move. Of course anybody can predict a volatile price move from Bitcoin; it’s the nature of the beast. But the volatility index appearing to be coiled up for a move is on-chain evidence to support this claim.
Liveliness, a ratio of the sum of Coin Days Destroyed and the sum of all coin days created, has been on a downtrend. More coin days are being created vs destroyed. The accumulation and holding is intensifying: classic bear market behavior.
The gaps in the orange binary metric indicate when liveliness is below its 30D Moving Average. Liveliness is showing accumulation from Bitcoiners for the past couple months. Again, an important theme of bear markets is accumulation by long term holders. Any metric that shows this pattern of behavior is helpful for understanding that price drawdowns of this magnitude are normal for Bitcoin. Veteran Bitcioners are unfazed.
Revived Supply Last Active 1+ Year(s) ago, on a 90 day moving average, has reached very low levels. This means that old coins are not re-entering the market, they are being hodled. Long term holders do not willingly sell the bottom.
Lightning network continues to grow and that is incredibly bullish. The lightning network destroys any claim that Bitcoin is too slow to be used as a medium-of-exchange. Bitcoin scaling as a viable, day-to-day, medium-of-exchange will incentivize more individuals, businesses, and nation-states to adopt it.
It is very encouraging to watch this layer 2 scale during a bear market. This is more proof that Bitcoin's core user base is religiously convicted; combine that with a limited supply of 21,000,000 and the long term path is obvious.
The funding rate of perpetual futures contracts has been increasingly positive throughout the week.
Reminder: a positive funding rate does not mean that there are more longs than shorts. It is a balancing mechanism to encourage people to take the less desirable side of the bet. The positive funding rate indicates that the futures market is bullish about this week's slight rally and eager to capitalize on it.
Last week we observed the Futures Open Interest Perpetual Volume adjusted for Market Cap and its upward climb throughout the bear market. It has shot up again this week; such an increase in leverage could be the reason for this ant-sized rally. Moreover, this aligns with my thesis that the market is bored of the $20k range and is attempting to create some action.
Bitcoin Mining
Bitcoin Mining in Kenya is Reducing Consumer Energy Costs by up to 90%
Gridless Compute is monetizing small hydro plants (~100 kW) that power small villages in Kenya by mining Bitcoin. Many of these micro power plants produce the amount of power that they expect the village will need in 5-10 years (significantly more than what the village consumes today).
The villagers effectively end up paying for ~ 100 kW, but only use ~ 10 kW. Gridless Compute plugs in miners to offtake excess power which will reduce the power prices individual villages pay by up to 90%, according to Nick H., CEO of Luxor, who posted a short Twitter thread and video of one of the micro power plants in Kenya.
By scaling this idea globally, you can start to visualize how Bitcoin mining will transform power markets. All power producers are forced to overproduce energy 24/7/365. Otherwise, your lights would occasionally not turn on, your internet would go out, and your AC/heating system would not function. The cost of this overproduction inevitably gets added to the electricity rates you pay as a commercial or retail consumer of electricity. Bitcoin mining can come in to be a location and time-independent energy buyer of last resort by consuming all of the excess wasted electricity.
This effectively will not only reduce energy costs in Kenya but all over the world. Additionally, Bitcoin mining as a location and time-independent energy buyer of last resort ensures power producers that they will always have a buyer for the energy they produce. They only have to find a Bitcoin miner to partner with and offer a low enough price per kWh.
Hash Rate Soaring
In the depths of this bear market, hash rate continues to shock many as the next projected difficulty adjustment is expected to be significantly higher. This strong growth in hash rate can be attributed to three key reasons.
New generation machines coming online (S19XPs and M50S)
Less power curtailment compared to this summer
Inefficient miners selling their rigs and getting them plugged back in by a more efficient miner (from miner capitulation this summer)
Will Bitcoin see another Miner Capitulation?
Many reporters and market participants have been reaching out asking if we are on the cusp of another miner capitulation. It is an interesting question, as the price of BTC has only trended down this year while hash rate and difficulty are making new all-time highs. Clearly, miners’ margins are getting squeezed.
Bitcoin did experience and complete a small miner capitulation this summer, as network hash rate dropped significantly in a relatively short period of time. However, it is questionable whether we will see another miner capitulation soon. If the macro environment deteriorates further, it would be reasonable to expect the price of BTC to make new lows and the weak remaining miners to be purged yet again causing another miner capitulation. If Bitcoin hovers around $20k for the rest of 2022, we may see the weakest miners slowly drop off the network as more and more new-gen rigs get plugged in, but it is still likely that hash rate will trend up.
All content is for informational purposes only. This Blockware Intelligence Newsletter is of general nature and does consider or address any individual circumstances and is not investment advice, nor should it be construed in any way as tax, accounting, legal, business, financial or regulatory advice. You should seek independent legal and financial advice, including advice as to tax consequences, before making any investment decision.


