Hope all is well. For those who celebrate Thanksgiving, we hope you and your families had a good holiday; and for those who don’t, we still hope you had a great week!
Our Indicator Dashboard V1 is now live!
The V1 Blockware Intelligence Indicator Dashboard is now live! Be sure to check it out here: intelligence.blockwaresolutions.com
This is a work in progress and we want as much feedback from the community as possible. Let us know what you think and what features you’d like to see added!
On-chain: (written by Will Clemente)
Short term bear case:
This recent covid variant news is not ideal for the markets; both crypto and legacy. Narratives aside, for Bitcoin the short-term bearish case lies in derivatives data. We are currently seeing open interest as a percentage of market cap unphased by this recent drawdown. In addition to this funding seems relatively unphased as well as the limited amount of long liquidations that we’ve seen. Would not be surprised to see some kind of final liquidation-driven wick down.
Short term bull case:
First of all, we are very close to retesting the bull market support band of which we’ve talked about over the last few weeks here in the newsletter as well as on Twitter. This is the short-term holder cost basis, realized price, or volume-weighted average price (VWAP) for technical analysts. Currently sits at $53K. As mentioned above, wouldn’t be surprised to see a liquidation-driven wick, but do not want to start seeing daily closes* (more than one) below the band.
Entity-adjusted SOPR (spent output profit ratio) has had a bounce off the 1 threshold which means market participants are not willing to start selling their BTC at a loss, at least for now. We’ve been talking about a potential retest for the last month or so; now just want to see it hold. In bull markets, you want to buy the retests of 1 as support, in bear markets you want to sell the underside retests of 1 as resistance. 1 = neutral state of profit in the market; when the profit and losses being realized balance each other out.
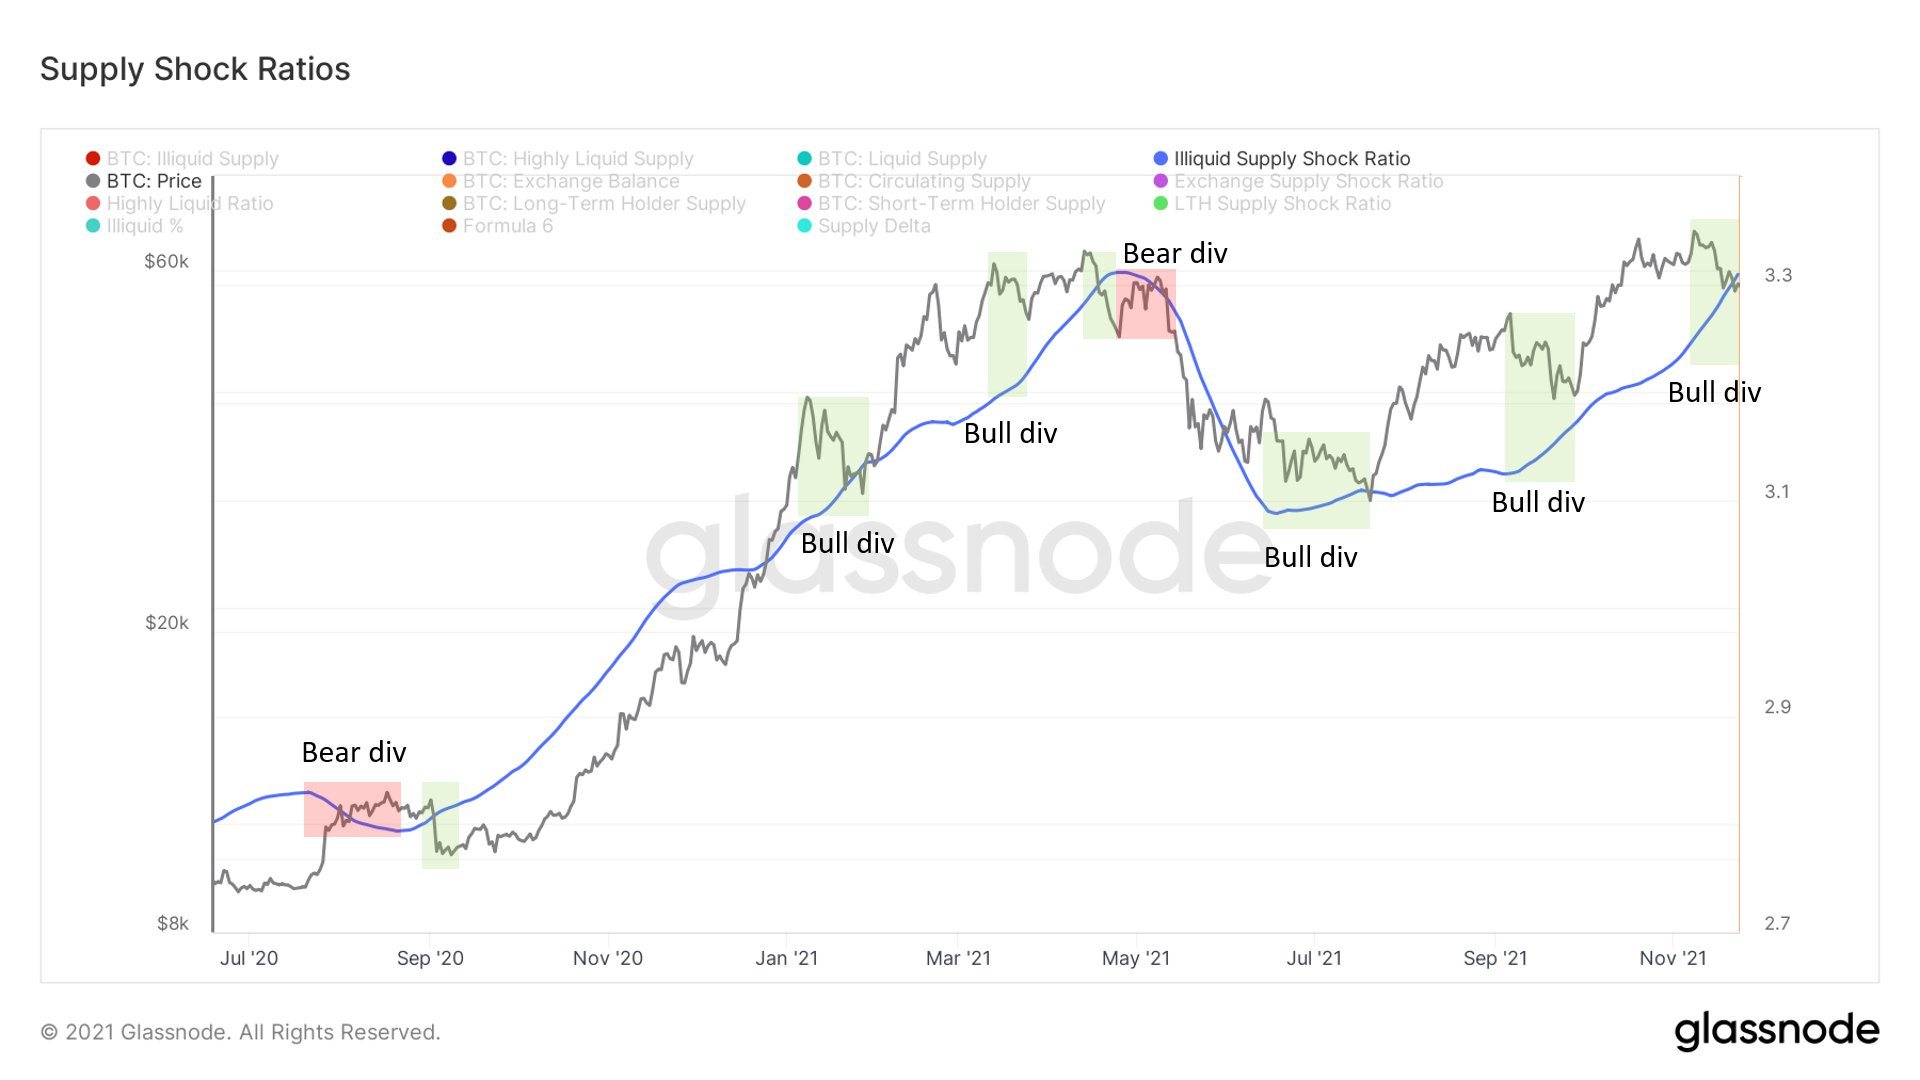
From an intermediate-term standpoint, there’s a clear bullish divergence between illiquid supply shock ratio and price right now. Illiquid supply shock compares liquid entities (sell 50% of the BTC they take in) and highly liquid entities (sell 75% of the coins they take in) to illiquid entities (hold 75% of the coins they take in). This means supply is moving to entities with little history of selling. If this does start to decline I will become bearish, but for now, it is continuing a steady incline. This is not the first time we’ve seen such a divergence; we’ve had one as recent as the end of September.
Broader on-chain metrics that follow the “macro” cyclical behavior are all still far from overheated. To see any of those metrics, see this thread I put out with 22 of them to watch out for.
In conclusion, if we are indeed in a bull market, the asymmetry is very skewed to the upside right now. Invalidation would be starting to close below $53K for several days, seeing SOPR breaking below and failing to retake 1 from the underside, as well as starting to see illiquid supply shock rolling over.
Equities: (written by Blake Davis)
This week we’re seeing, potentially, the start of a general market correction. It is hard to see this by solely looking at the indexes, but early in the week, many tech names failed to find a buyer at key support levels and moving averages.
Nasdaq Price and Advance/Decline Line (Marketsmith)
The advance/decline (A/D) line is my favorite market breadth indicator, it shows us the number of stocks that were up, or down, on the day.
Remember, the Nasdaq is heavily weighted towards a handful of stocks such as AAPL, MSFT and AMZN, so the Nasdaq’s price action isn’t a great indication of what the majority of the market is doing. The A/D line is equally weighted among all 100 stocks in the index so when the Nasdaq A/D line is declining, we know that Nasdaq stocks are in a net decline.
Last week, the Nasdaq flashed warning signals when price advanced with breadth declining. On the chart above, I’ve used a red trend line to show the slopes of both the Nasdaq and the A/D line.
When the market advances with the A/D line declining, this tells us that price is trending higher despite less and less stocks participating in the rally. This means the index is likely only climbing due to those few highly weighted stocks.
A strong market would have the majority of names participating. When most stocks are in a decline, it is much more likely that the few names propping up the market will run into supply too.
To me, a lot of names look very oversold. If this is just a shorter pullback to retest levels, it’s my opinion that it is likely nearing its end. But in a market with the short-term trend unclear, I personally prefer the safety given by holding at least some cash.
What does this mean for crypto-exposed equities?
Now that we’ve identified that the general market is in a state of flux, coupled with similar price action in Bitcoin, this tells me to proceed with extreme caution when buying crypto-stocks. As of the close on Wednesday, my personal account is roughly 50% cash.
At the end of the day, an investor is a risk manager. I hold stocks when the trend is clear and the market provides me with low risk opportunities to buy. When the trend is unclear, risk is higher, so I like to step back and solely be an observer of price action. Unless you have the coveted magic crystal ball, we don’t know when the market will bottom.
I hold cash to defend my account, if I’m wrong I can easily buy the stocks back. I am not, by any means, arguing that the bull cycle for crypto-exposed stocks is coming to an end. But trying to buy bottoms is a risk-on strategy that can work, but usually doesn't.
Until you have extreme confidence in your abilities to identify the signs of a bottom and have an intimate understanding of how to manage risk, the more risk-averse play is to wait for stocks to pass back up through low-risk buy zones.
Market corrections are a risk manager's favorite time of the year. If they have done their job effectively, a good risk manager has protected themselves from the majority of the market decline. This allows them to sit back and identify names showing strength relative to the rest of the market, preparing to enter those names once the pullback appears to have ended.
Identifying Relative Strength in a Market Correction
As I just mentioned, a pullback is the best time of year to identify the strongest stocks in the market. The pinned tweet on my twitter page (@Blakedavis50), is a thread breaking down some of the basic strategies to identify relative strength (RS) leaders.
In a correction or pullback, we’re looking for the stocks that decline the least relative to the indexes (in this case BTC). Studies of historical price action tell us that these stocks are likely to post the strongest gains once the selling pressure from the general market comes off.
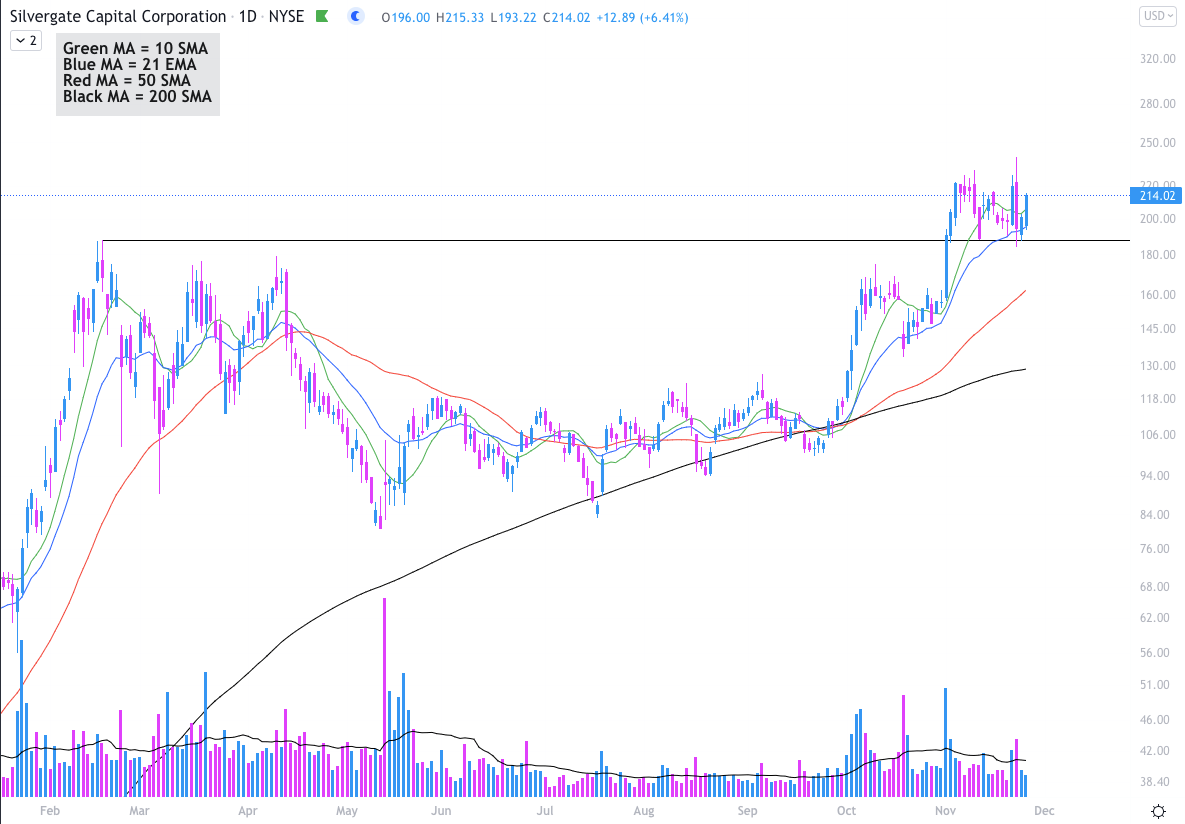
Silvergate Capital (SI) is a great example of a name that has, so far, proven itself as an RS leader. This chart tells me that despite the state of the general market and Bitcoin, institutions have mostly held their positions, if not bought more.
Monday is an ugly candlestick, SI tried to break out from a flag pattern but ran into a lot of supply as it entered new highs. After Monday’s close, it looked like SI could severely break down.
But as of Wednesday's close, it no longer appears this is the case. Tuesday and Wednesday, buyers supported SI around its 21day exponential moving average and bought all the way through the 10day EMA. When it retested the previous all-time high from February at $187.86, there was strong demand for shares at this level.
Since Bitcoin began to correct after making highs on 11/10, it is down roughly 17% off those highs at the time of writing. SI initially topped the day before BTC did, and is only down about 7% from that level.
This is what hedge fund manager Jim Roppel likes to call a basketball underwater. When swimming in the pool you paid for in BTC gains, it is difficult to hold a basketball underwater. The second you release it, the basketball explodes upwards.
The selling pressure from the general market and Bitcoin is the force holding SI under. It appears that once this trend changes, SI will likely continue to be a price action leader.
Public bitcoin mining firms ($RIOT, $MARA, $HUT, and others) are bringing on significant hash power to the Bitcoin network in 2022.
These mining firms publicly release their ASIC orders, and they are highly transparent about the size of the facilities they are building.
Compiling all of this public data, Blockware Solutions can estimate how much hash power these firms will bring onto the network, and how that will affect the hash price ($/TH).
Compiling all public mining orders, an estimated additional 56.5 EH/s will be added to the network from the above mining firms by the end of 2022. This is ≈ 34.7% of the total current hash rate.
Hash Price Scenario Analysis
Below is a chart visualizing how these new ASICs joining the network will affect Hash Price ($/TH) assuming the price remains where it’s at today.
For reference, hash price can be calculated by dividing the total daily miner revenue ($) by the hash rate (TH). This is a useful metric for miners to determine the profitability of their machines now and in the future.
If the price of bitcoin remains at $58,000, the hash price ($/TH) would drop from $0.33 today to $0.24 at the end of 2022. This would still be profitable for almost all miners.
In conclusion, public miners are bringing on a significant amount of hash power to the bitcoin network in 2022, however, solely looking at this source of new hash power, mining margins should remain comfy in 2022 as long as the price of bitcoin doesn’t fall back towards $20,000.
This significant investment of capital from institutional investors into the mining space shows smart money is making a long-term committed investment into Bitcoin, a sign that the industry has grown significantly since 2017 and is now here to stay.


I just want to thank you for all your hard work!! The dashboard is looking brilliant and I'm sure it will bring so much value to all of us!!
Bravo Blake!