


Bitcoin is down 49% from its high, and the blockchain is showing the same fingerprint it has left at every major bottom in its history.
THE KEY POINTS
Bitcoin trades at $63,181, down 49% from its October 2025 high of $124,715.
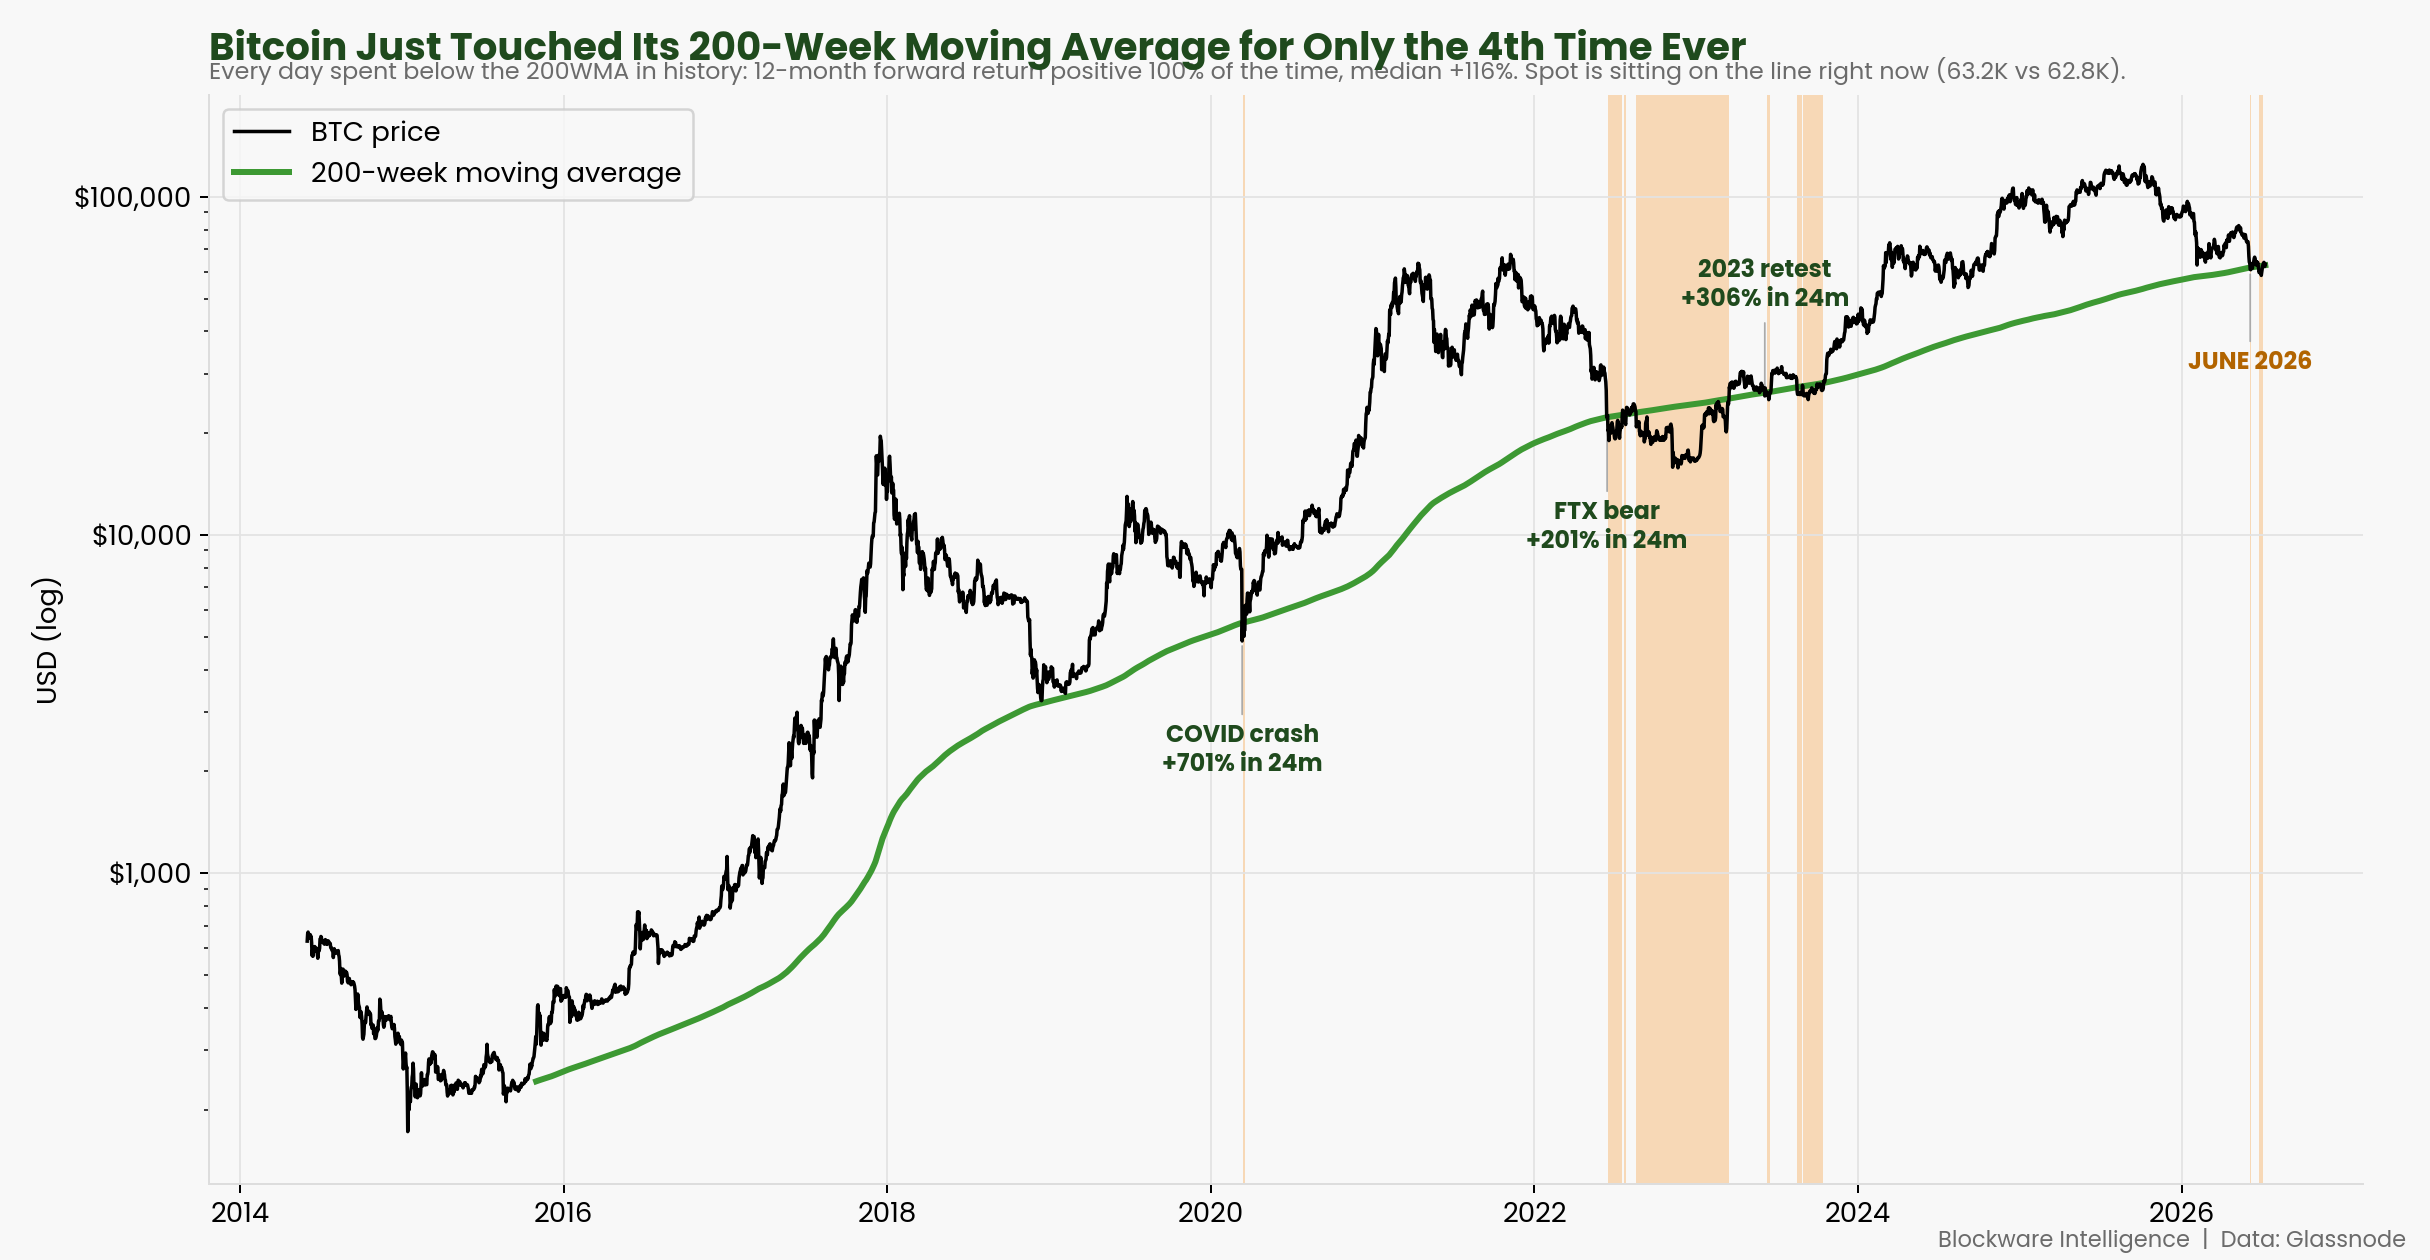
Price just touched its 200-week moving average for only the fourth time ever. Each prior instance was higher a year later, median gain 116%.
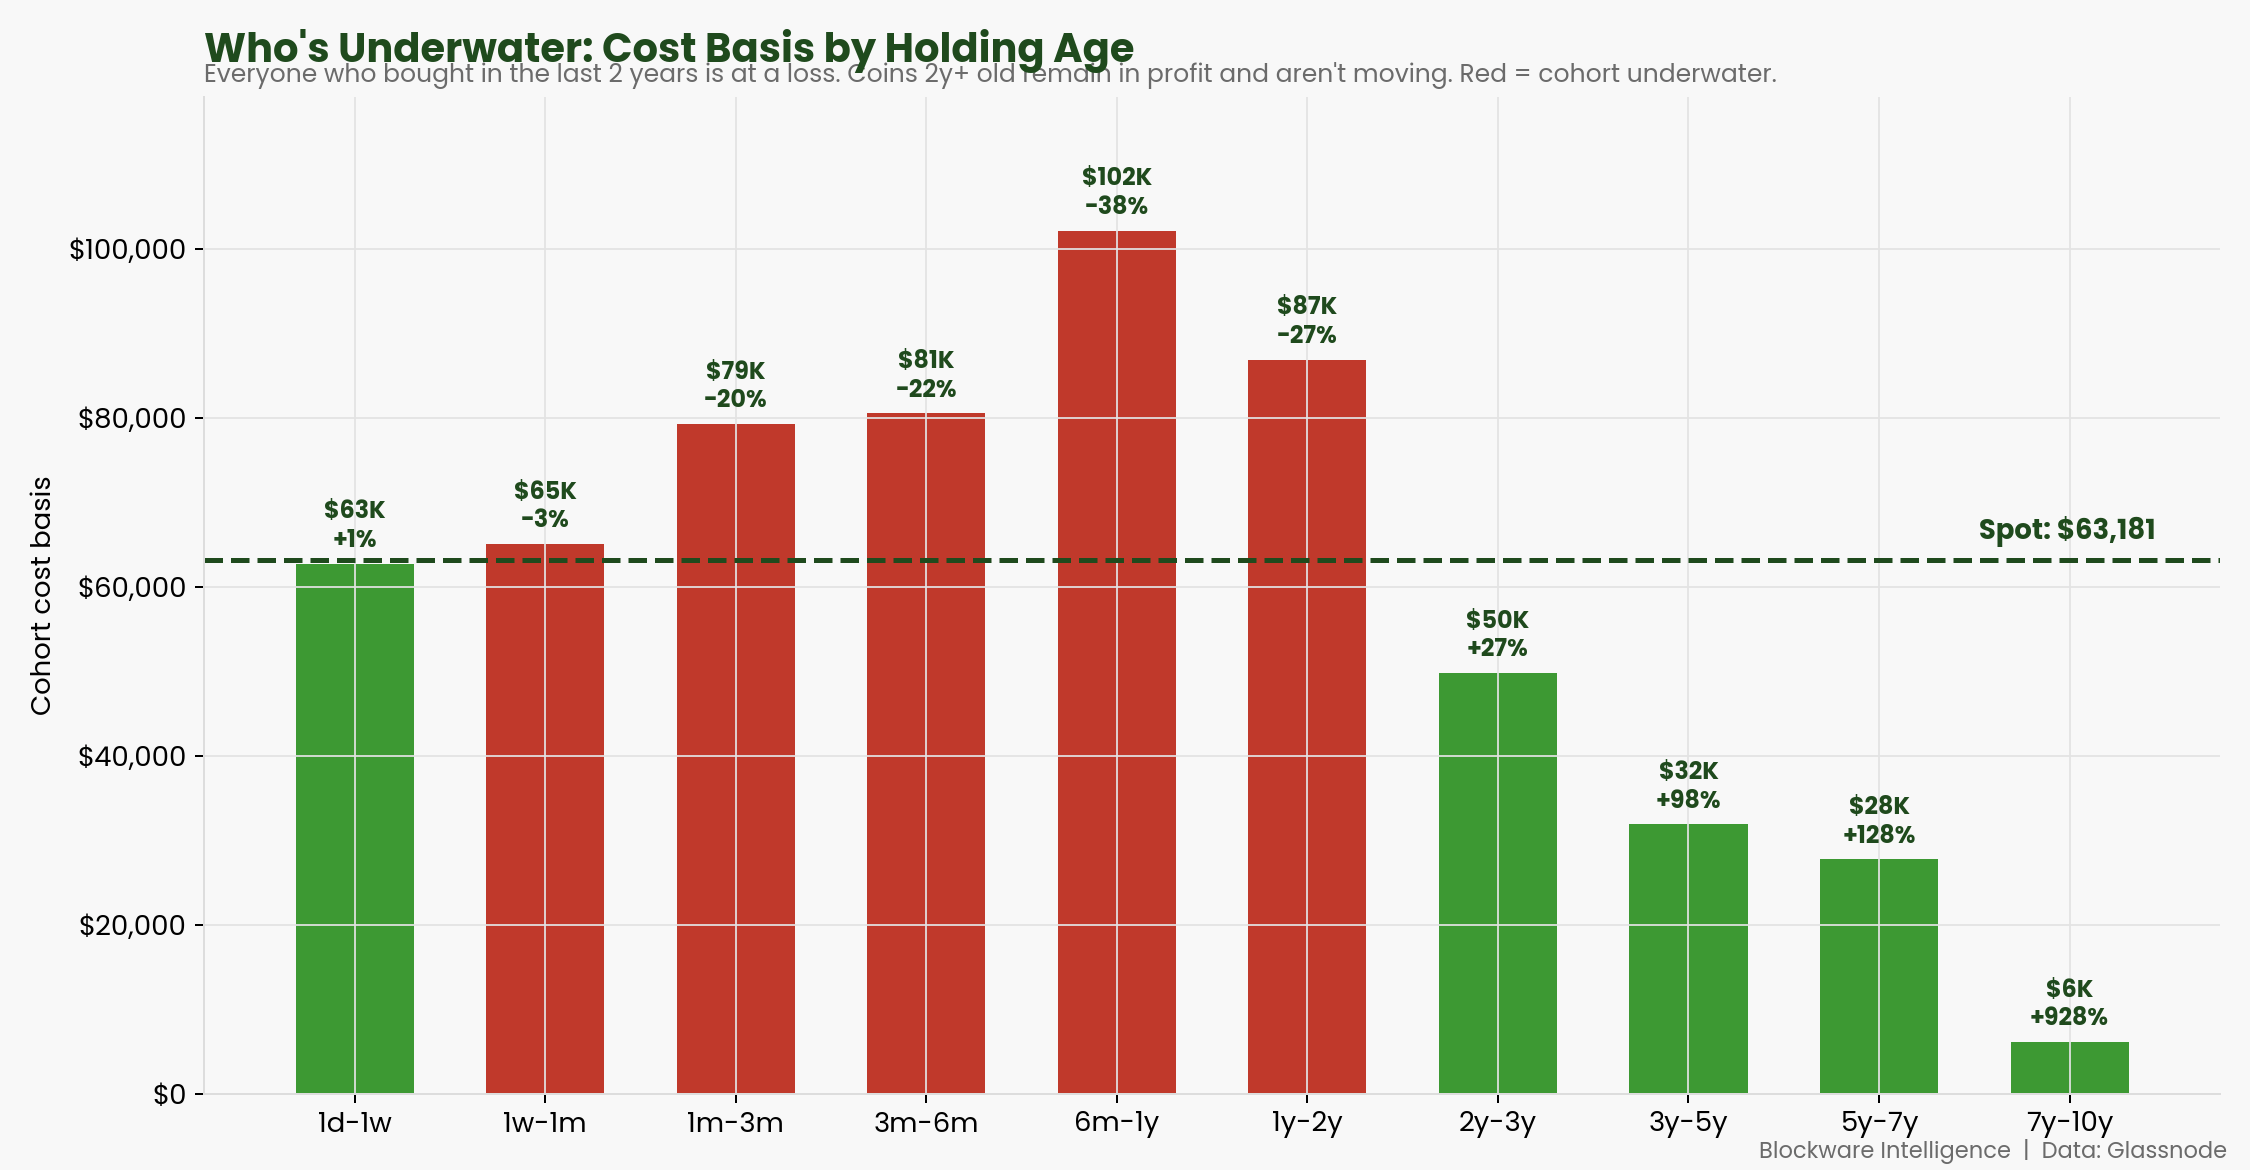
The average buyer from the last two years is underwater. The one-to-two-year cohort sits 27% below cost, while every holder older than two years is still in profit and not selling.
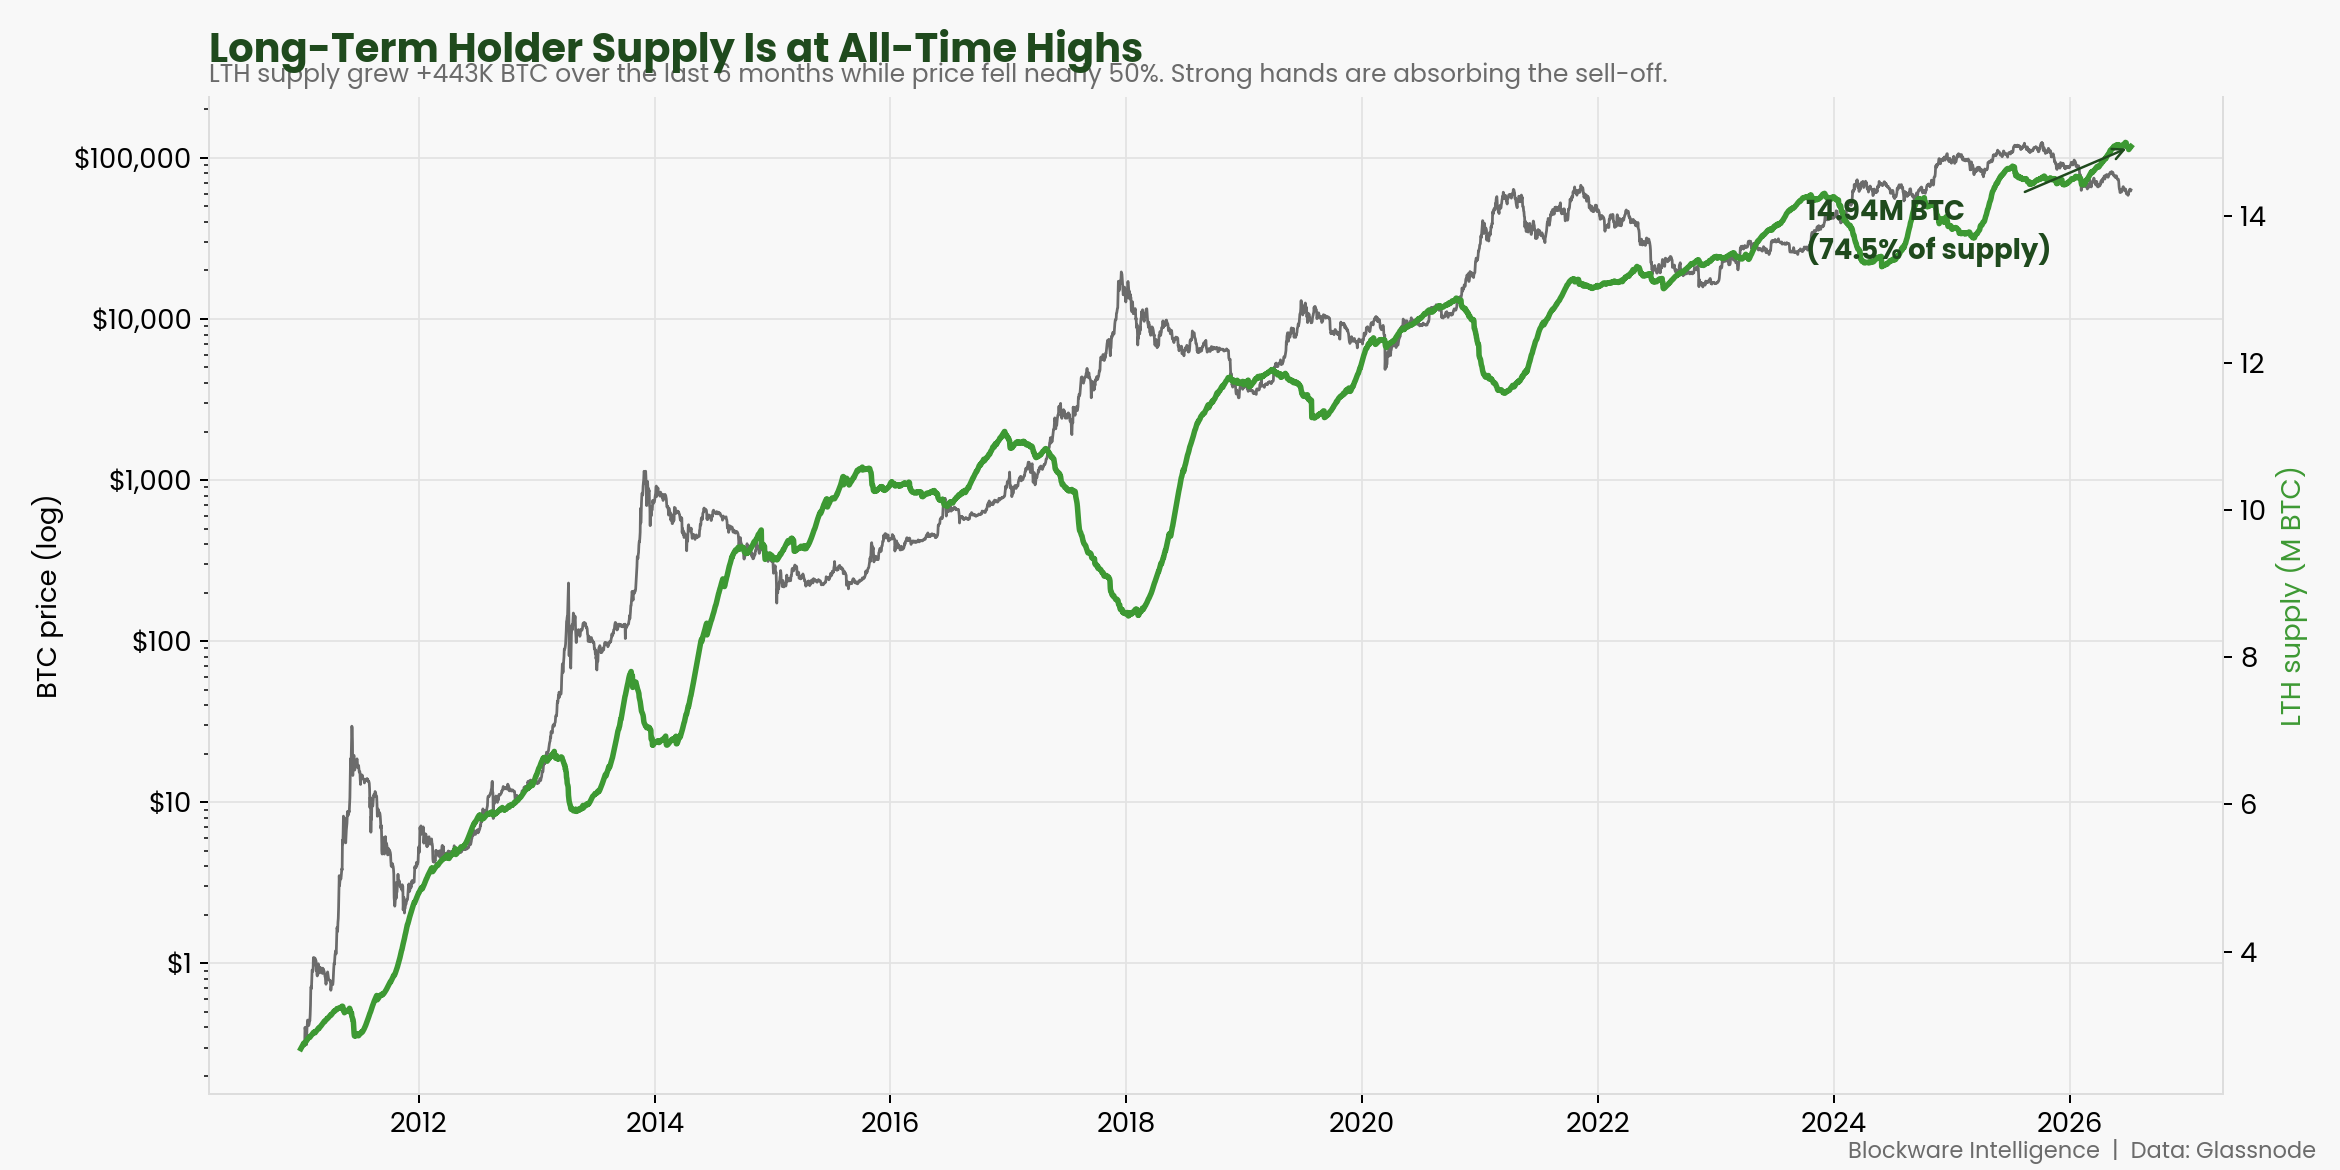
Long-term holders control 74.5% of all Bitcoin, an all-time high, and added 443,000 coins over six months as price fell in half.
Old coins are dormant and forced selling has faded. The capitulation that drove the June low is largely behind us.
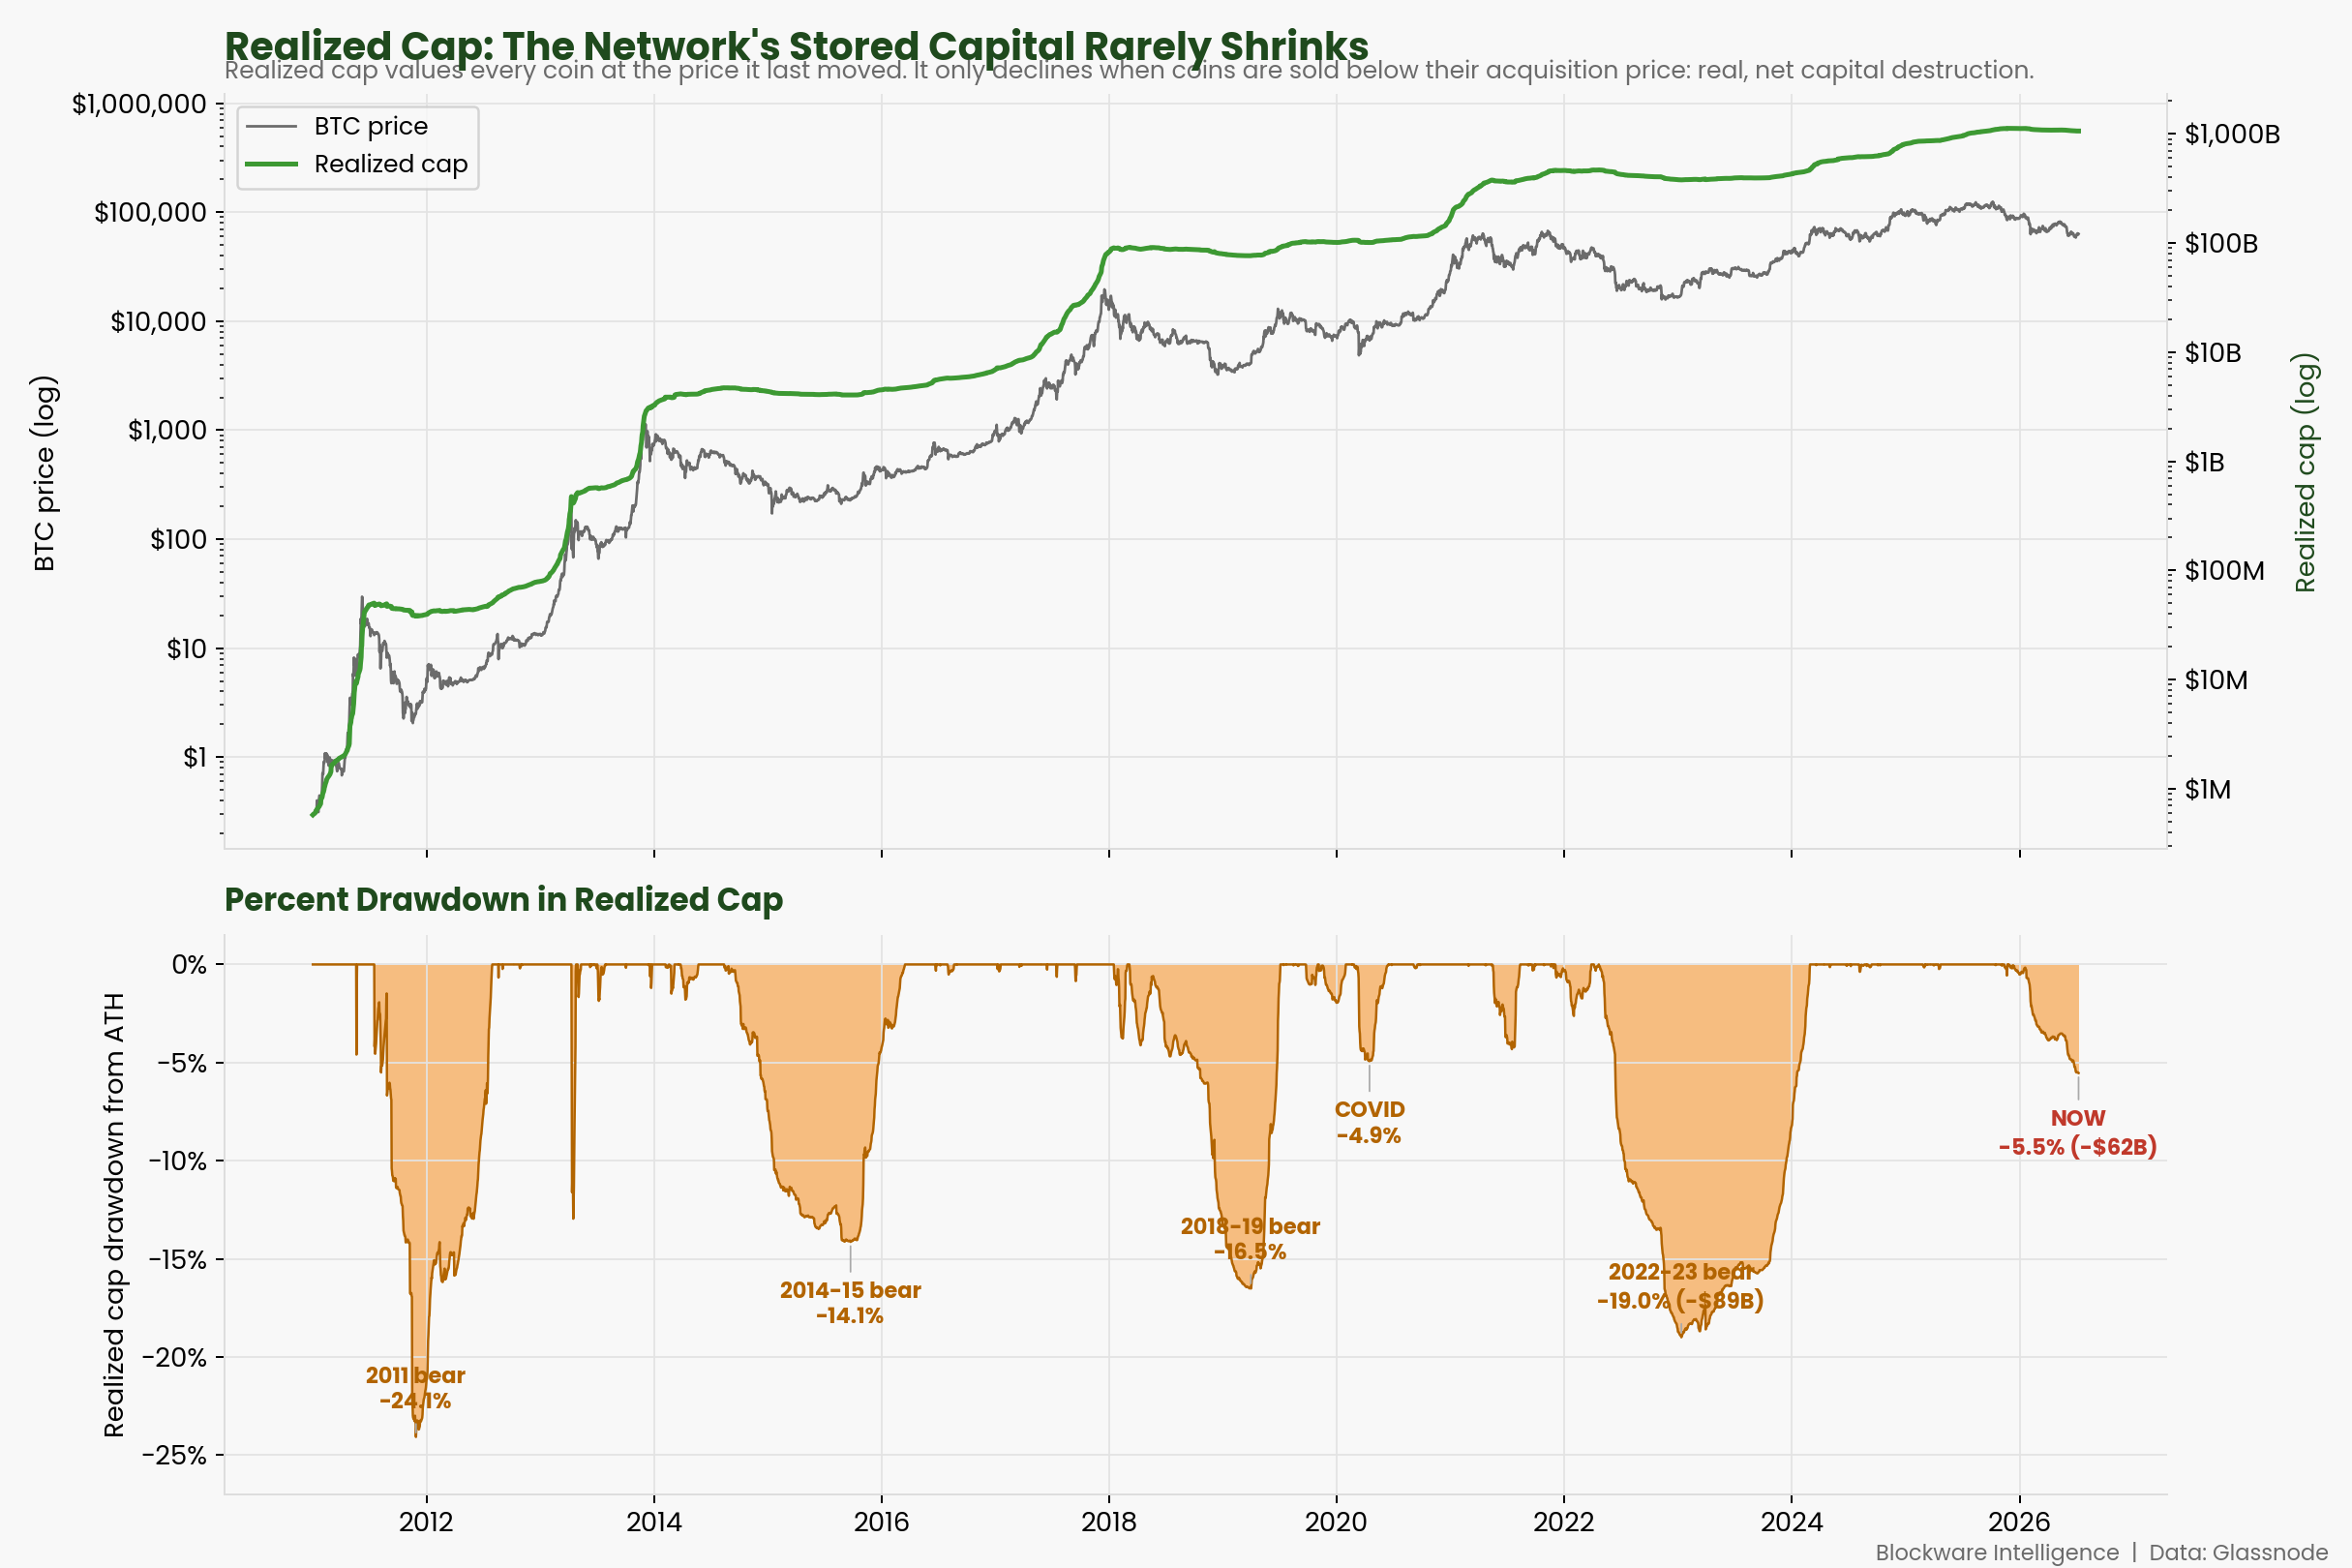
Realized Market Cap has fallen $62 billion, the second largest drop ever, yet stored capital is down only 5.5%. This holder base is far stickier than past bears.
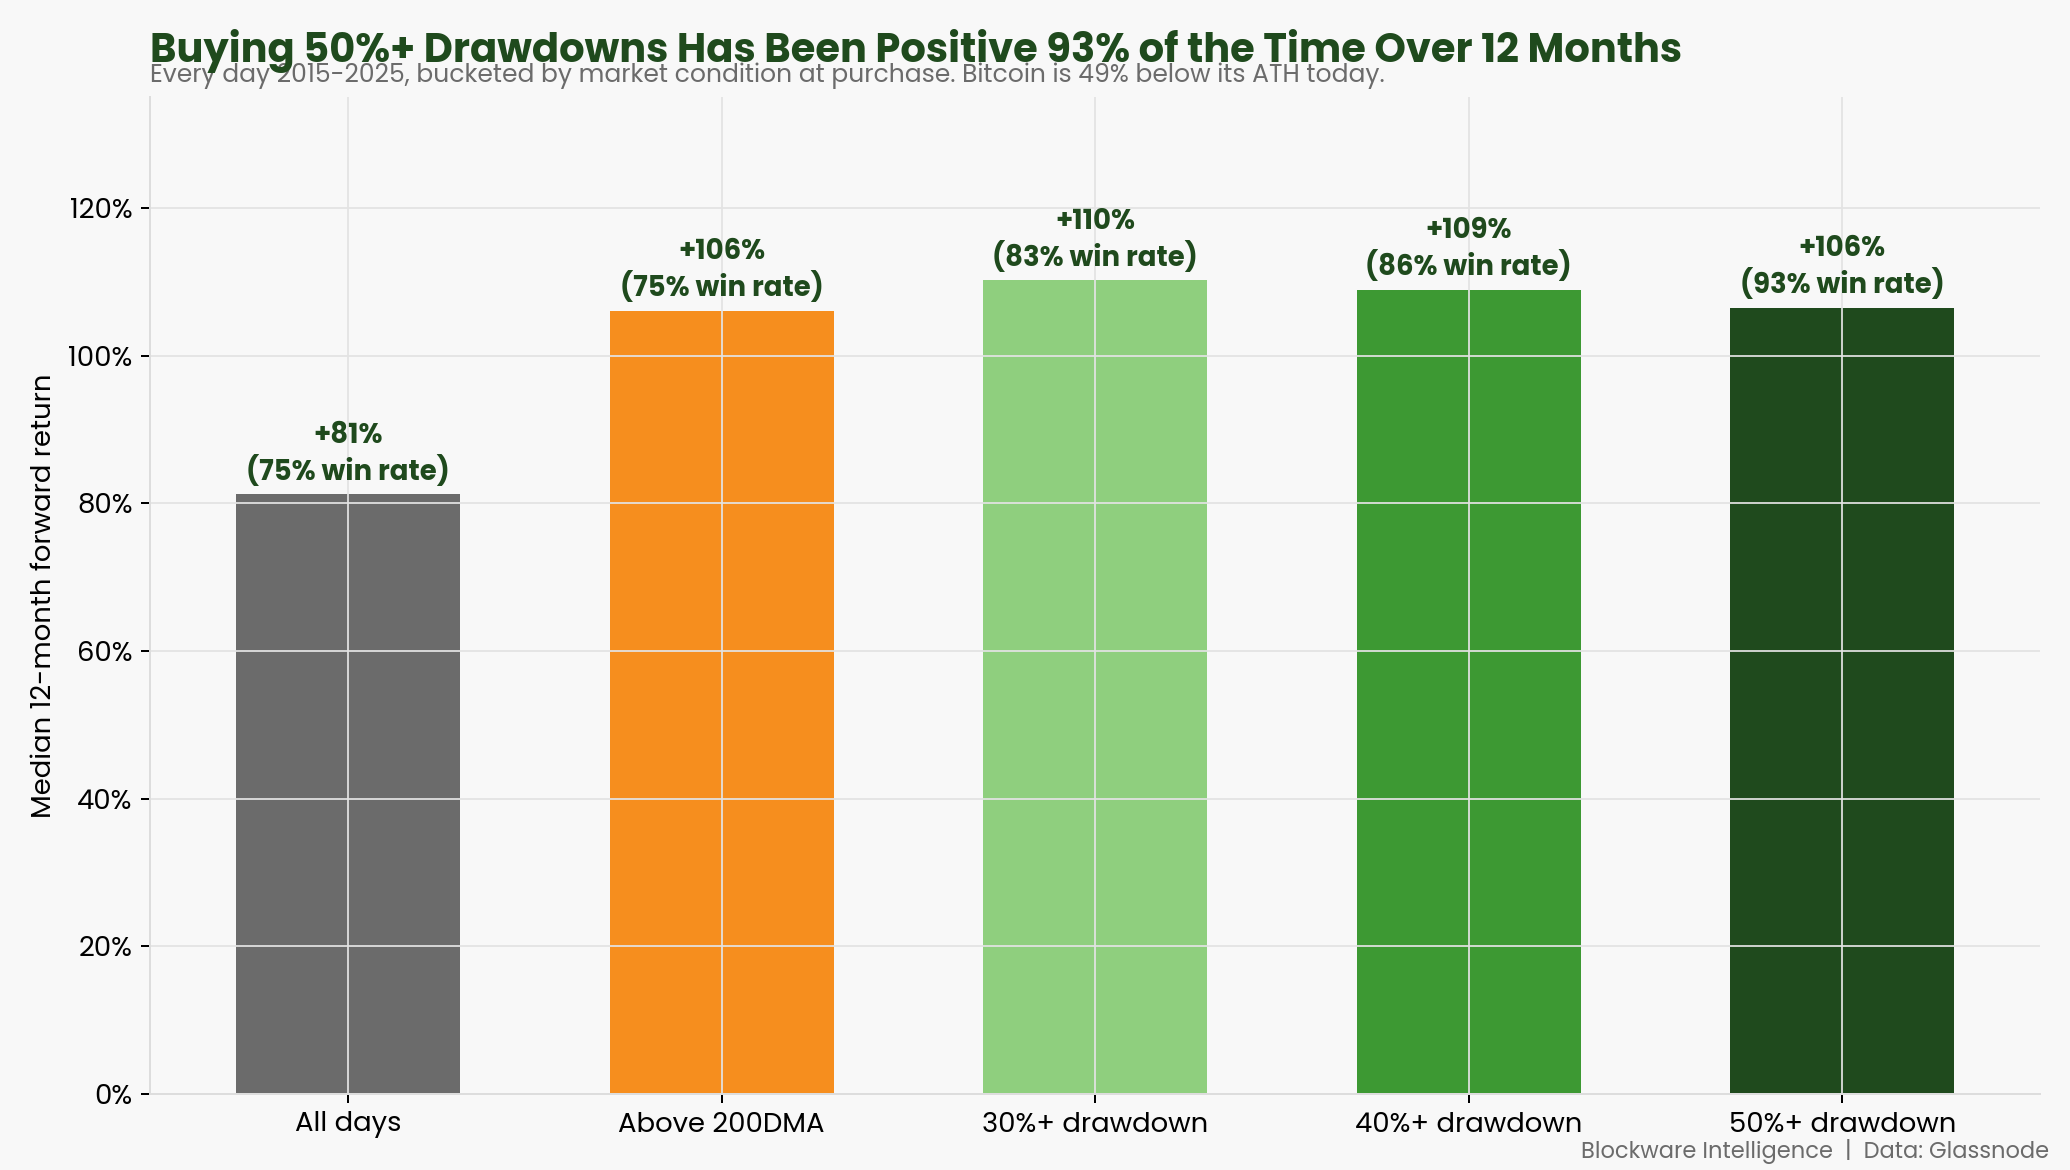
Buying Bitcoin during deep drawdowns has produced a positive twelve-month return between 83% and 93% of the time.
Missing the ten best trading days in a year has historically erased the entire year’s gain. Consistent dollar cost averaging is how you stay present for them.
Bitcoin Sits On Its 200-Week Moving Average
The 200-week moving average is one of the most reliable long-term value floors in Bitcoin’s history. Price closed below it in early June for only the fourth time ever, bottomed at $58,544, and has since reclaimed the line. It now sits at $62,754 with spot at $63,181, so Bitcoin is trading right on top of it. In the three prior instances, the twelve-month forward return was positive every time, with a median gain of 116%.
Everyone Who Bought In The Last Two Years Is Underwater
This splits the supply into cohorts by how long each coin has been held and shows the average price each group paid. Every buyer from the last two years is now underwater, with the six-month to one-year cohort down the most at 38%. Every cohort older than two years remains in profit, some of them deeply so. That divide explains exactly who has been selling and who has been sitting still.
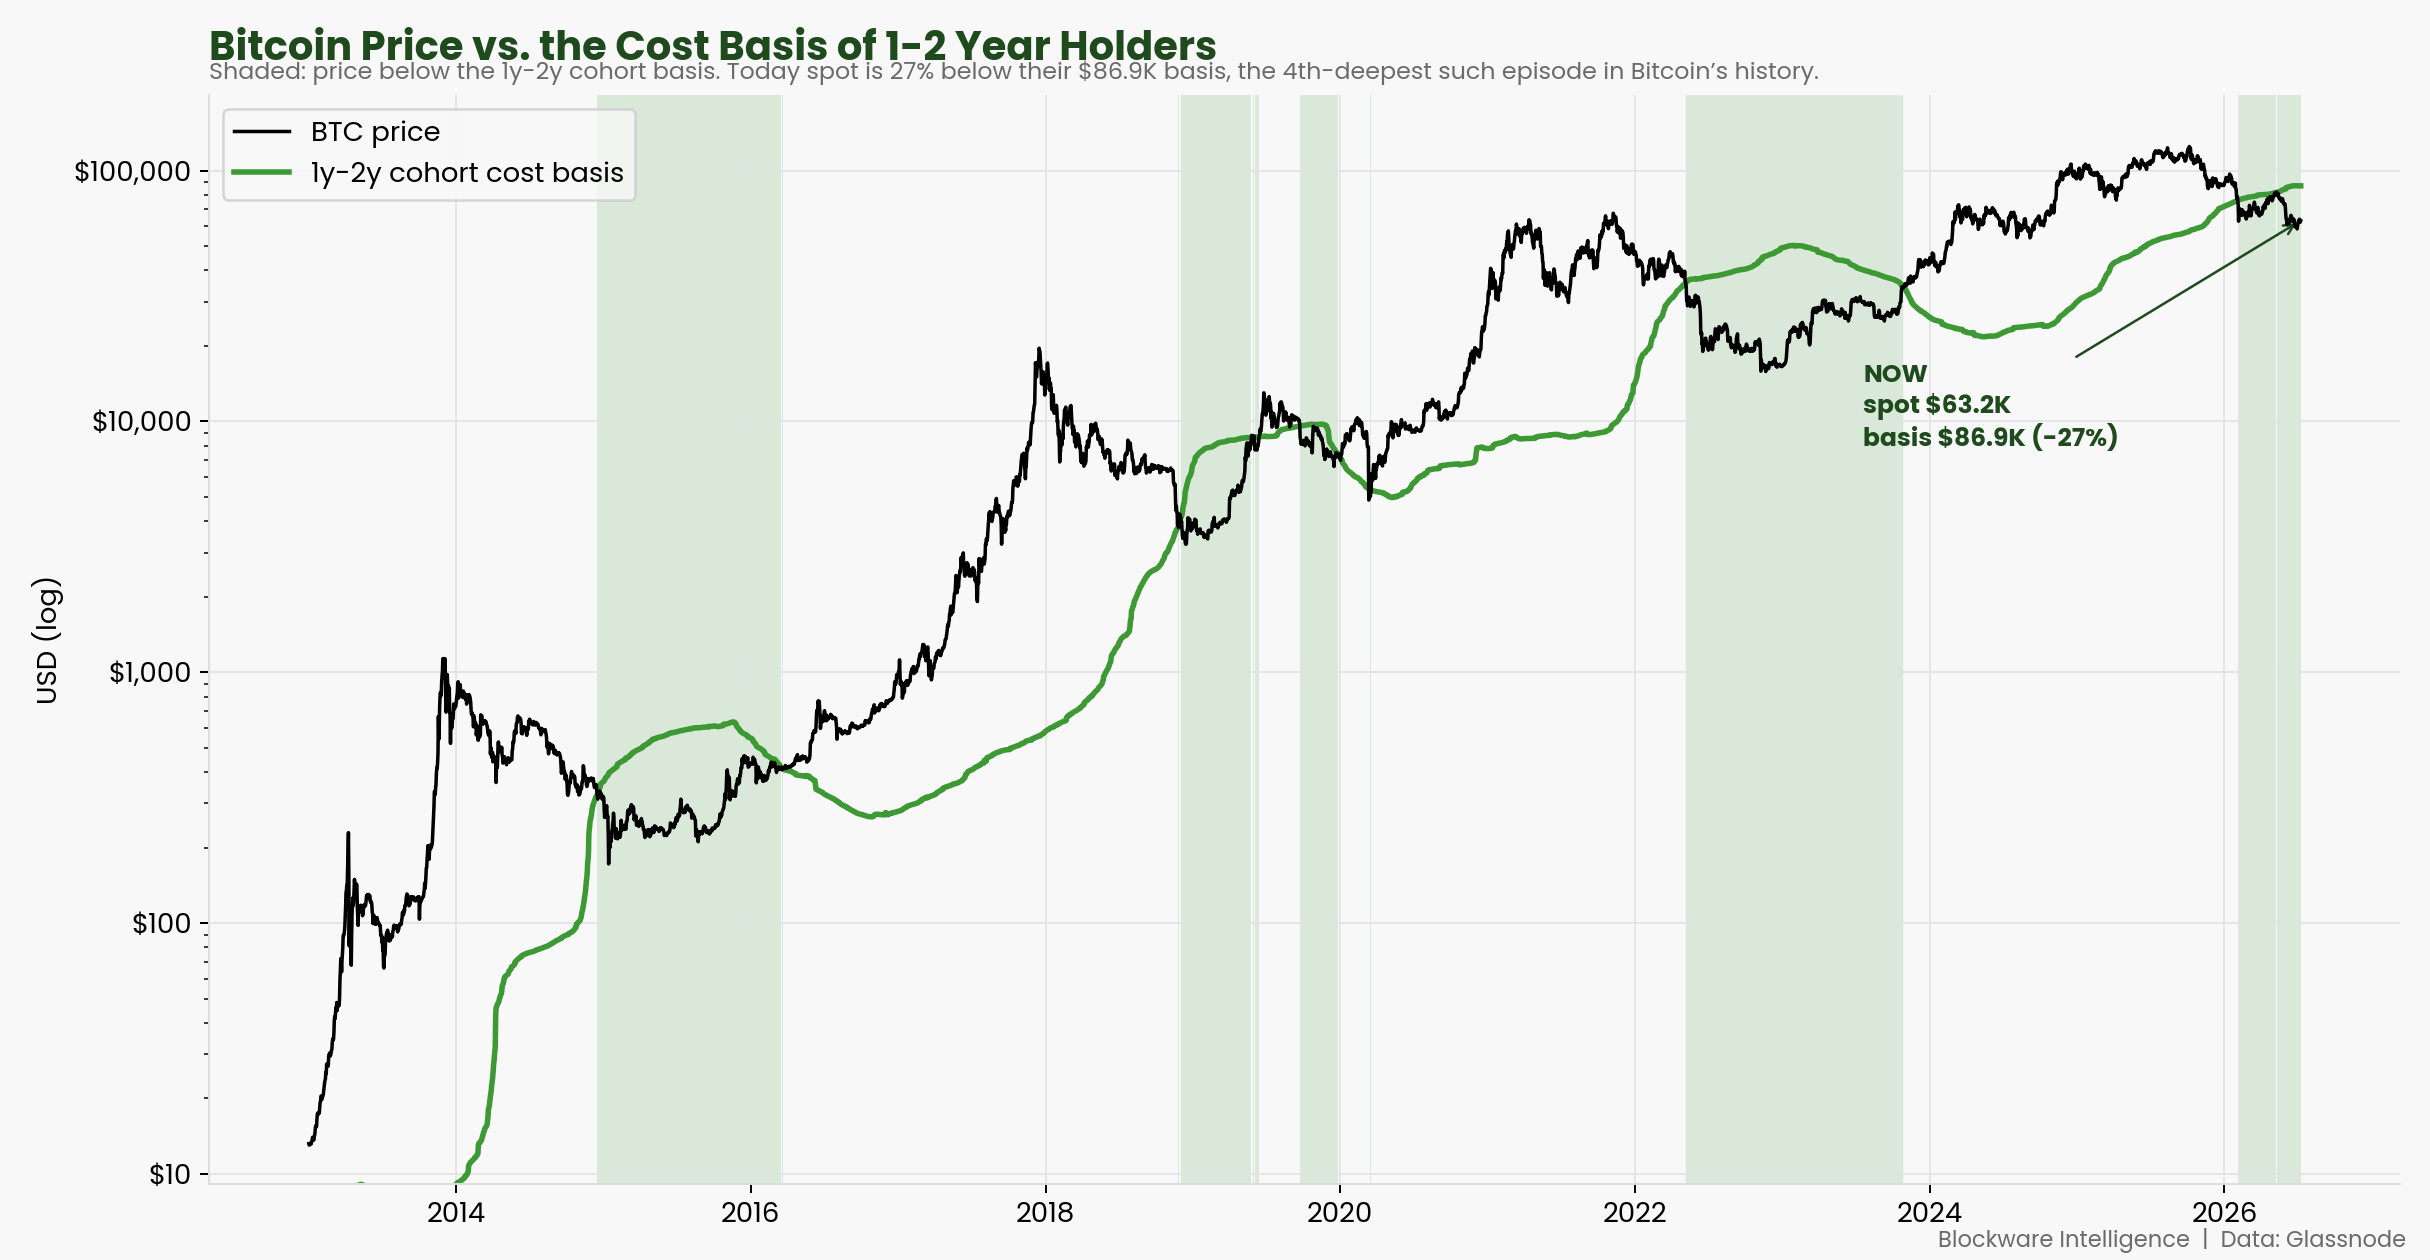
Price Below The 1-2 Year Cost Basis Only Happens At Bottoms
Here is the cost basis of the one-to-two-year cohort plotted against price, with the shaded regions marking every stretch price traded below it. This has only occurred during major bear market lows: 2015, 2018 to 2019, the 2022 to 2023 bottom, and now. Today spot is 27% below this cohort’s $86,908 basis, the fourth-deepest reading Bitcoin has ever recorded. The only deeper instances were the FTX collapse, the 2015 bottom, and the 2018 bottom.
Long-Term Holders Are Buying The Weakness
Long-term holders are wallets that have held for at least 155 days, the group that historically buys weakness and sells strength. Their supply just hit an all-time high of 14.94 million coins, or 74.5% of everything in circulation. Over the last six months, while price fell nearly in half, this group added 443,000 coins. The panic selling from newer buyers is being absorbed by hands that have no intention of letting go.
More Than 60% Of Supply Has Not Moved In A Year
HODL waves divide the entire supply by how long since each coin last moved. The green bands represent coins held longer than a year, and they now account for 60.9% of supply, up from 59.1% six months ago. When these older bands expand during a drawdown, the selling pressure is coming almost entirely from recent buyers. The deep base of the market is not participating in the sell-off.
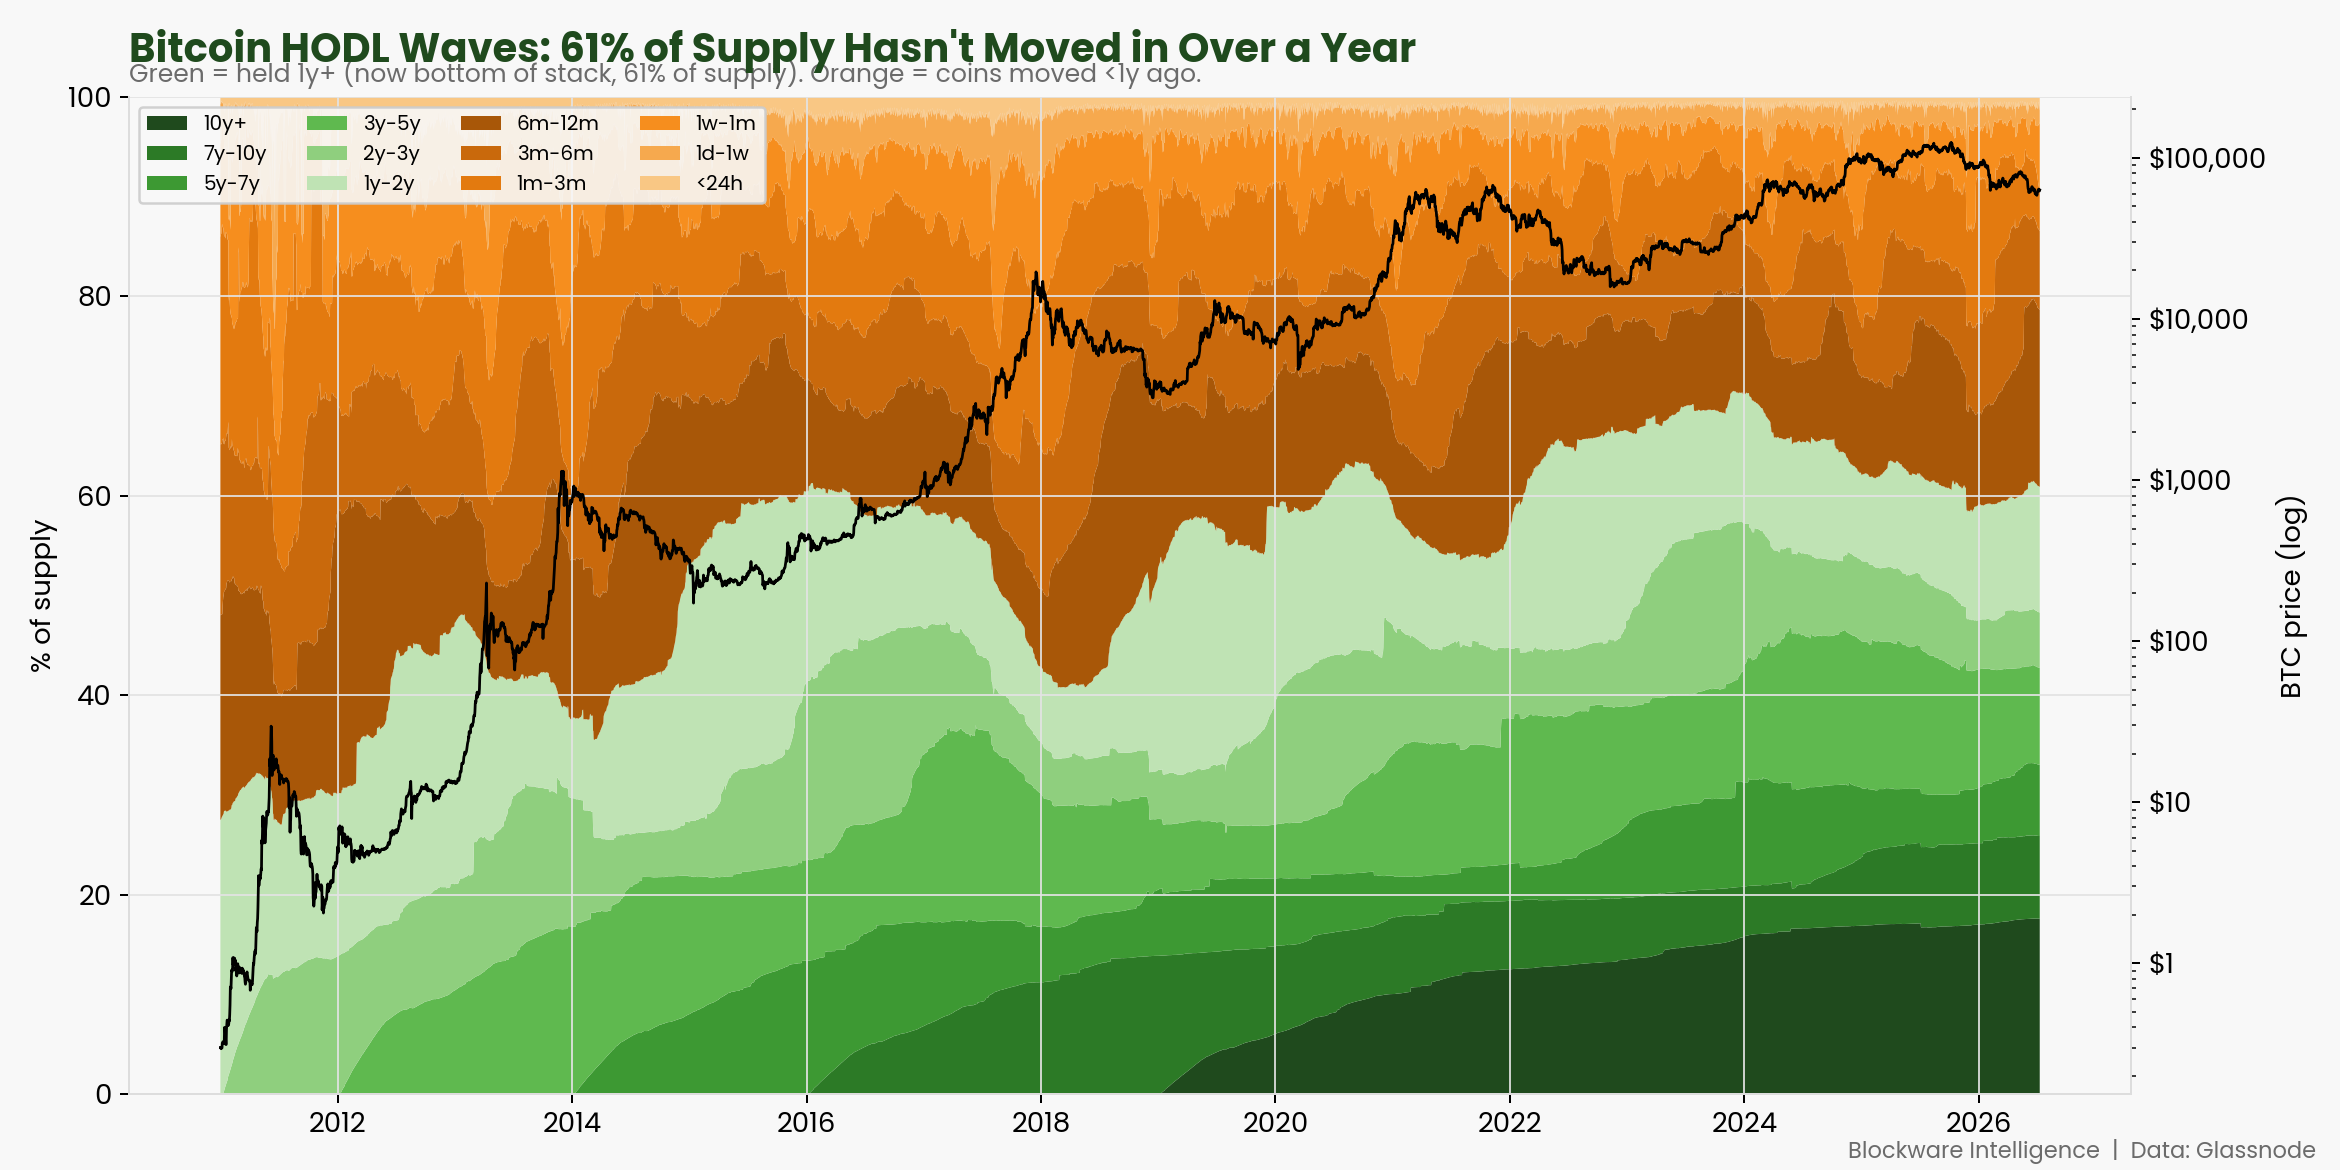
The Old Coins Are Dormant
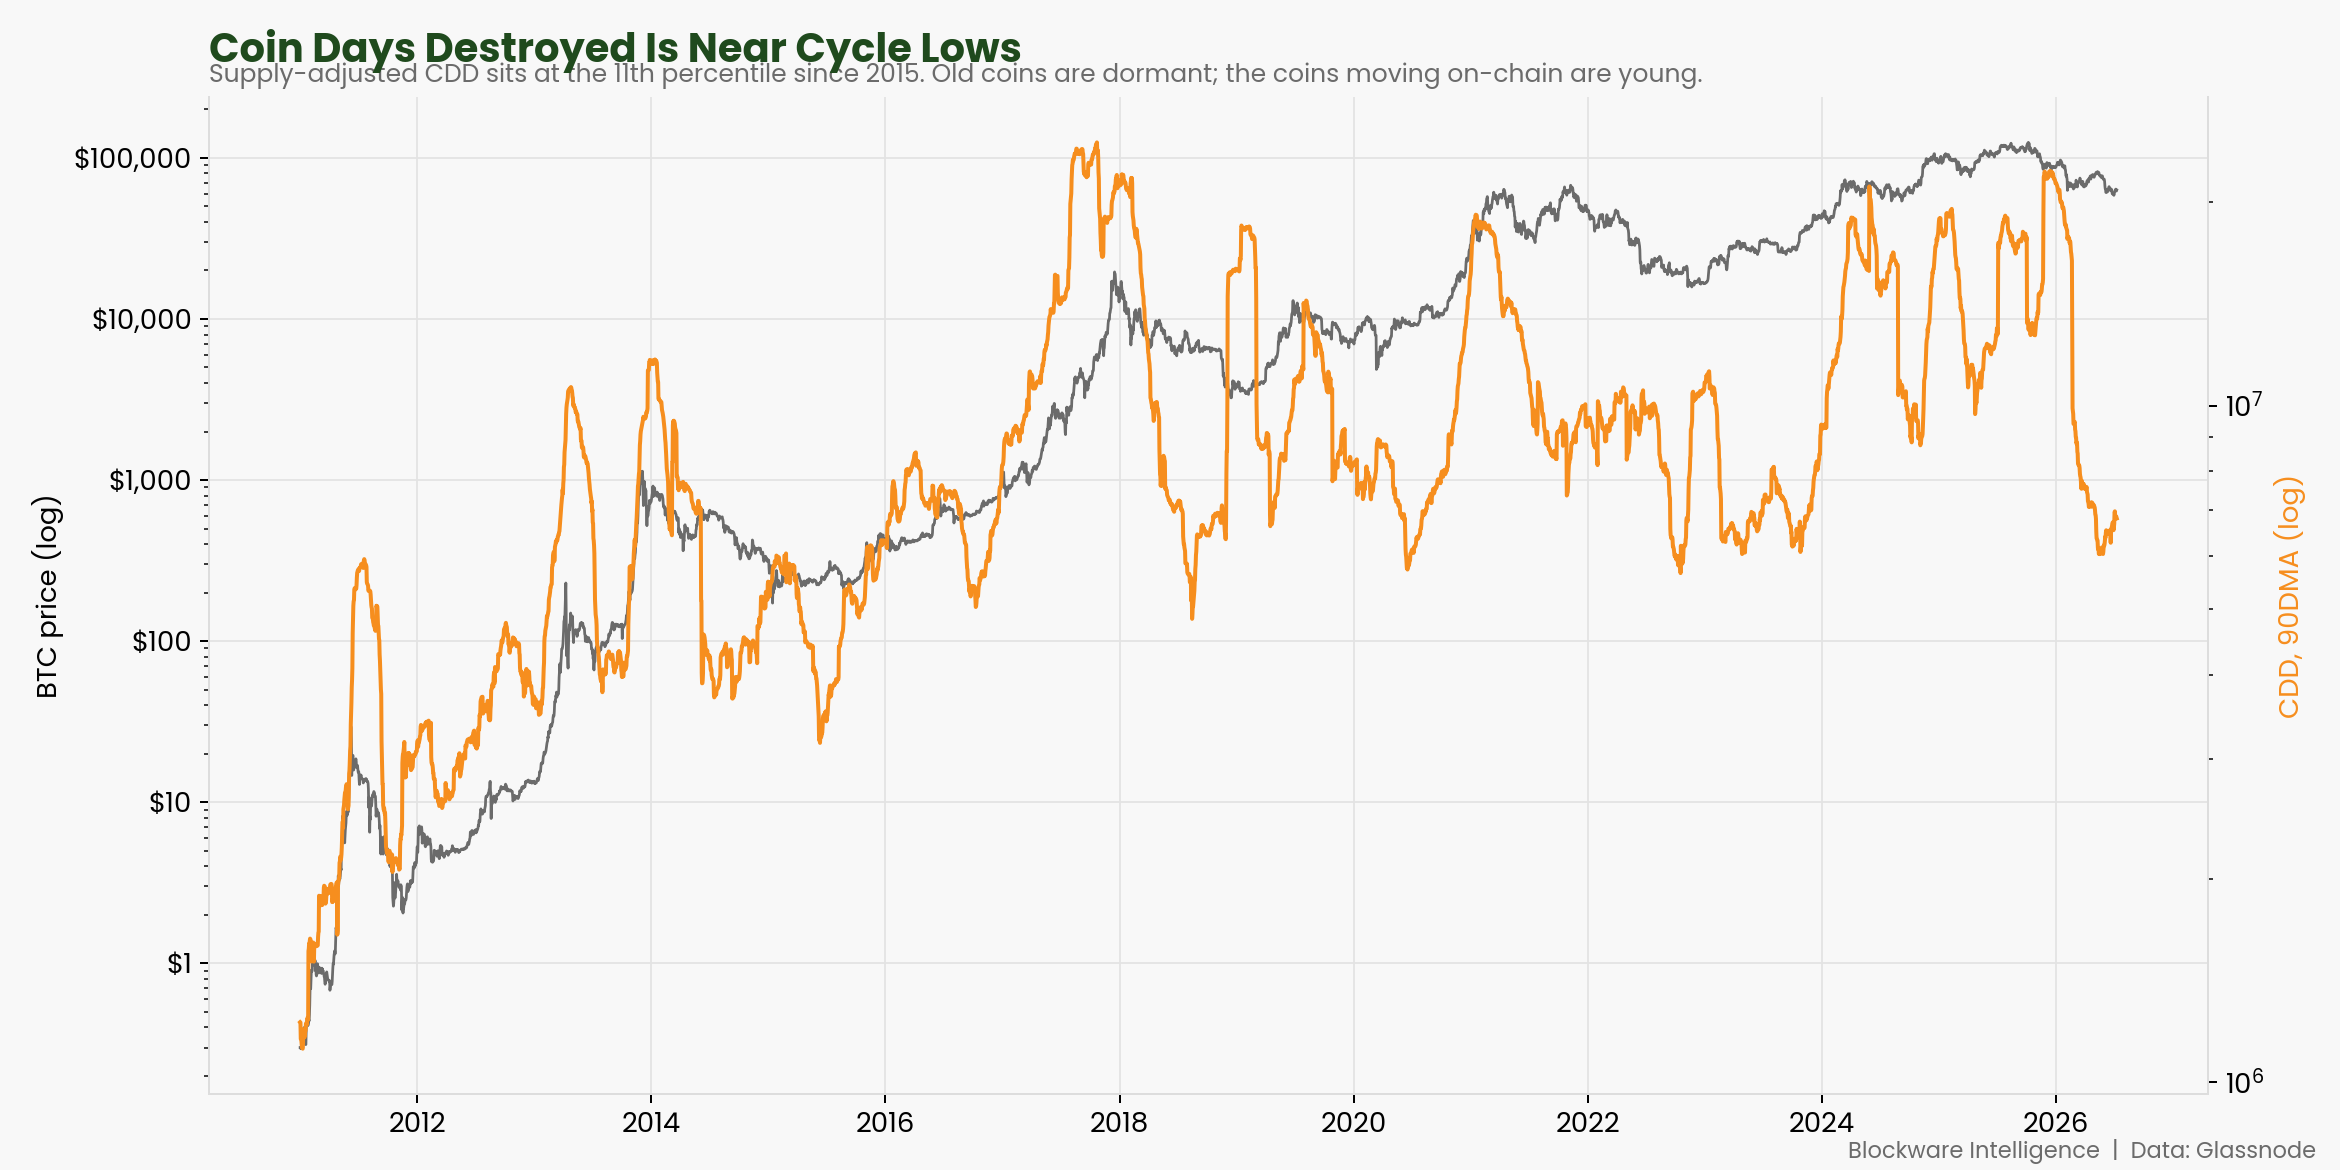
Coin Days Destroyed measures the economic weight of coins moving on-chain, registering high when old coins move and low when young coins move. Adjusted for supply, the metric sits at its 11th percentile since 2015, so the coins changing hands right now are overwhelmingly young. The long-term holders sitting on large unrealized gains have stayed still through the entire drawdown, which is the opposite of how tops form.
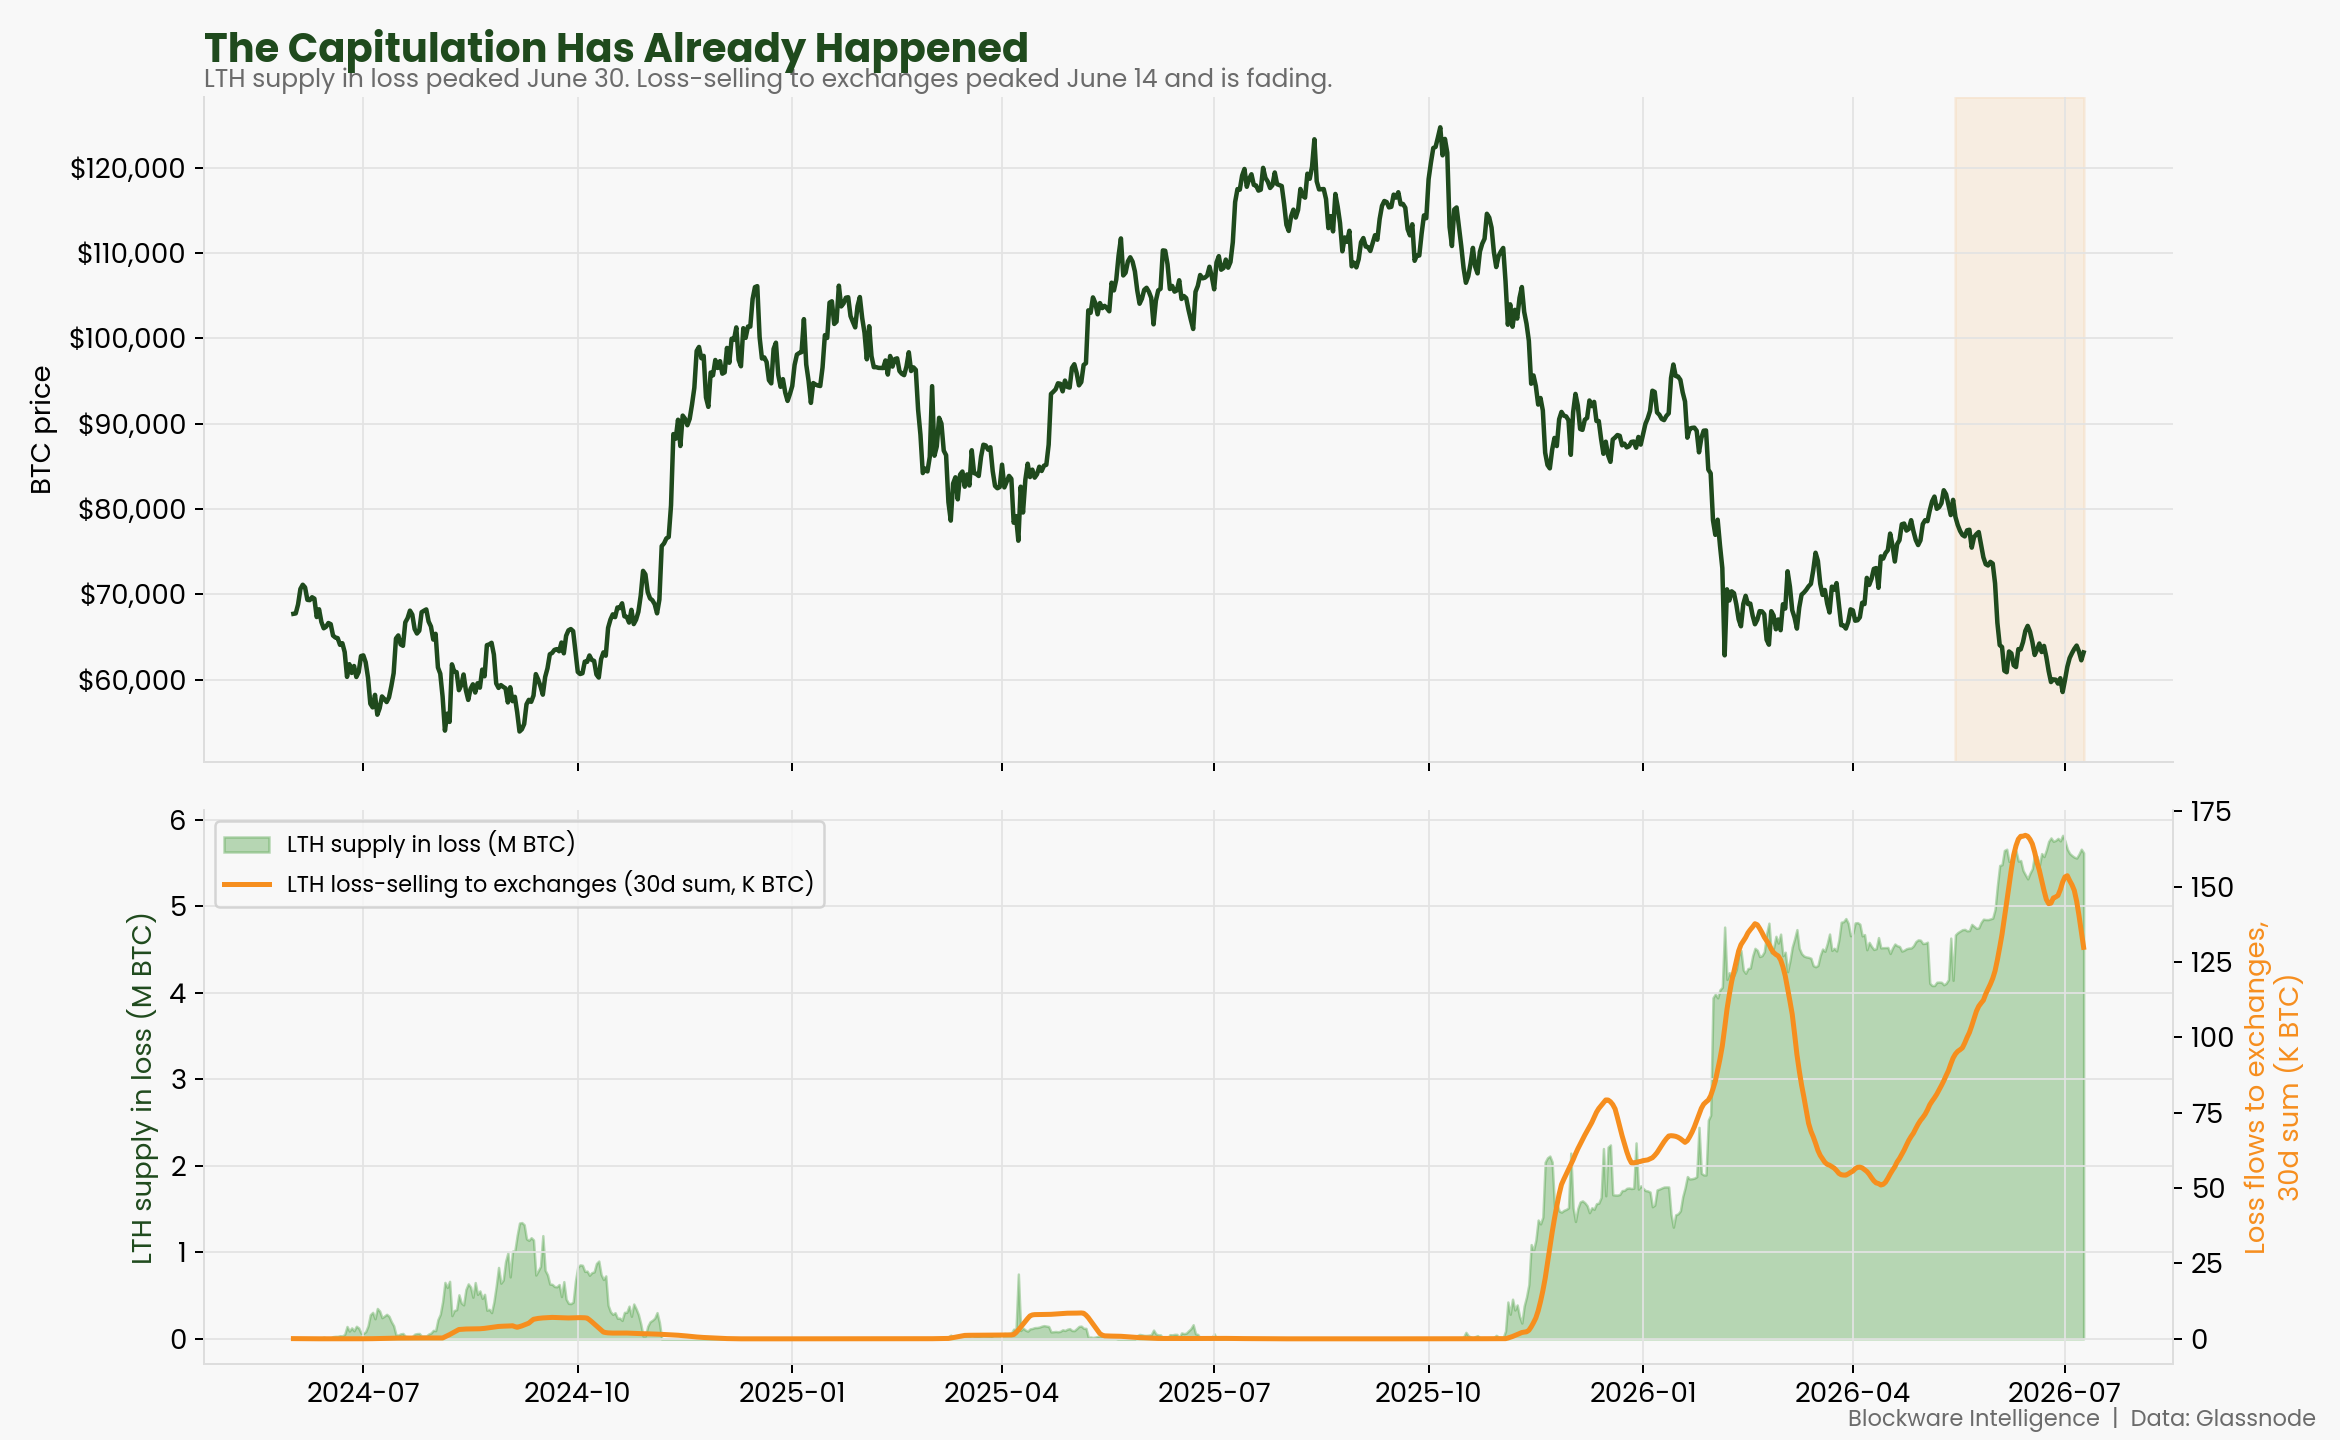
The Capitulation Has Already Happened
This tracks the amount of long-term holder supply sitting at a loss alongside the volume those holders sent to exchanges to sell. Loss-selling peaked in mid-June at 167,000 coins over a thirty-day window, precisely as price hit its low. It has since fallen to roughly 130,000 and keeps declining. The largest forced-selling event of this cycle is behind us and fading.
Capital Exiting, But The Base Is Sticky
Realized cap values every coin at the price it last moved, so it only falls when coins are sold below their acquisition price, and capital is leaving the network in the aggregate. That makes any decline a rare event confined to true bear markets. The current drawdown of 5.5% represents $62 billion in net capital lost, the second largest in dollar terms Bitcoin has ever seen. The percentage decline is far shallower than past bears of 14 to 24%, a sign this holder base is absorbing losses instead of fleeing.
What Has Happened After Buying That Condition
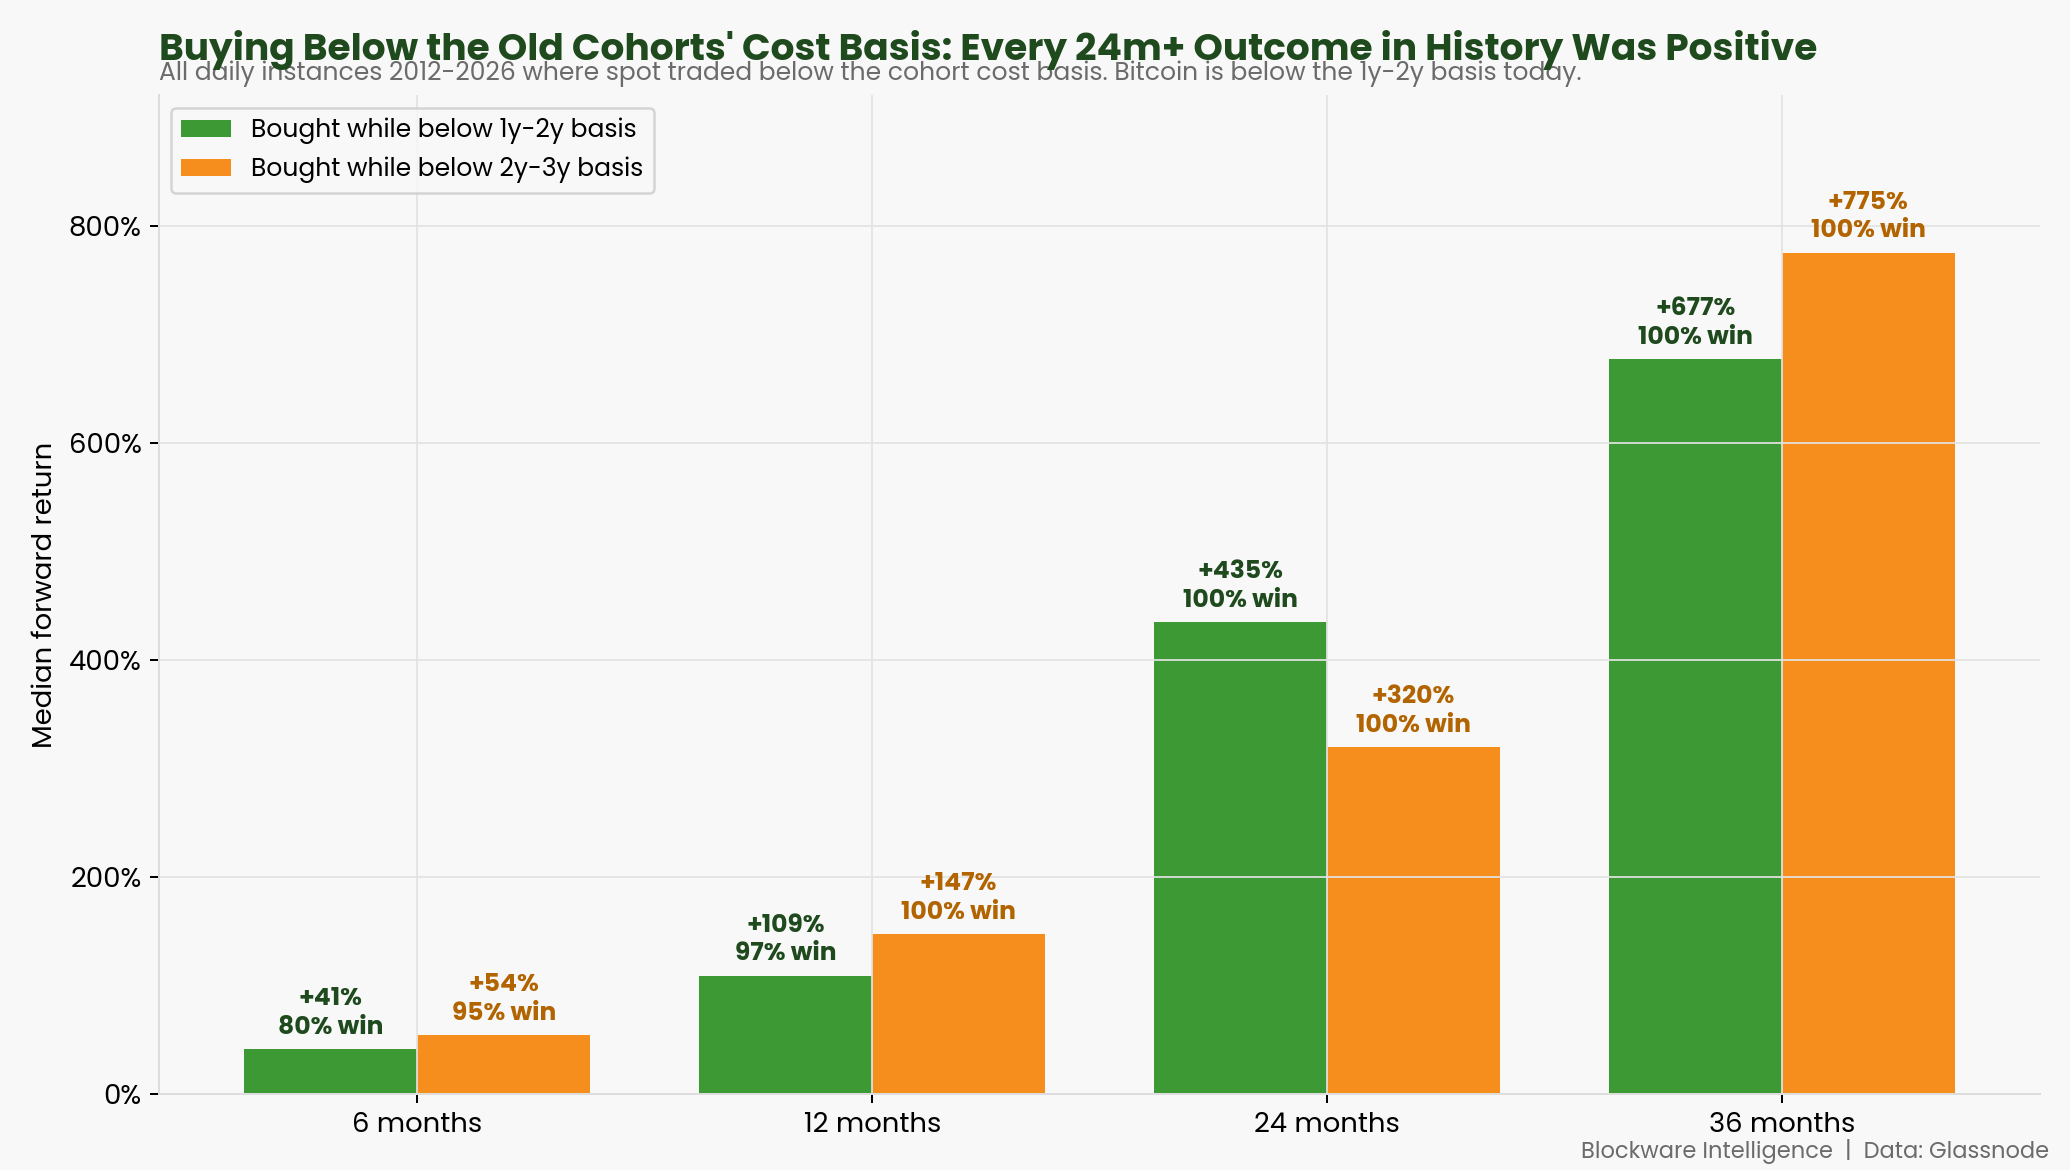
Taking every day in history when price traded below the one-to-two-year cohort’s cost basis, this shows what came next. Twelve months later the median return was 109% and the outcome was positive 97% of the time. At two and three years, every single instance was profitable, with median gains of 435% and 677%. Bitcoin is inside that exact condition today.
Miss The Best Days And You Miss The Year
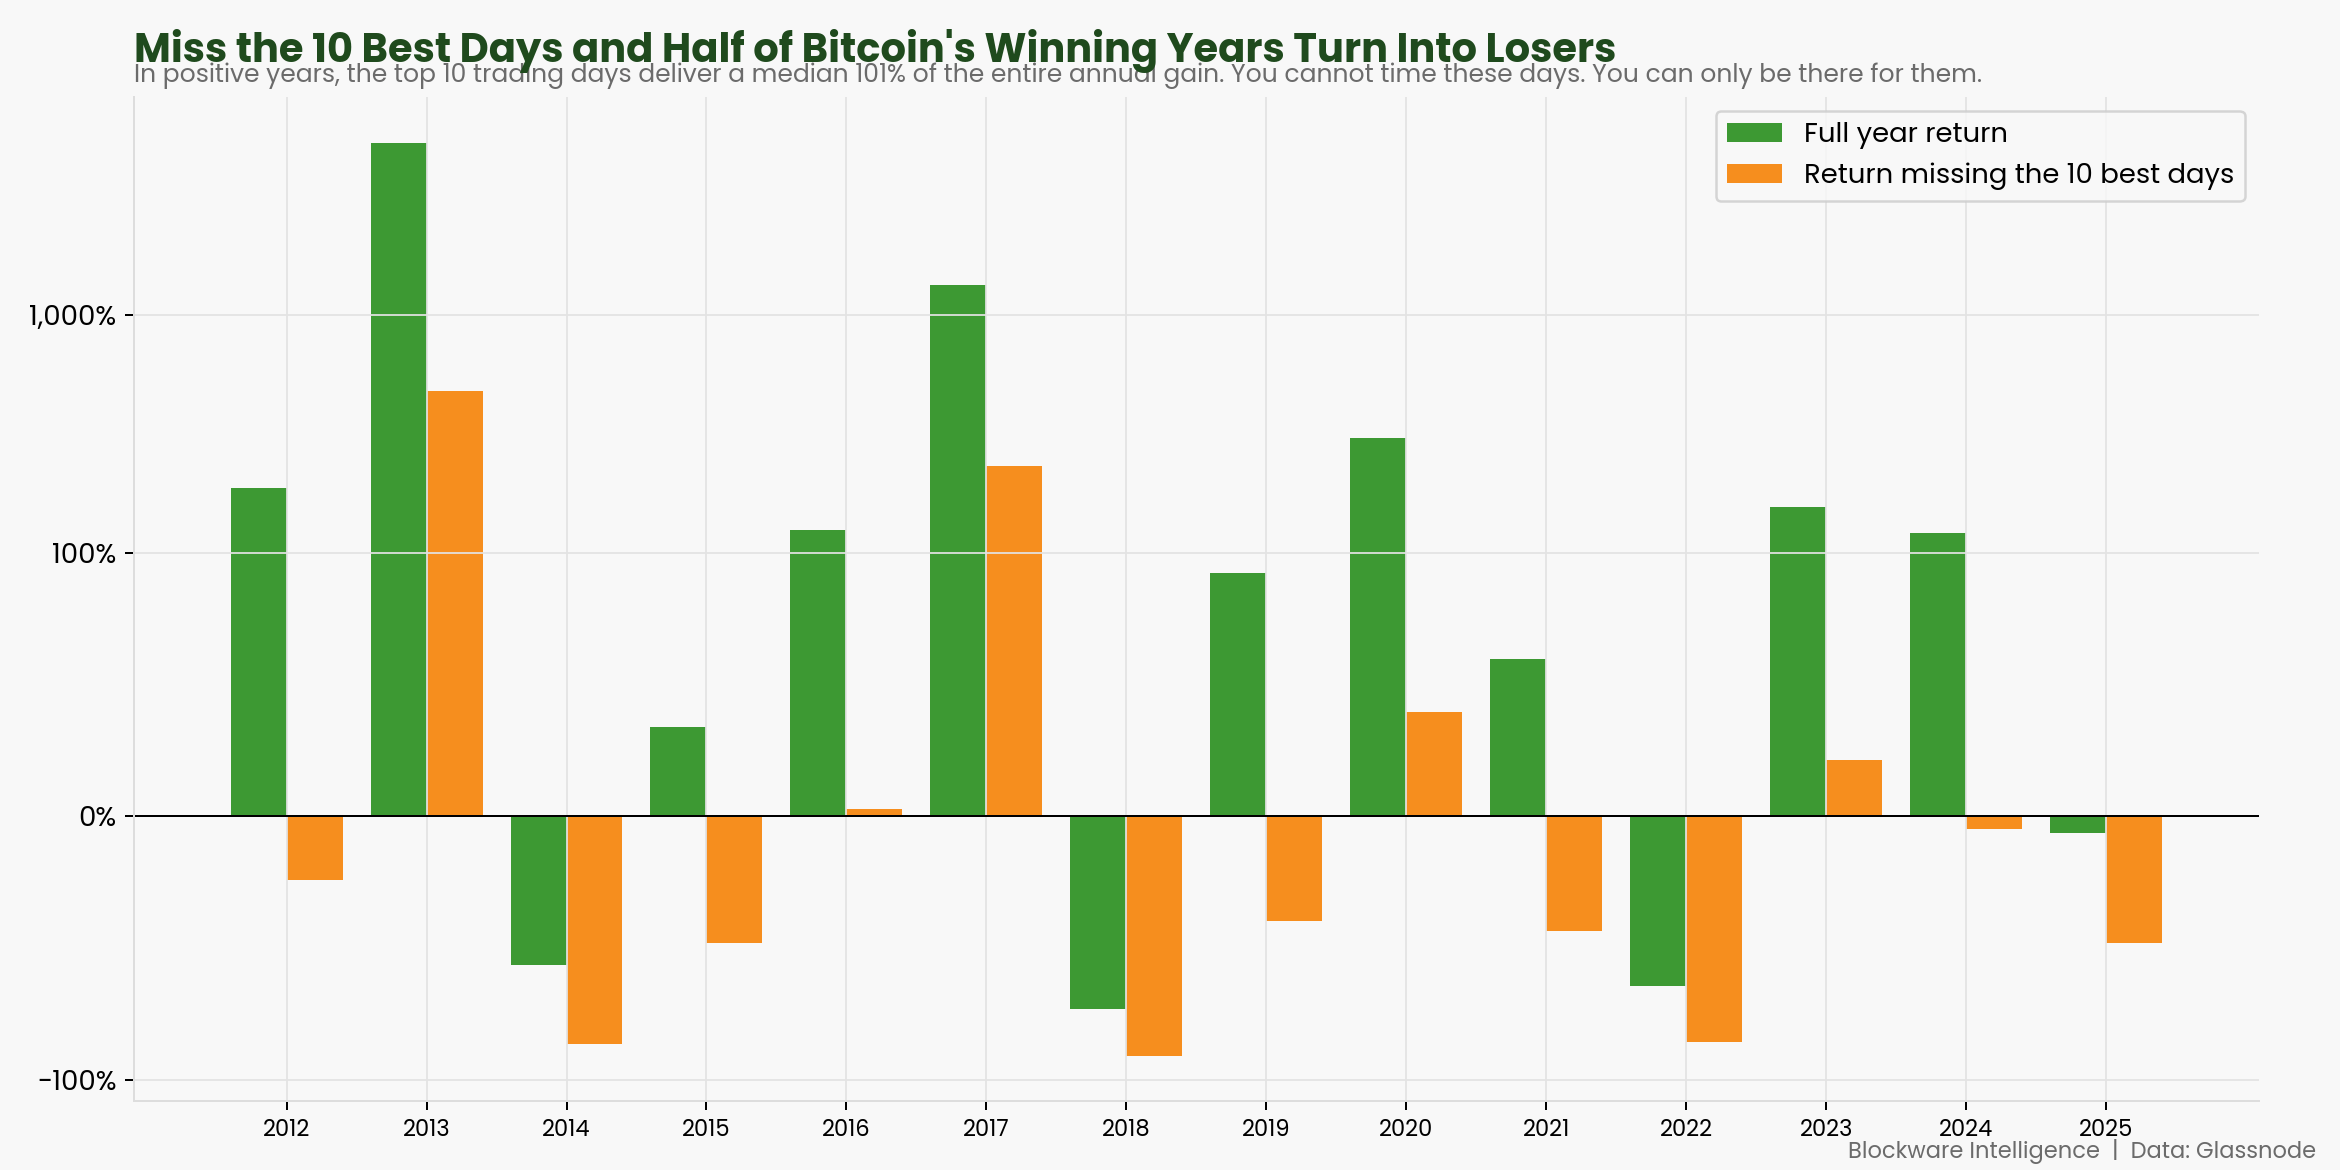
This is the core case for staying invested rather than timing entries. In Bitcoin’s positive years, the ten best trading days delivered a median of 101% of the entire year’s gain. Strip out those ten days and five of Bitcoin’s ten winning years flip to losing years. A $10,000 buy and hold since 2015 grew to $1.97 million, yet missing just the ten best days cut that to $347,000.
Where You Buy Sets Your Cost Basis
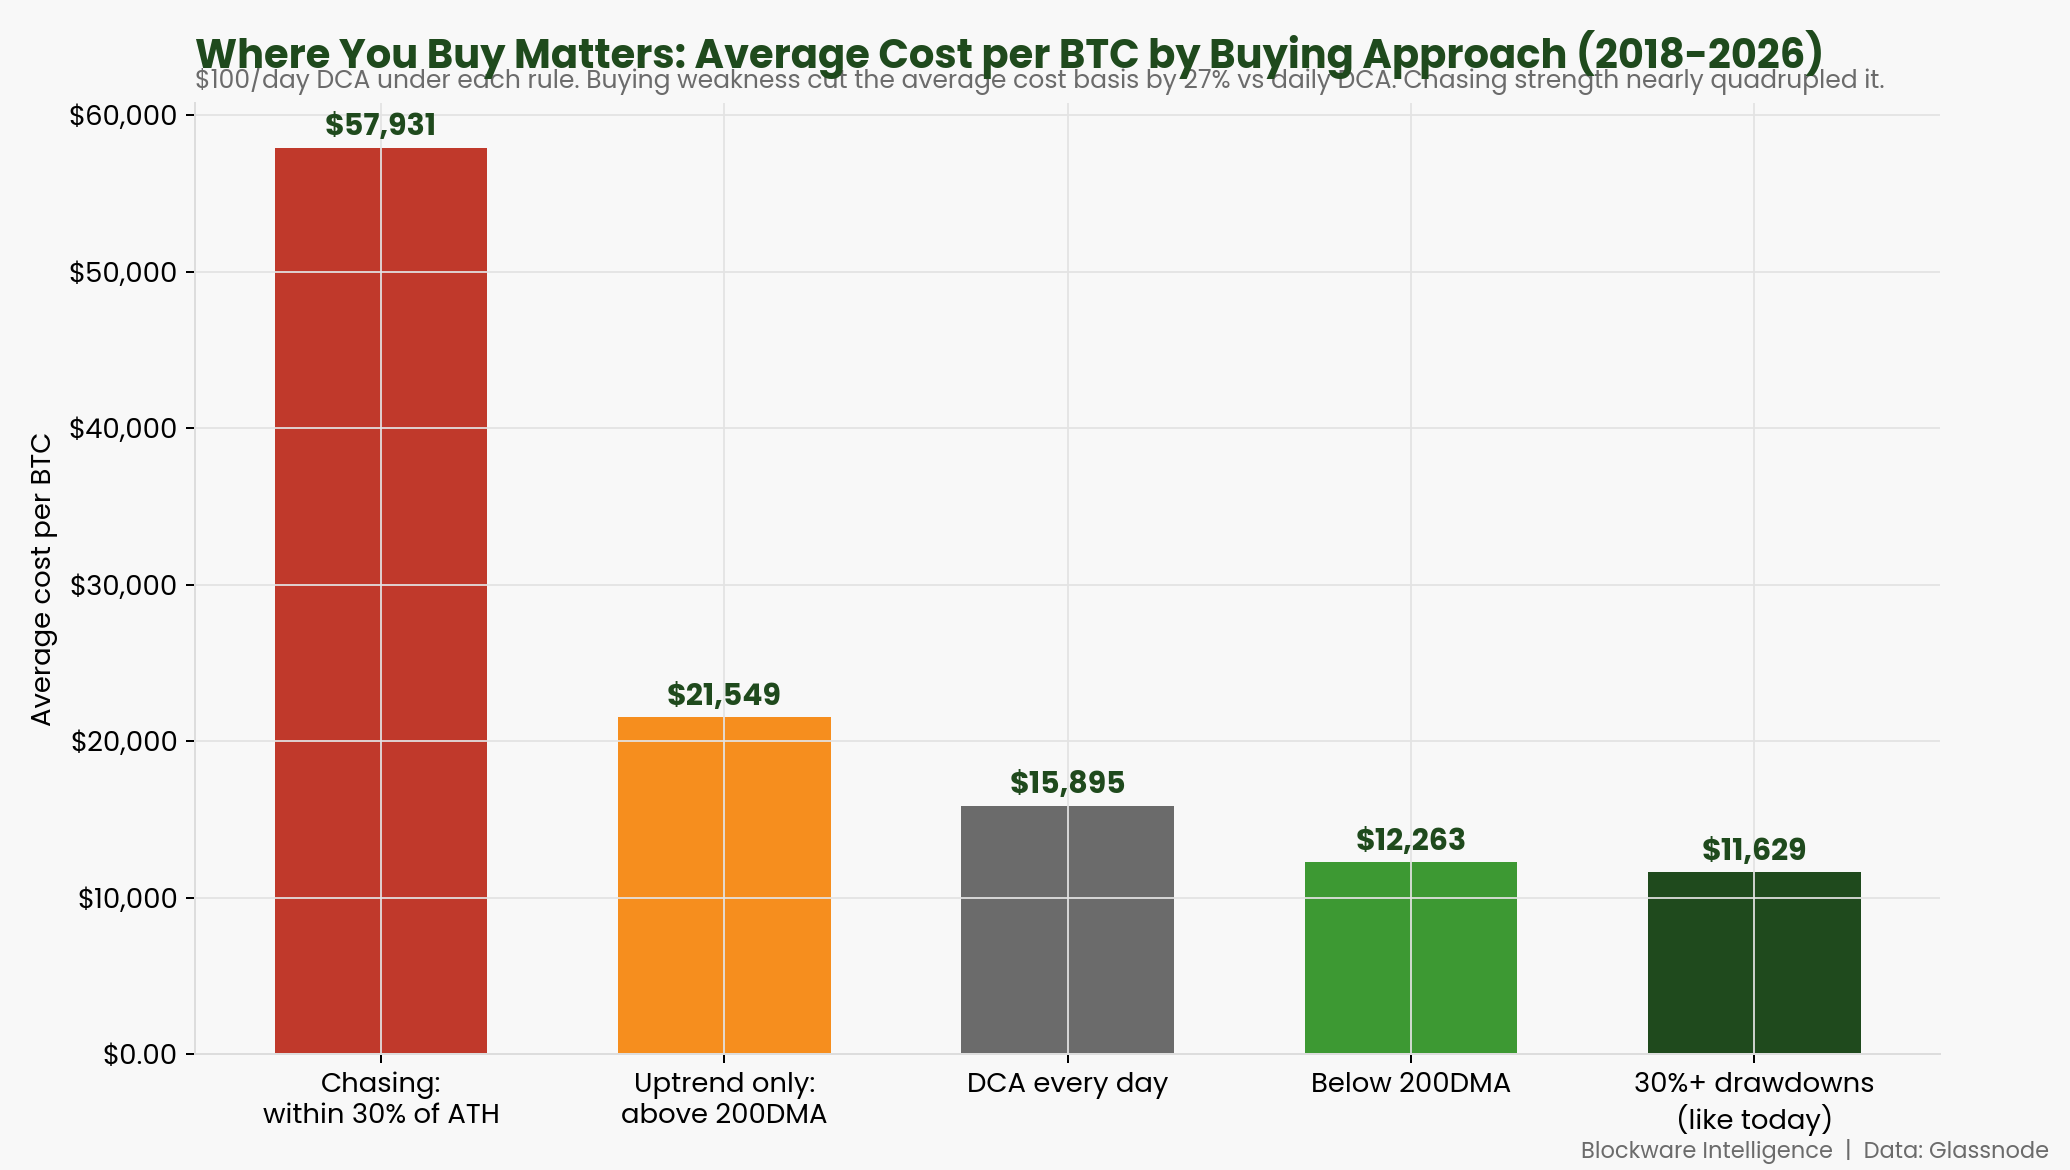
This compares the average cost per coin under different dollar cost averaging rules since 2018, each buying $100 a day when its condition was met. Buying only during 30% or deeper drawdowns, the condition we are in today, produced the lowest average cost at $11,629. Chasing price near all-time highs produced the worst at $57,931. Buying weakness consistently beat buying strength by a wide margin.
The Deeper The Drawdown, The More Reliable The Return
This buckets every day from 2015 to 2025 by the market condition at purchase and shows the median twelve-month forward return. Buying during a 50% drawdown produced a positive result 93% of the time, against 75% for buying near the highs. The deeper the drawdown at purchase, the more dependable the outcome became. Bitcoin is 49% below its all-time high right now.
To Recap:
By multiple independent measures, price against the 200-week average, the cost basis of recent buyers, realized capital destruction, and holder behavior, this is one of the more compelling accumulation setups Bitcoin has ever offered.
None of these signals can call the exact low, and two of the past episodes ran for more than a year before turning. Anyone promising a precise bottom is guessing.
That uncertainty is the argument for dollar cost averaging rather than against it. Bitcoin’s largest single-day moves cluster inside drawdowns like this one, and missing them wrecks long-term returns. The dependable way to capture them is to keep buying through the discomfort, which means being in the market when it is cheap, as it is right now.