Blockware Intelligence Newsletter: Week 4
Accumulation, Accumulation, Accumulation...
Dear readers,
Hope all is well, and you had a great week. Let’s dive into some trends from this week. Don’t forget, we have now added a section after the usual on-chain section covering Bitcoin related equities.
Key takeaways:
- On-chain supply dynamics are at levels that previously priced BTC at $58K-$59K
- Macro “supply shock” metrics all look strong with confluence
- Exchanges down 17,104 BTC this week, 125,501 BTC in the last 30 days
- Long-term holders continue to sit tight, not taking exit liquidity on this price rally
- Bitcoin consolidating between $50K and 200DMA, also at the edge of an on-chain volume cluster
- 5 days into a volatility squeeze that will likely resolve in the next week
- Market sustaining a state of profitability
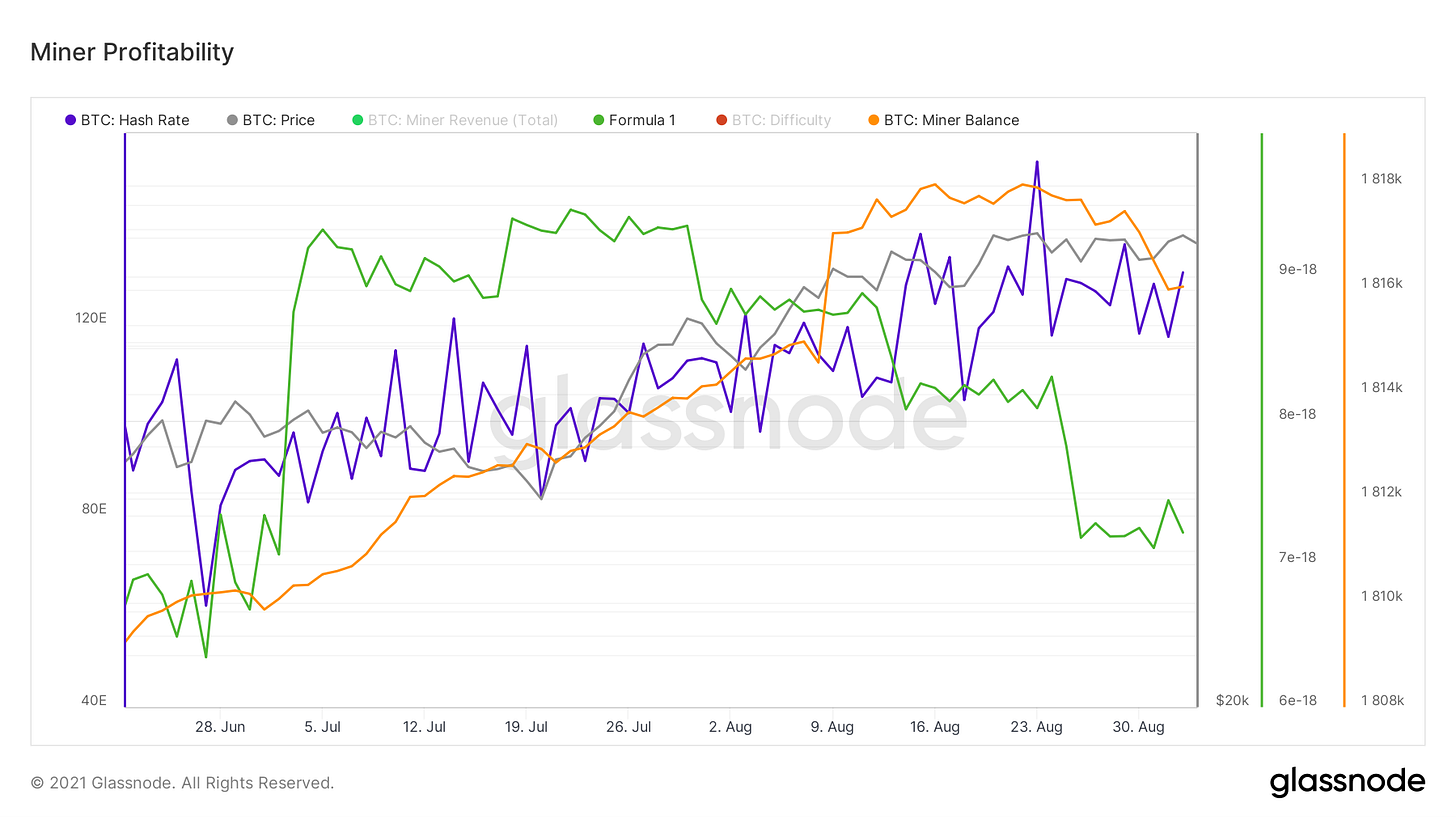
- Hash continues to come back on the network, Hash ribbons buy signal has flashed, profitability slightly dropping after difficulty adjustment, miner balances down 1,658 BTC in the last 10 days
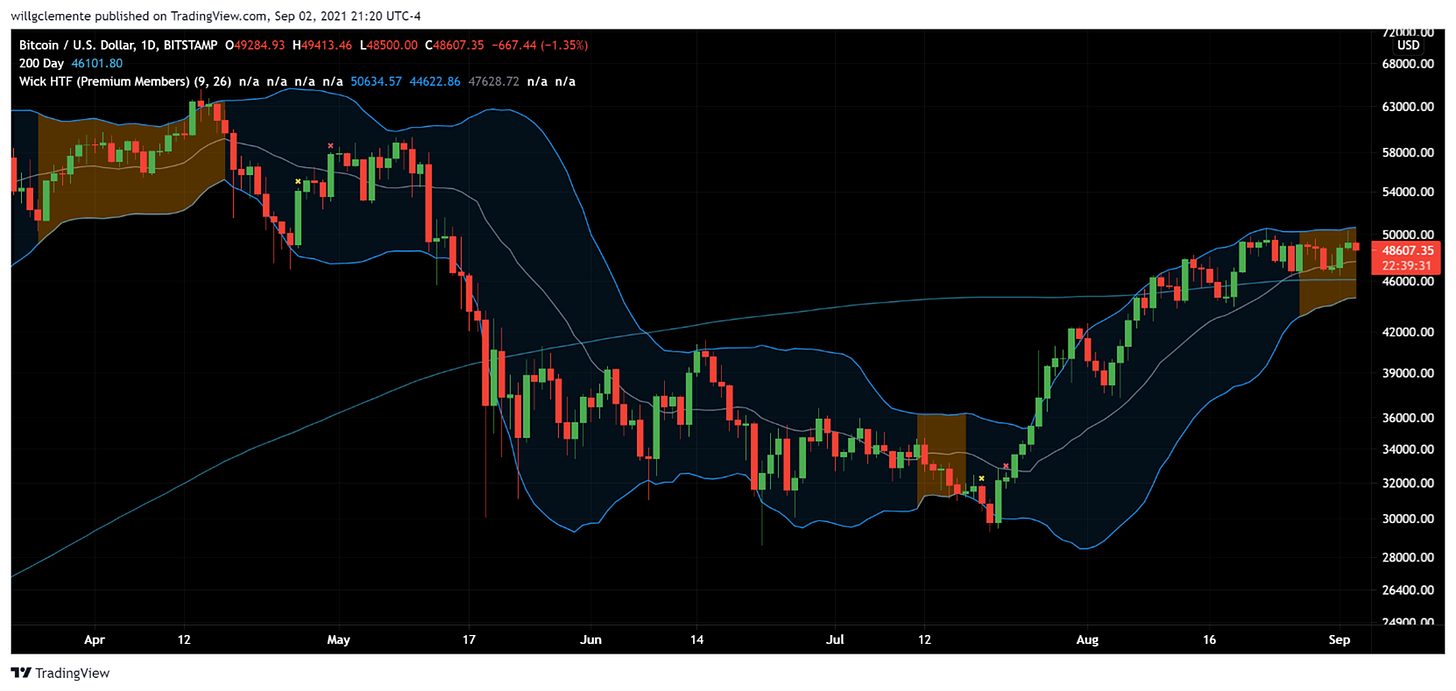
Bitcoin continues to consolidate between the 200-day moving average and key technical/psychological level of $50K. Also, from a technical perspective, we hav entered a volatility squeeze highlighted by the Wick HTF indicator. This means a big move is coming, but what direction will the squeeze resolve? For that I think on-chain can provide some clues.
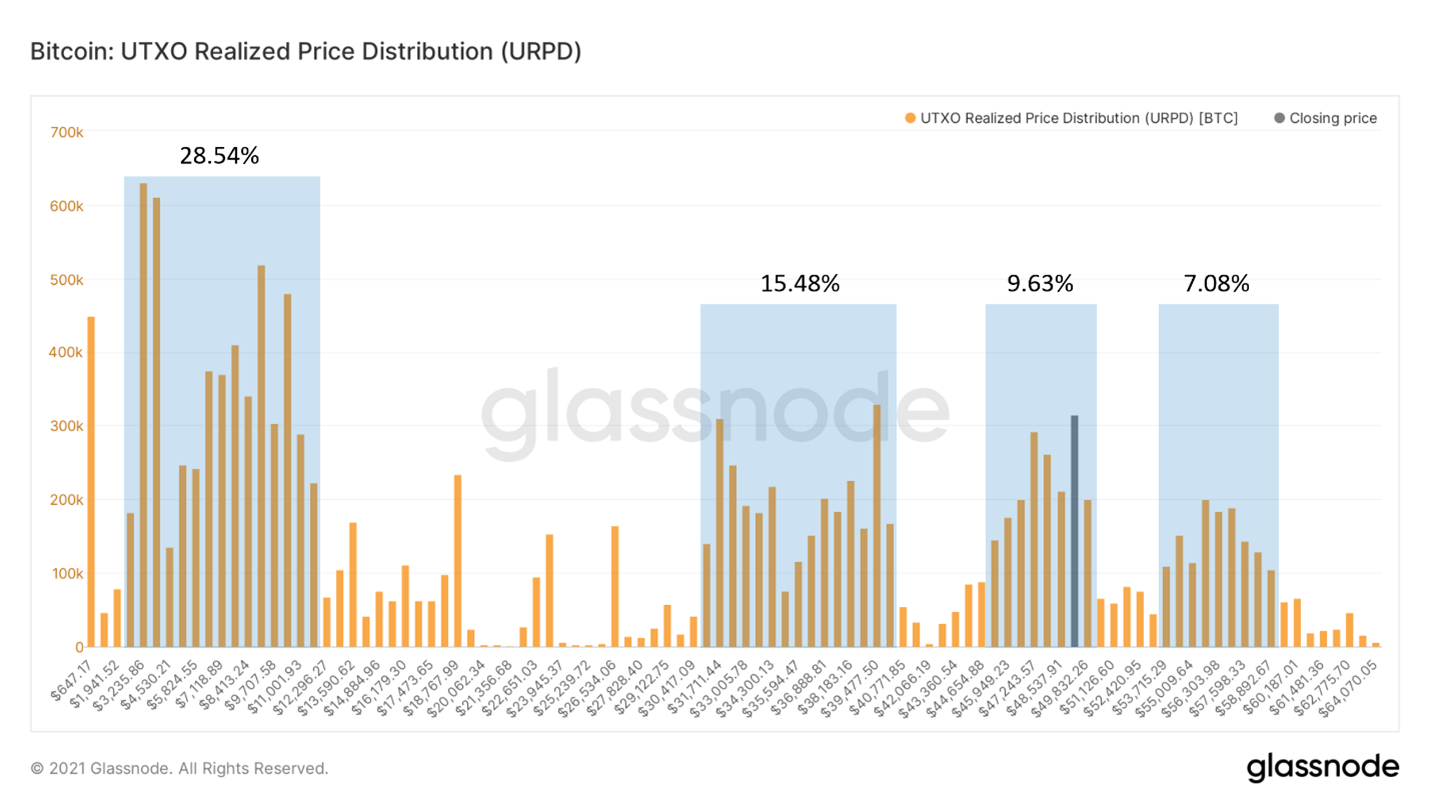
We now have three distinct clusters of on-chain volume, representing key levels of capital inflows to the market. 15.48% of Bitcoin’s money supply moved between $32K-$40K, 9.63% has moved in this mini range between $46K-$50K, and 7.08% moved between $54K-$60K. If Bitcoin can confidently break above $50K, in terms of on-chain volume it’s pretty much air between that level and $54K.
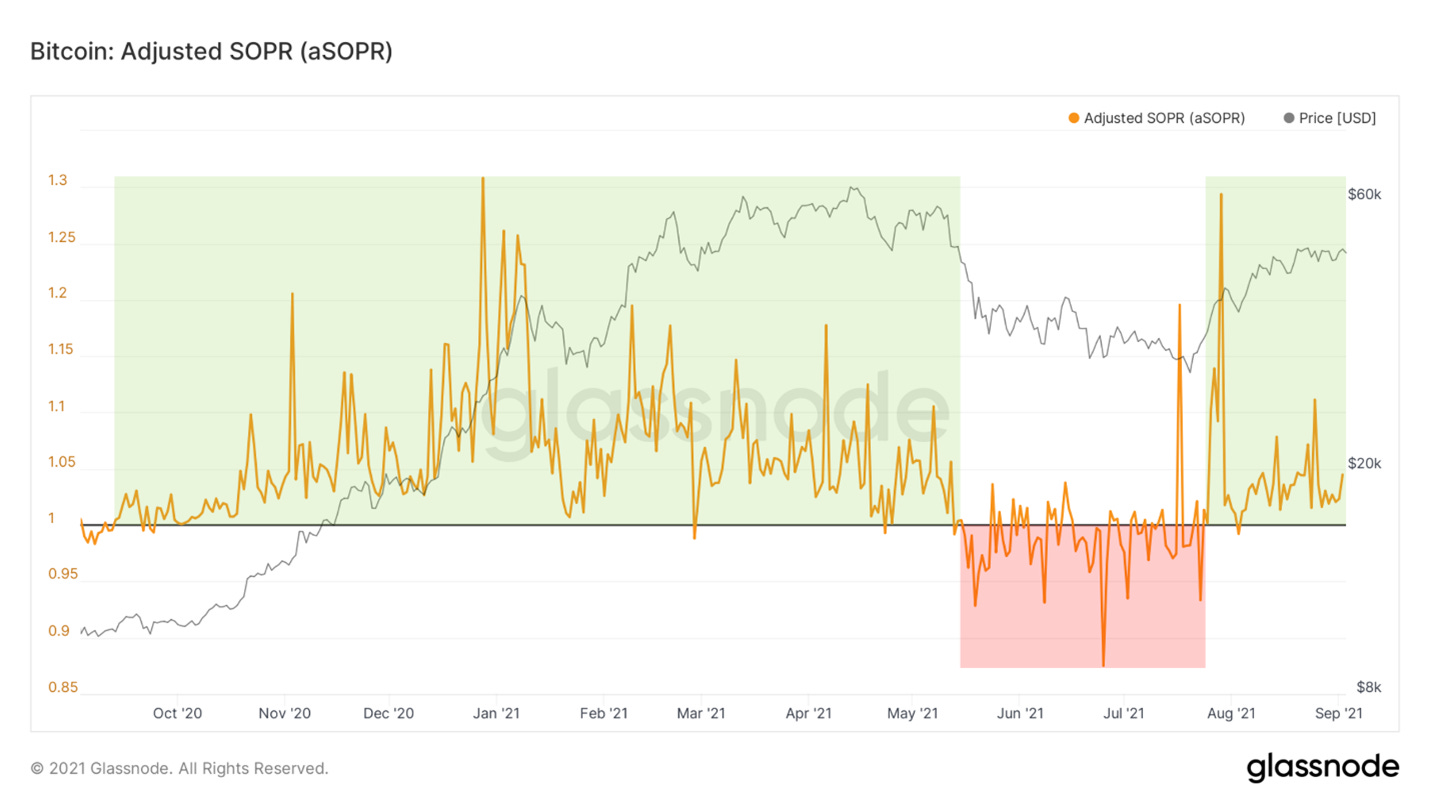
As a way to gauge the state of profitability the market is currently in, we come to our SOPR metric. SOPR has printed a textbook bullish reversal pattern; retesting 1 as support and stabilizing above one. This confirms that the broader state of the market is in an uptrend from an on-chain perspective. Note: It’s been a month since a reset to 1, so wouldn’t be surprised to see a reset sometime soon, although in late last year we went months without a reset.
Next, we come to our accumulation metrics. Currently Bitcoin supply dynamics look very strong, for reasons you’ll see below.
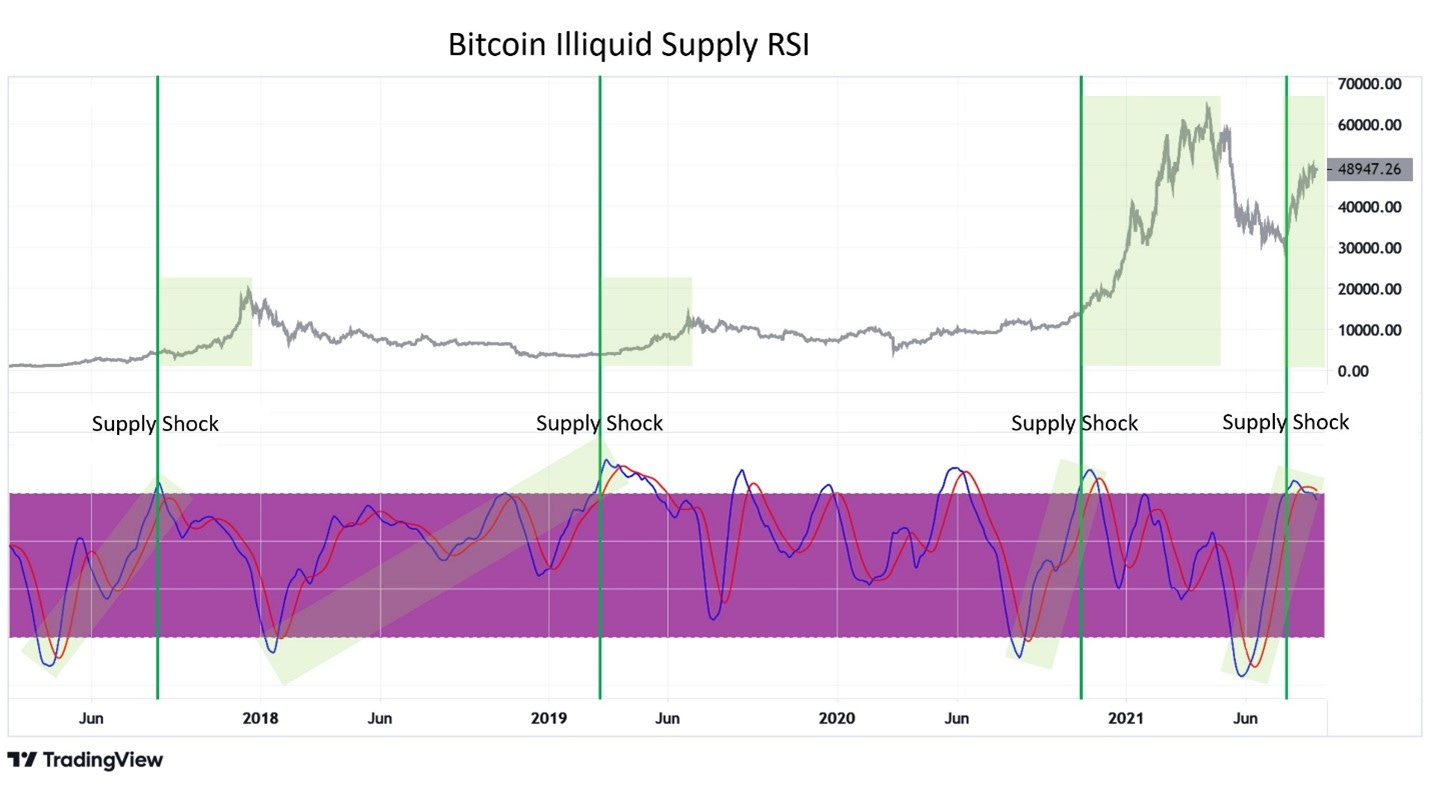
First up we have illiquid supply RSI, something I created a few months back. This tracks the broader trend of “supply shock” in the market, using a 365 stoch RSI on the illiquid supply change metric, which tracks the 30-day change of illiquid supply. When the oscillator goes from a full reset to above the range, I consider it a buy signal or the initiation of an underlying supply shock on the market. With illiquid supply only rising, it appears the full effects of this current supply shock are just getting started.
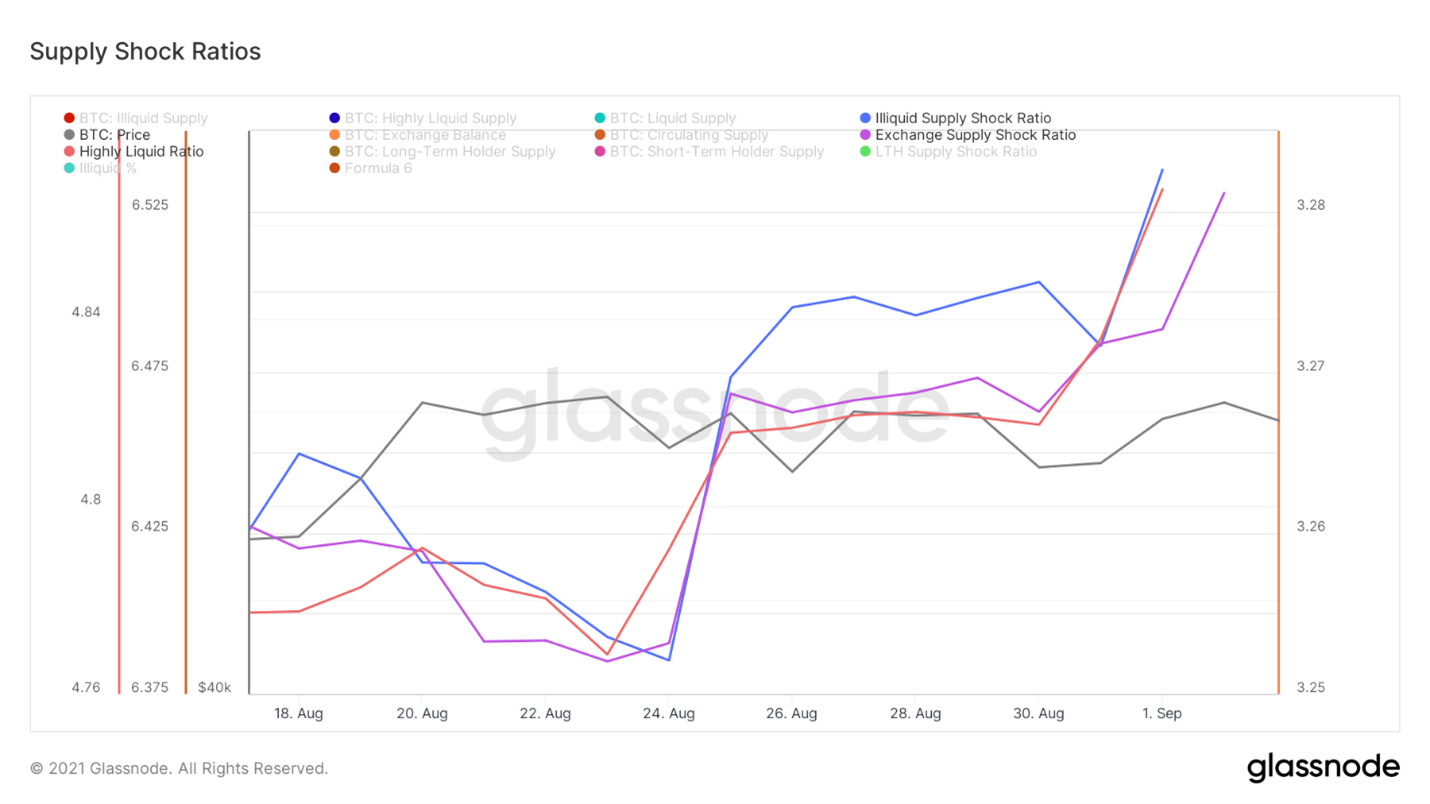
Next up we have our supply shock ratios: illiquid supply shock ratio, tracking the movement of coins from speculators to strong hands, highly liquid ratio, which tracks the movement of coins from highly liquid entities to liquid entities, and exchange supply shock ratio, essentially a comparison of the number of available coins to buy on exchanges relative to overall circulating supply. I posted about this impulse Tuesday on my Twitter that would likely push us up to $50K. Since then we have reached $50K, but all 3 metrics continue to push higher. Expecting continued upside.
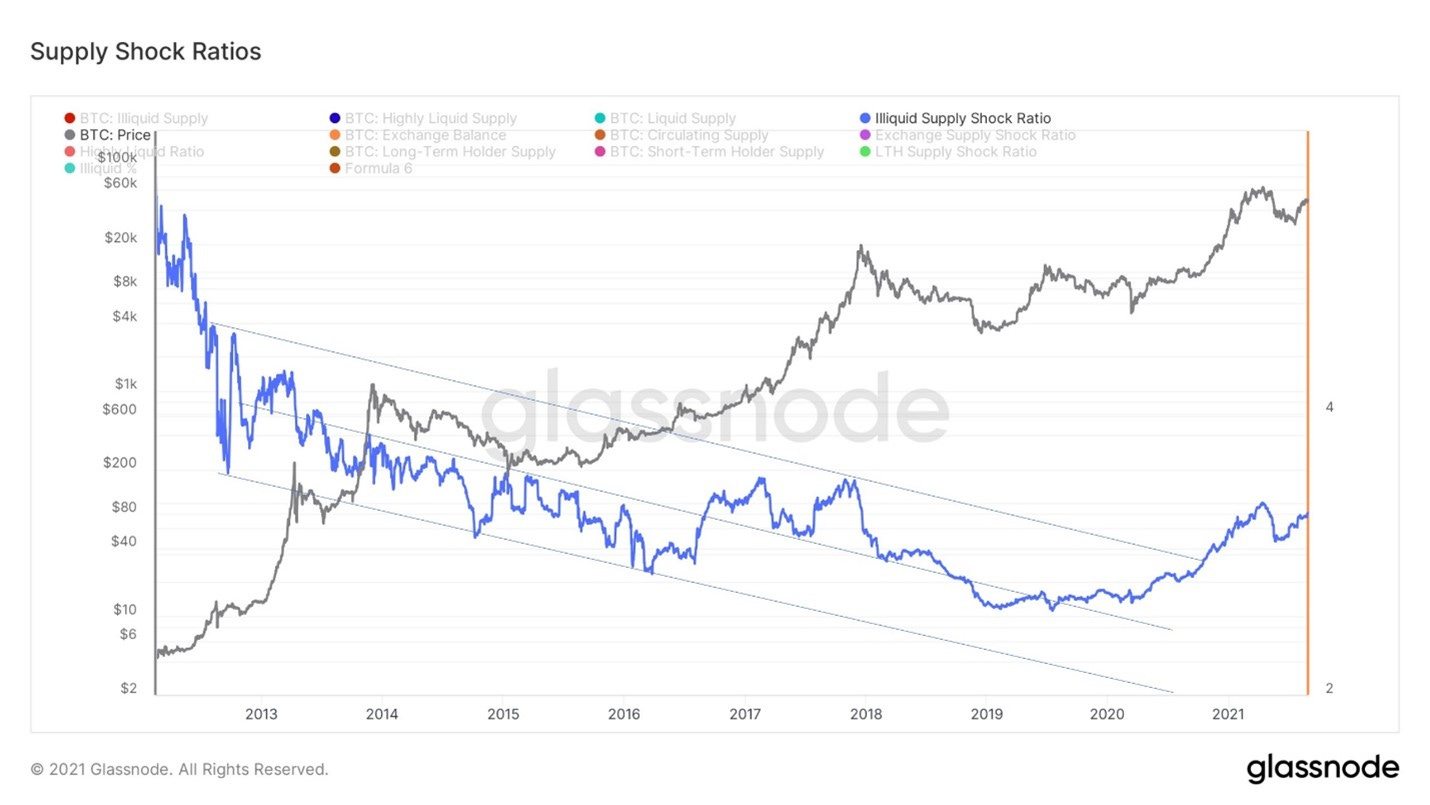
From a macro perspective, illiquid supply has clearly broken out of it’s historical pattern, showing levels of accumulation unseen before. If there was any chart that I personally would use to make a claim that “this time is different” it would be this. After covid of last year, in aggregate market participants are HODLing their coins stronger than ever before.
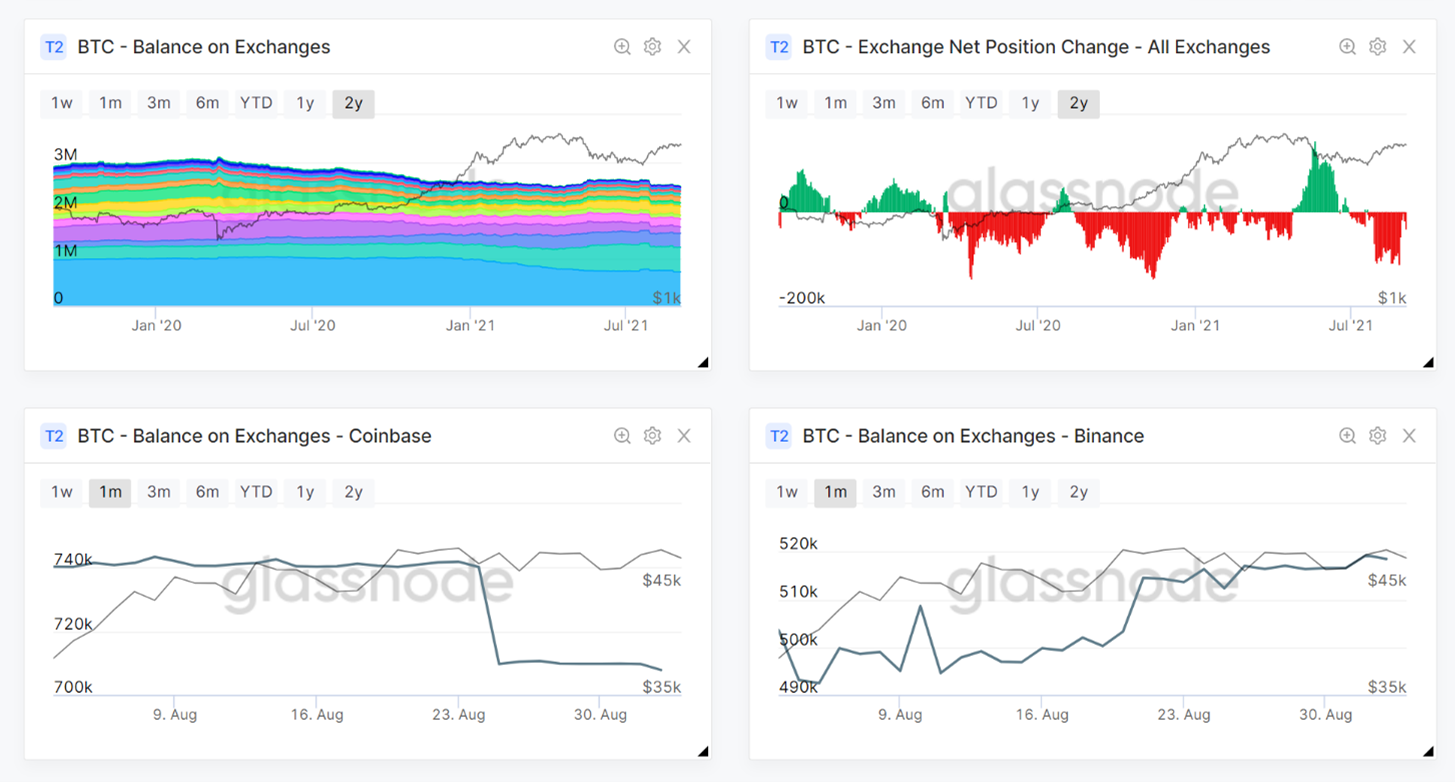
Going a step further on exchange flows, here are the four main charts I have been watching to track these flows. As you can see in the top left, overall exchange balances are declining again this week, down 17,104 BTC in the last week, 124,501 BTC in the last month. The broader trend of these flows continues to be in accumulation, shown by exchange net position change in the top right. Lastly, comparing which major exchanges are driving these flows we see an interesting dynamic. Coins seem to be moving off Coinbase but moving onto Binance. Perhaps this is a reflection of selling in the east and buying in the west, but could also just represent demand for the speculative products that Binance provides access to.
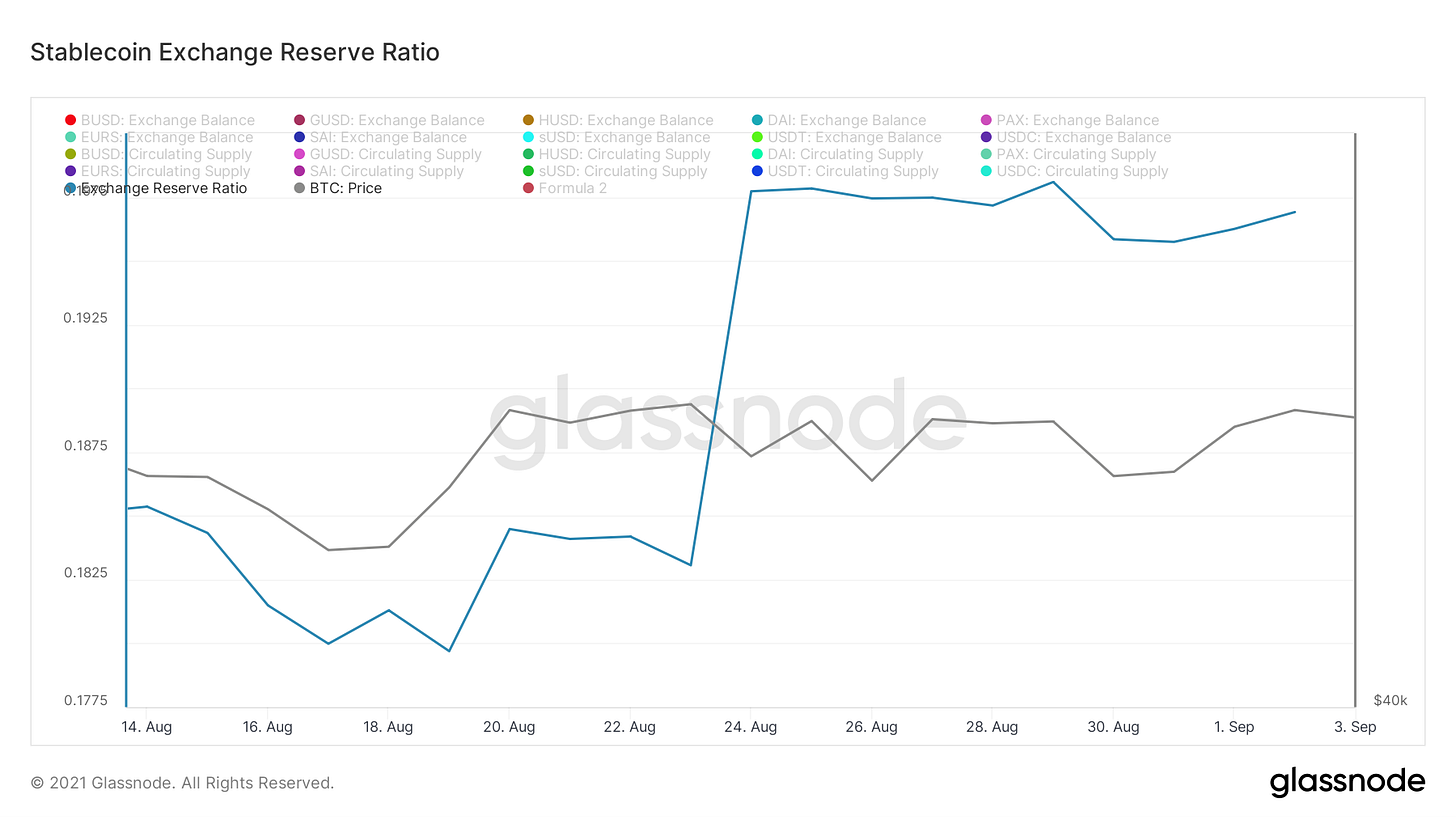
Here we have another metric I created a few weeks back, the stablecoin reserve ratio. This represents the amount of stablecoin supply that is on exchanges. Combined with exchange flows for BTC, what we see is stablecoins moving onto exchanges, BTC moving off exchanges.
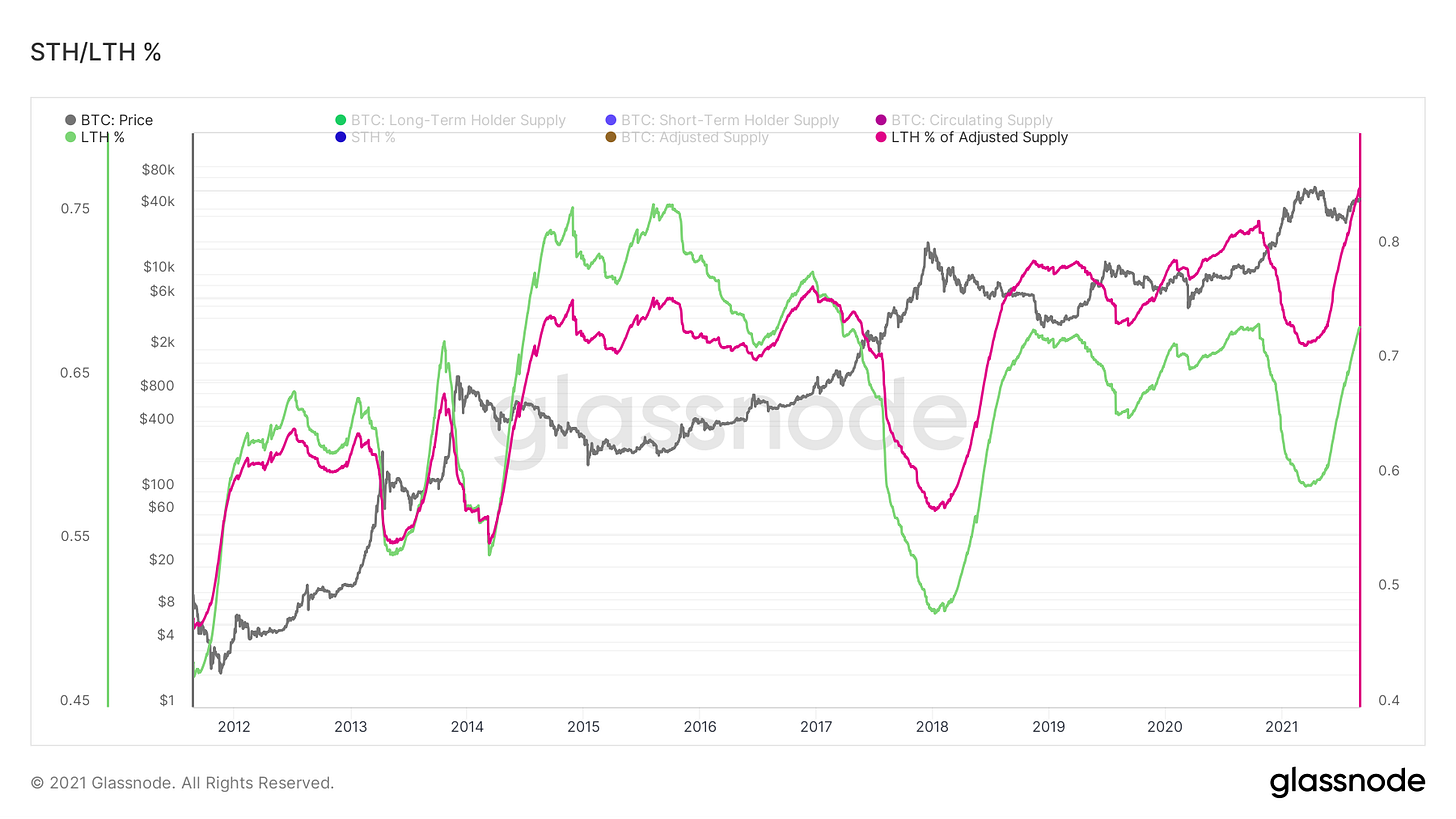
Last note on accumulation, long term holders are still showing no sign of letting up. They continue to reach new all-time highs of BTC in their holdings. When comparing their holdings to adjusted supply, which filters out lost coins (defined as UTXOs not moved in at least 7 years), long term holders now posses 85.2% of supply. 68.1% when using circulating supply.
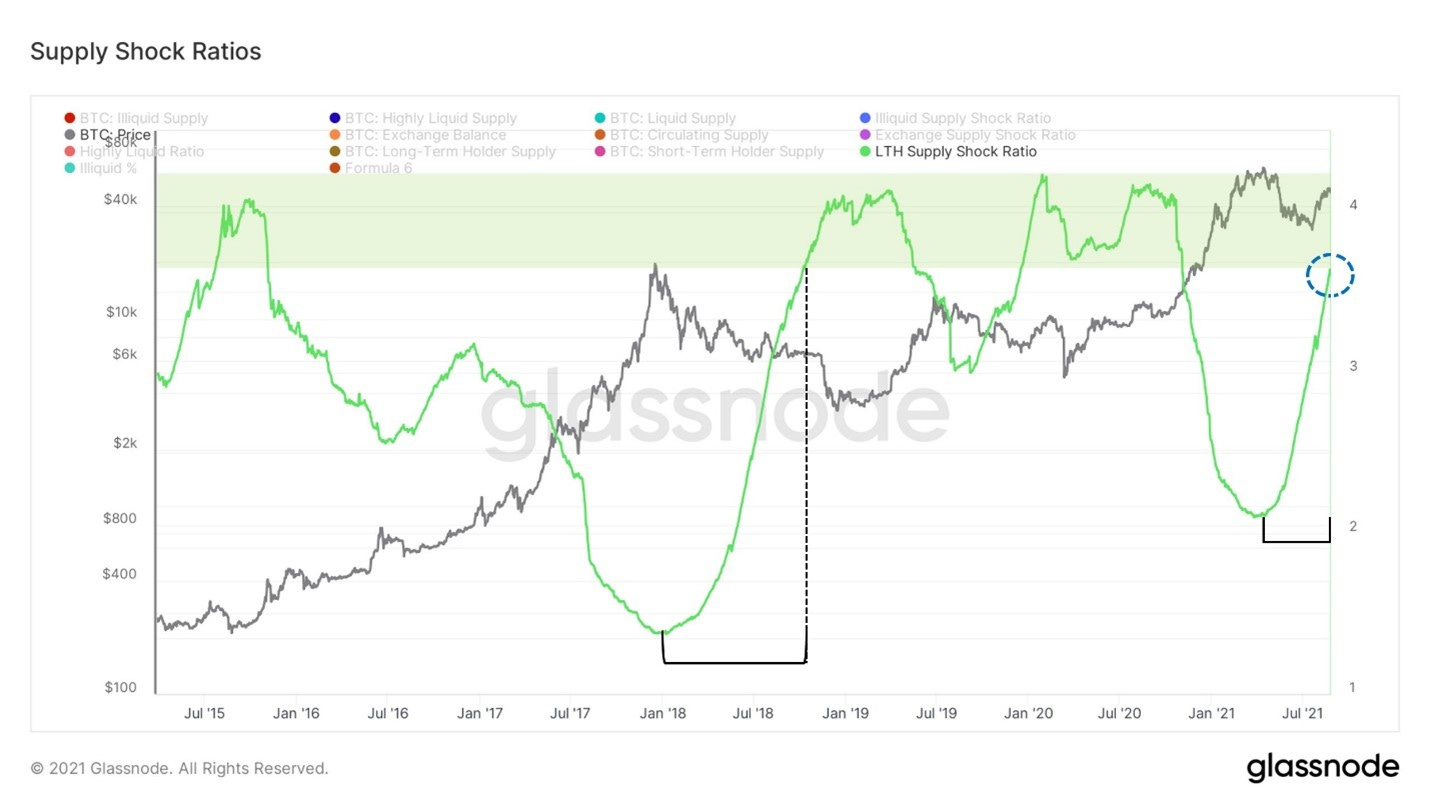
Comparing long-term holder supply to short-term holder supply we get the long term holder supply shock ratio. From a macro perspective we are currently approaching a zone that has previously caused major supply shock in the market. Note how much quicker the rate of recovery is compared to 2017 in addition to the higher base the metric grew off. Long term investors are holding strong.
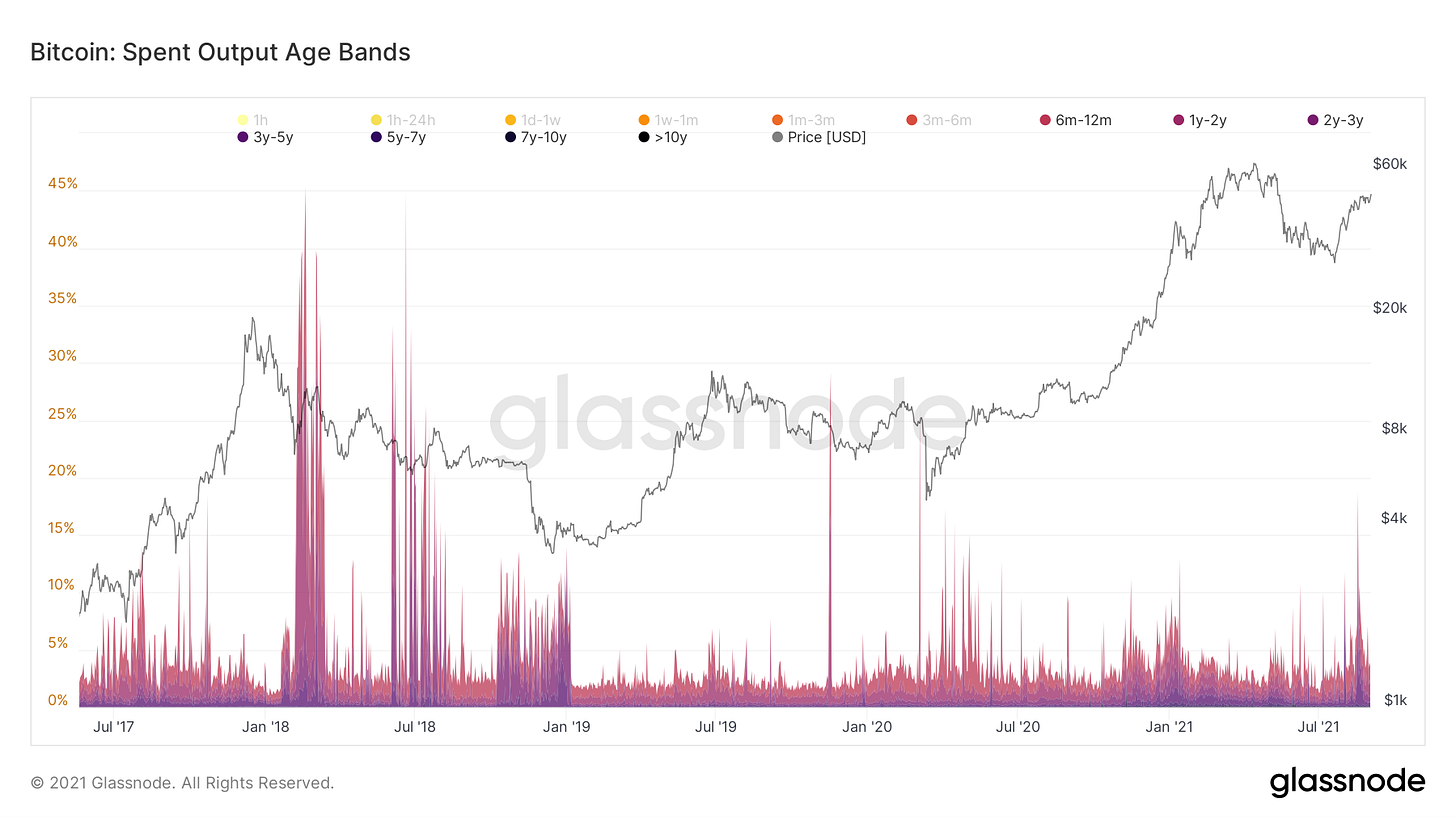
On a similar note, one of the things we have been keeping an eye on for weeks has been, “are these long-term holders beginning to take exit liquidity?” The answer is no. Aside from a one-off spike two weeks ago, these LTHs are sitting tight, not even remotely resembling behavior during the dead cat bounce post 2017.
Hash continues to slowly claw it’s way back onto the network, still far from peak levels. As it does so, revenue per hash is dropping. This decreased profitability in combination with higher prices may explain why miner balances have decreased by 1,658 BTC. This selling pressure is frankly irrelevant in regards to effecting price, but is interesting to track their movements nonetheless.
Bitcoin Equities (written by Blake Davis):
So far another pretty good week in the world of crypto-exposed equities as of writing at Thursday’s close. With coins starting to move out of periods of consolidation, led by Ethereum, a lot of crypto-stocks are really starting to shape up. Thursday was a day of reversal and down moves for a lot of these names. Even if they were up on the day, many closed at a poor spot in their daily range. This raises some flags for the next few sessions. That being said, the underlying coins are still moving up so I’d imagine a pullback should get bought up pretty fast.
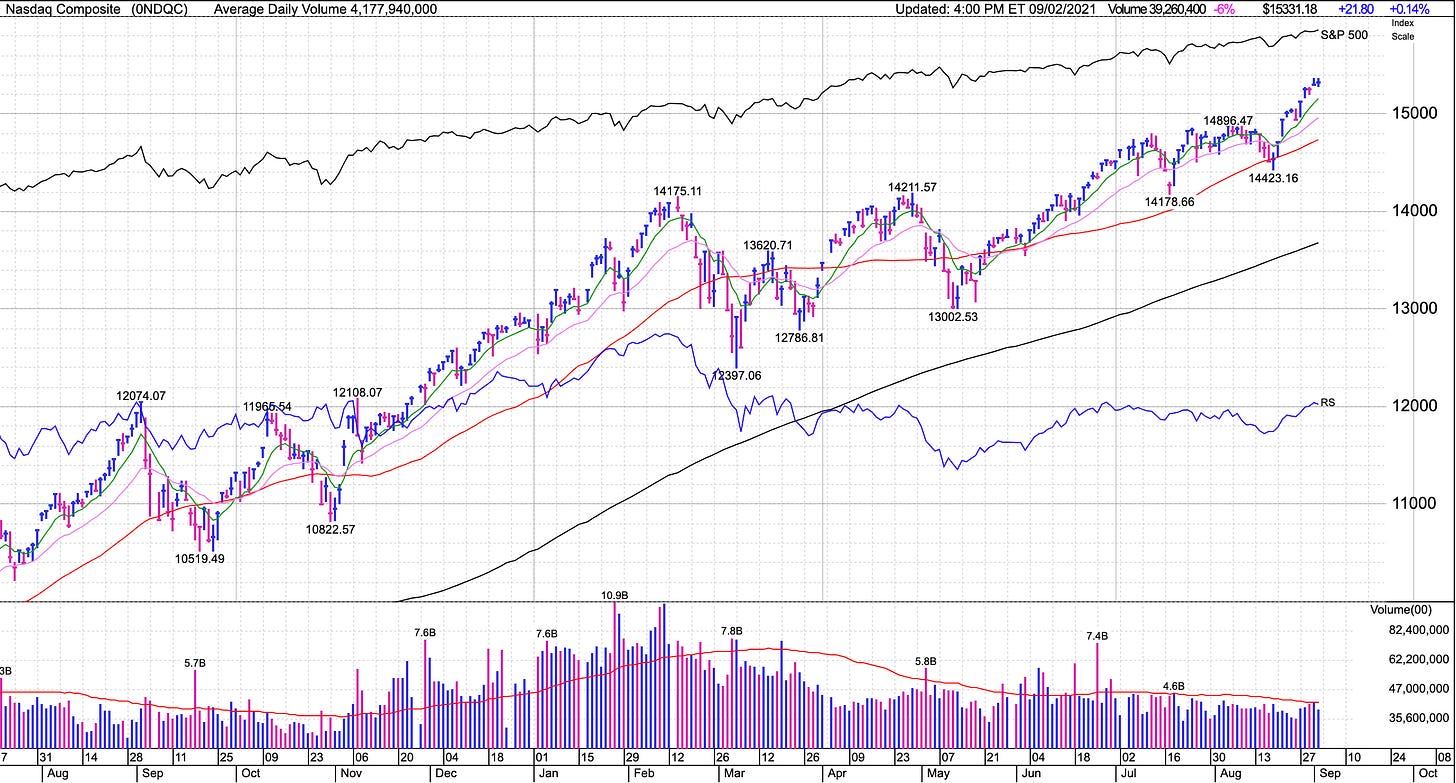
Big crypto moves, combined with a massive week in the market indexes, led to a lot of firepower behind some of the names we discussed last week. But it should be pointed out the level of extension we’re seeing in the Nasdaq and S&P 500. The Nasdaq is 4.0% over its 50day simple moving average (red line below), nearing levels of extension where it previously corrected or pulled back. My personal opinion is that any type of pullback should be bought up pretty fast but risk management is key. You need to have stop losses or alerts placed so that you know when it is time to scale back on exposure and protect your account. The best offense is a great defense.
There hasn’t been a lot of volume behind the recent moves in crypto stocks with many name’s volume bars coming in right at or below their 50 day averages. But the last couple months a lot of names, crypto-related or not, have had low volume increases in price. Generally, this would be a sign to buy with extra caution, but the summer months of June, July and August have historically low volume. This is why price is the number one indicator we focus on, volume doesn’t make us money, only price pays. Volume often pours in after the stock has made its initial move. Of course, for a sustained rally, volume needs to enter the market to validate the signs of institutional buying. As we near Q4, a historically good quarter for equities, we should see some big volume start moving in tech. The seasonality of this Bitcoin breakout makes me extra bullish for this current crypto bull market and the related stocks.
For this week, I’ve compiled a focus list of crypto-exposed names that I think are the strongest. There’s a ton of different ways to spot relative strength, my pinned tweet discusses a few if you’re interested in training your eye. These names are showing price action that is outperforming the general market and other stocks in their sector. Most of these names aren’t actionable at their current levels and are on watch for a pullback or consolidation of some kind. The next couple weeks could present some nice buying opportunities if this is the case.
Crypto-equity focus list ranked by strength:
MARA - Watching for potential resistance around $45 and to keep riding the 10EMA. On watch for a pullback.
HUT - Price action leader but lower liquidity so its at #2. There was a potential resistance around $9-$10 I had been watching, it formed a downside reversal from this area Thursday so it is also on pullback watch.
SI - Watching for a potential buy point though top of Darvas box at $118.72. Had a strong day Thursday despite the other crypto-stocks underperforming.
COIN - Would like to see it hold $267.75. Watch for resistance at down trend line across the tops of 5/12 and 8/11. On watch to pullback to at least the 10EMA after a big gap up Thursday was sold on pretty high volume.
MSTR - Early entry through $748 but true actionable area would be through $798. Also tried to gap-and-go Thursday and was sold.
BLOK - Near actionable area as of Thursday, would like to see this one catch some legs. Not a lot of power Thursday despite being in a nice area.


thanks... perfect analysis
Thanks Will 👍🏻