Blockware Intelligence Newsletter: Week 31
Bitcoin on-chain analysis, mining analysis, equity-analysis; overview of 3/18/22-3/25/22
Blockware Intelligence Sponsors
If your company is interested in sponsoring Blockware Intelligence, please email sponsor@blockwaresolutions.com.
FTX US - Buy Bitcoin and crypto with zero fees on FTX. Use our referral code (blockware) and get a free coin when you trade $10 worth.
Blockware Solutions (Mining) - It is difficult to buy ASICs, build large mining facilities, and source cheap scalable electricity all on your own. Work with a trusted partner like Blockware to deploy capital into Bitcoin mining.
Blockware Solutions (Staking) - Ethereum 2.0 is almost here, now is the time to stake your ETH with Blockware Solutions Staking as a Service to take advantage of 10-15% APR when the Ethereum network switches over to Proof of Stake
Webull - Trade crypto-equities. Open an account and make your first deposit by March 31st and get three free stocks, each valued between $7-$3,000.
Summary
A follow-through day occurred last Friday signaling a new uptrend in the stock market.
Stocks are on the rise but now extended from areas of support.
Major resistance for BTC remains 46k-47k
Open interest build up over the last 24 hours
Spot premium over perps continues
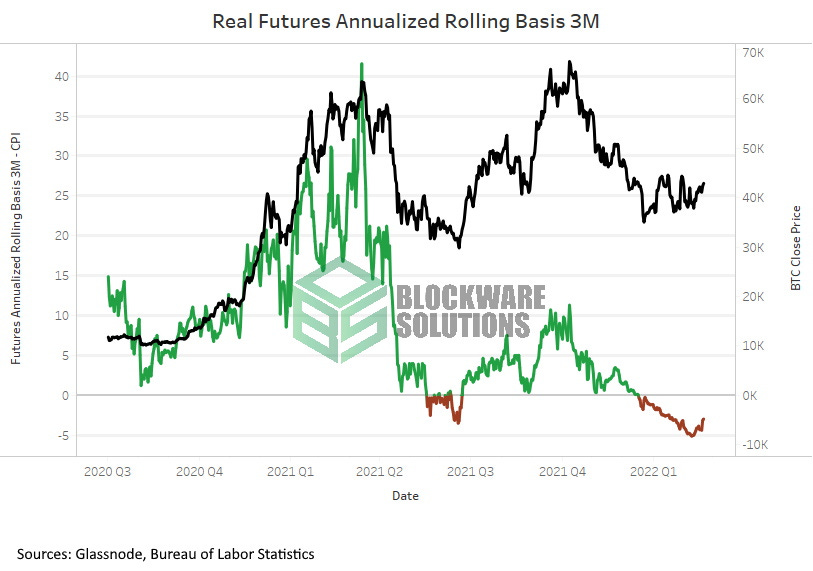
3M spot/futures basis is in backwardation in real terms
On-chain accumulation continues
US trading hours increasingly trading at a premium
Exxon ($XOM) is mining Bitcoin.
Blockware Solutions is mining Bitcoin in Kentucky. - Reuters (pictures below)
General Market Update
It’s been quite the strong week for equities, especially those who have been the most beat up for the last few months.
Many O’Neil style investors use the concept of a follow-through day (FTD) to mark the beginning of a new uptrend while in a bear market. One week ago on Friday, the market signaled the emergence of a new uptrend on the Nasdaq.
As you can see above, a FTD is signaled by a day where any index’s price is up greater than 1.5% on volume larger than the previous day. A FTD can occur at the very least on day 4 following the index bottoming.
Friday’s price action gave us the 3rd FTD signal since this bear market began in November. As we’ve seen, FTD’s do occasionally fail, signaled by a new low on the index. But so far, this one appears much stronger than the previous two.
As you may have seen online, the current move in the major indexes is nearly unprecedented. Specifically, the S&P has closed up >1% for 6 of the last 8 trading sessions. This has only happened twice before in the last 80 years.
The first was October 1974 when the S&P went on to return 31% in the next year. The second time was in November 2020 when the S&P returned 35% in the year following.
Now does this mean that the S&P is likely to return 30+% over the next 365 days? I would say no, it’s unlikely. The difference between 1974, 2020 and 2022 is the larger macroeconomic environment and the attitude of the federal reserve.
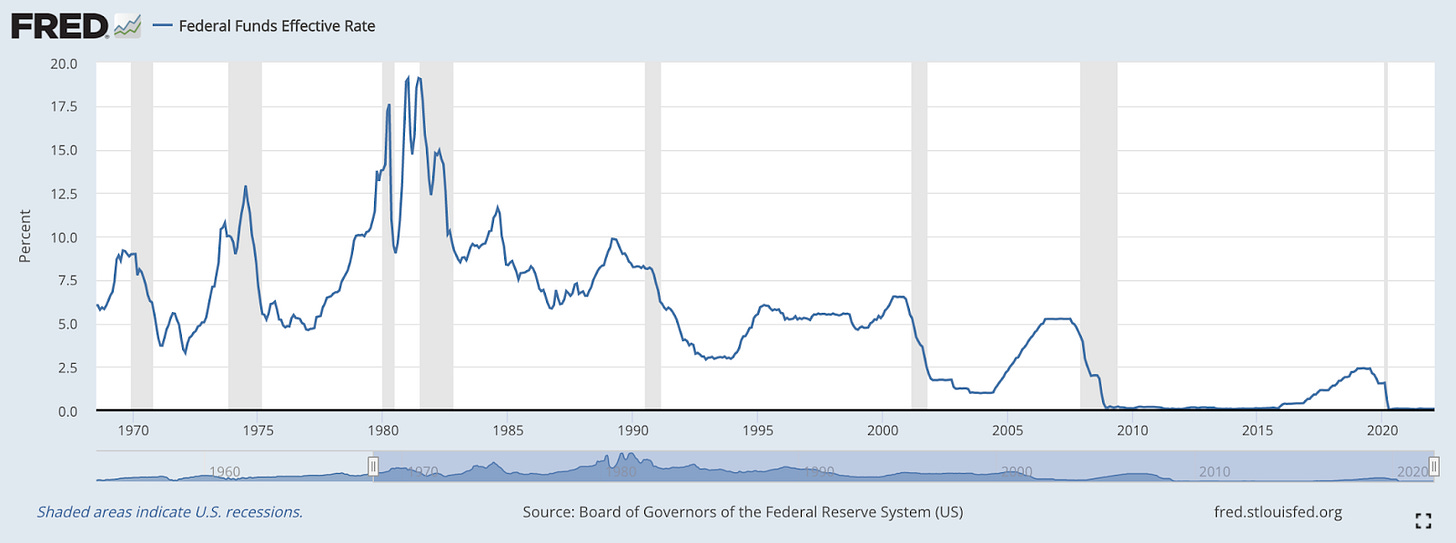
Inflation is obviously on the rise in 2022 with the federal funds rate at its lower boundary of 0 while needing to create a lower low, as it has over the last 40 years or so. This puts the Fed between a rock and a hard place as they need to raise interest rates to fight inflation but are struggling to do so without causing institutions to liquidate equity and bond positions.
The bond market has already begun pricing inflation for quite some time now, signaled by rising yields despite the fed funds rate only up 25 basis points.
US10Y (yellow), S&P (blue), BTC (pink) and Fed Funds Rt (red) from Bloomberg
Clearly, interest rates (fed funds rate) have a massive impact on the markets. Rising rates cause your cost of capital to rise, meaning it’s more expensive to borrow money.
More interest on loans means that Americans have less money to spend on consumption. Also, companies will have less cash on hand to invest into growing their business. These all lead towards decreased institutional and retail demand for stocks.
But as we’ve seen, since the Fed announced the first rate hike we’re seeing risk assets perform well again. In order to gauge the health of a market rally, there are a few key things we must keep our eyes on. The leading stocks, market breadth and market sentiment are a good starting place.
First, and most important, is the price action of leading stocks in the market. These are the names who will fuel a move higher for the market as institutional demand and higher prices inevitably draws in more buyers to the market.
Some of the leading stocks at the moment are AA, NUE, GFS, NTR, RMBS and ACLS. These stocks are now quite extended from support areas so a pullback next week shouldn’t come as much of a shock.
We can also look at the highest weighted names in the major indexes to give us an idea of what the indexes may do next. The mega cap tech names who make up the majority of the S&P and Nasdaq’s market cap are AAPL, AMZN, MSFT, GOOGL, FB and TSLA.
The moves most of these names are making explains why the S&P and Nasdaq have performed so well as of recent.
This is a significantly big move, even for a tech stock like AAPL. Since it bottomed on March 14, AAPL has been green every day for 9 sessions in a row. Increasing its stock price by 16% and expanding their market cap by $391 billion.
Market breadth is also important to keep an eye on. Breadth is simply how many names are participating in a market move, so strong breadth is important for a sustainable rally. There are several indicators and oscillators that can help us understand how healthy the breadth of the market is.
My personal favorite breadth indicator is the advance/decline line I discussed last week.
Nasdaq with Advance/Decline Line (Marketsmith)
Above we can see that the A/D line’s trend has begun to change over the last couple weeks. This week the line has grown stagnant, moving sideways instead of higher alongside price.
This could mean a few things but most likely it’s a signal that individual stocks are getting tired in this current rally. It doesn’t mean the world is ending, just that these extended names are likely going to pull back into shorter-term moving averages or begin moving sideways to digest their gains.
Market sentiment is also important to keep an eye on. Sentiment is an indication of the emotions that the majority of market participants are feeling at the time. As with breadth, there are many indicators that can speak about sentiment to us.
The two sentiment indicators that I use most often are the VIX and put/call ratio. The VIX is the S&P’s volatility index meaning that when the S&P’s price is increasingly volatile, the VIX is rising. Essentially, the VIX is a measure of fear in the market. `
The VIX went from a few weeks ago looking like it wanted to scream higher to completely falling off a cliff now that more market participants have begun buying again. Therefore the VIX is signaling to us that fear is quickly leaving the market as price rises.
Less fear is a good thing but this pace of fear leaving means that a shakeout is quite likely. As we’ve seen this year, the market doesn’t like to give us easy gains, those who are late to the party are likely to be punished for it.
I also keep an eye on the CBOE equity-only put/call ratio. This also is a measure of sentiment because it informs us of the overall direction of derivatives trades on stocks.
CBOE Equity Put/Call Ratio (Ycharts)
Similar to the VIX, the put/call ratio has fallen significantly over the last couple of weeks. This would also signal that sentiment is growing more bullish.
Once again, this is a fairly good thing except for the fact that sentiment was never really that bearish at the current bottom. People were fairly fearful but we never saw the panic that is ideal for a true market bottom.
That would tell me that we’re likely not totally out of the water yet, but who knows. This is exactly why we follow price above all else.
Crypto-Exposed Equities
Crypto-exposed equities have also had a strong week with several names crossing over resistance to begin building out what appears to be a lot of double bottom bases.
The current combo of strength in both Bitcoin and the Nasdaq is a good sign for crypto-equities and has allowed a few names to stand out from the pack.
Some of the price action leaders in the space are CLSK, RIOT, SI and MSTR.
Now that it’s been almost 2 months, a lot of the crazy price action that surrounds a fresh listing has died down for WGMI, Valkyrie's Bitcoin Mining ETF.
As seen above, WGMI has roughly followed the price action of BTC with an even larger degree of volatility. Since WGMI’s listing on March 8th, it’s just broken above the listing day’s closing price.
In the same period that WGMI is up 0.59%, Bitcoin is down -0.17% and the S&P is down a whopping -0.03%. This WGMI outperformance is interesting, but not super significant as it’s less than 1%.
Another interesting thing we can track for crypto-exposed equities is the number of high quality institutional positions. Institutions are the key to any stock's success as their massive position sizes are the ones that can cause significant price increases as they build out a position.
One of my favorite Bill O’Neil quotes talks about how no matter how slow an elephant gets in the bathtub, the water level is going to rise. No matter how slowly and carefully an institution builds a large long position, price is going to rise.
# of Institutions:
CLSK: 148
RIOT: 325
SI: 415
MSTR: 429
Finally, we have the weekly comparative excel sheet for crypto-exposed equities.
This week I’ve added 2 new columns on the right hand side that compare each stock to WGMI as well. You’ll notice that this week, the top names on this list are the ones that have been beat down the most.
Also notice how the average name on this list returned nearly 10% through Thursday this week while BTC returned ~7% and WGMI returned ~5%.
On-Chain Analytics and Derivatives
Let’s dive into some on-chain and derivatives developments from this week. First of all, from a broad price structure standpoint, BTC is pressing towards resistance amidst the consolidation we’ve been following for over 2 months now. The most important level for BTC to reclaim in our opinion remains 46-47K. As we’ve stated for a while; reclaim this and momentum probably steps back in. For short-term traders, the R/R doesn’t seem great to long, if not long already, just below major resistance.
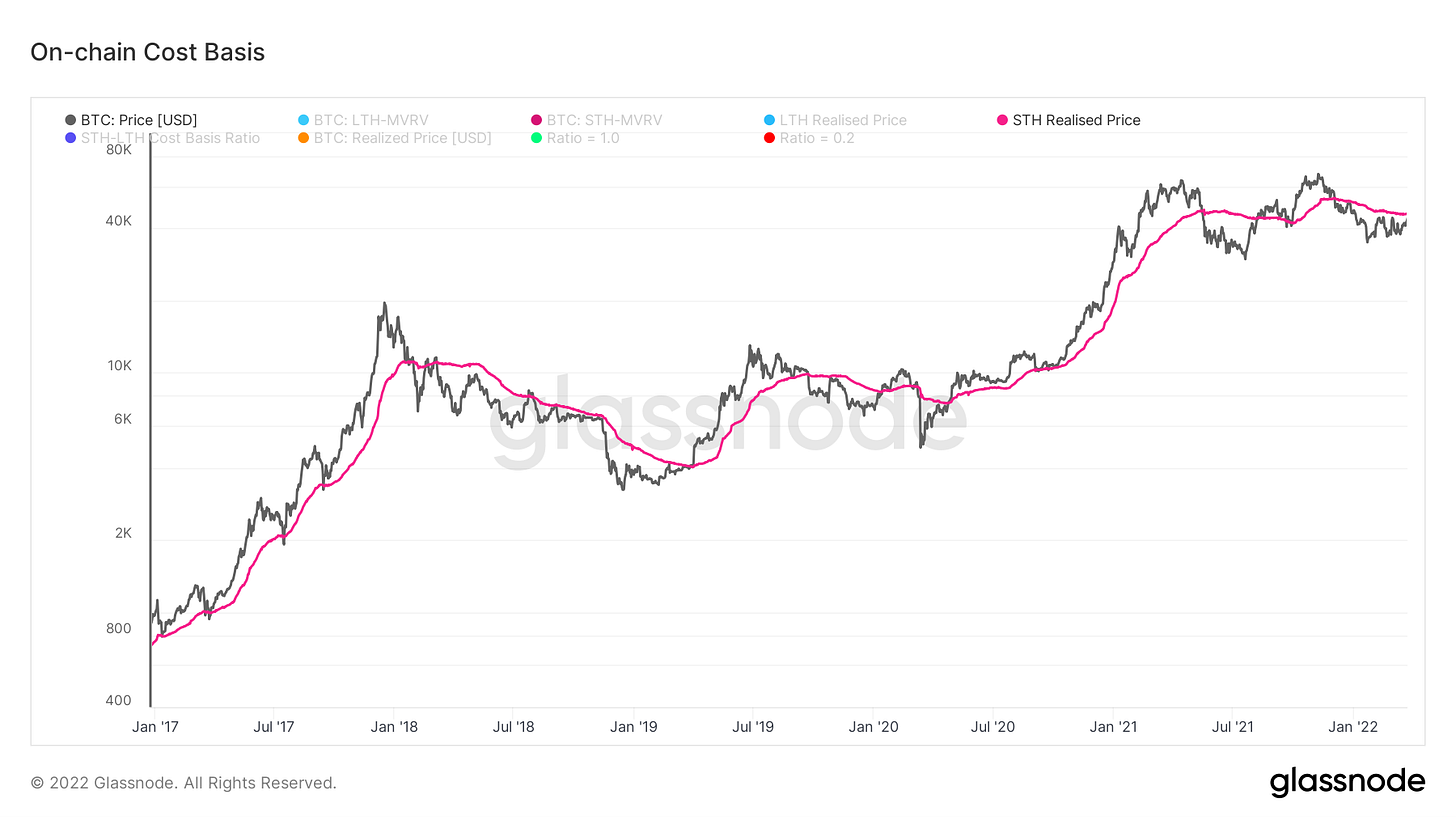
There is confluence of this with on-chain as well, with STH cost basis sitting at $46,200.
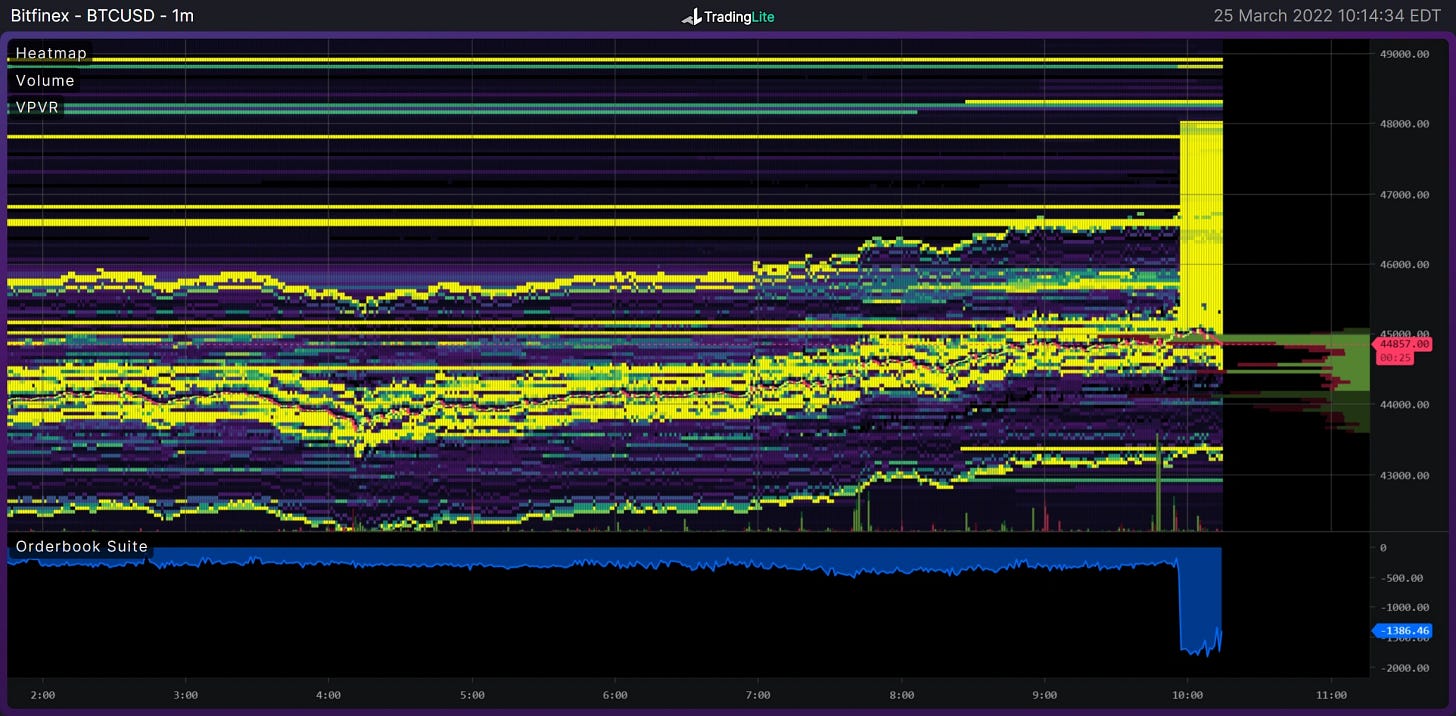
And lastly, there is confluence with this wall of asks on Bitfinex that just stepped in within the last hour. There is always a possibility that these asks are just spoofs suppressing price to fill bags, but Bitfinex bid/ask walls have a higher hit rate than most other venues outright. Bulls want to see either the wall get pulled with minimal filling, or see a full fill; know this sounds a bit strange, but if a wall is fully filled that means that the effort in the market (active orders) is outweighing the absorption (limit orders). Partial fill of the bids say 60-70% and then price reversal is not ideal for bulls, because it shows effort could not outpace absorption.
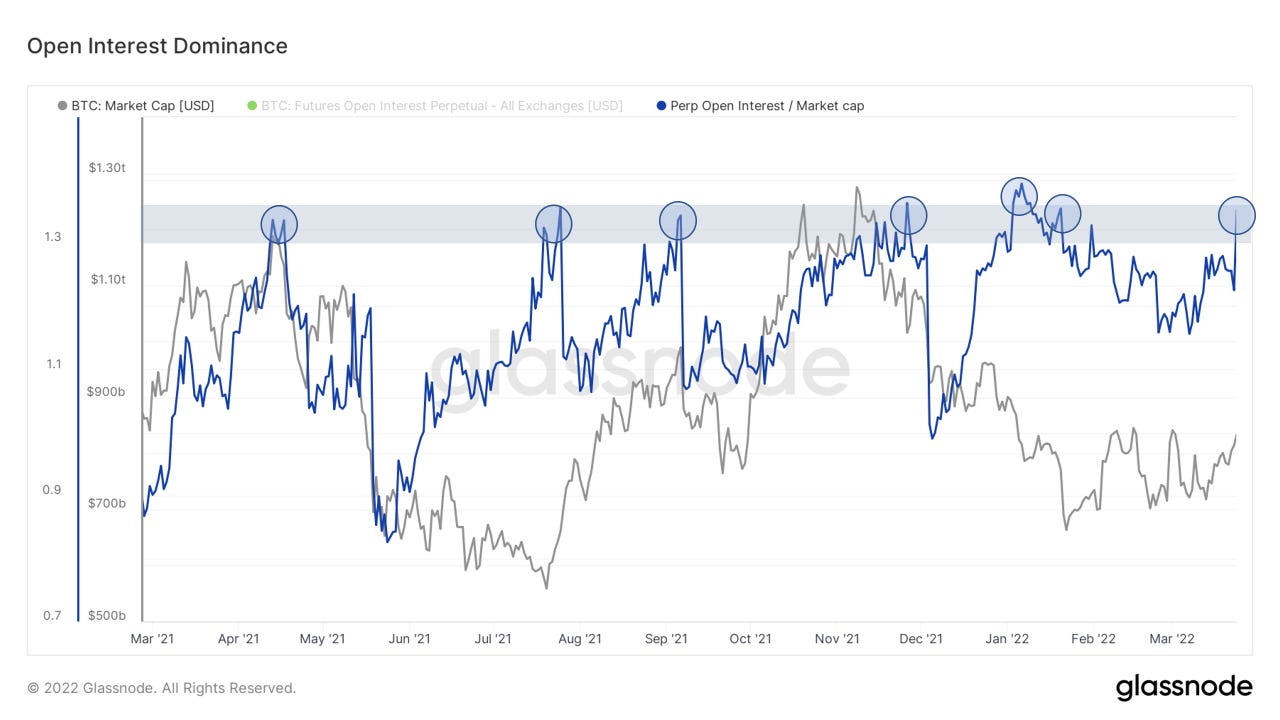
We’ve seen a pretty big spike in open interest compared to Bitcoin’s market cap over the last 24 hours. I tend to think these aren’t aggressive longs because of the next two charts we’ll look at below (spot premium and backwardation), but one way to gauge this is simply by watching the reaction of open interest with price; in this case the reaction to the 46k area. If BTC wicks through 46k and open interest doesn’t budge or rises, that’s not a great sign. If this open interest build-up is indeed shorts, we want to see OI starts to decline in “squeezy” fashion on the push above to feel fully confident this build-up has been agg shorts.
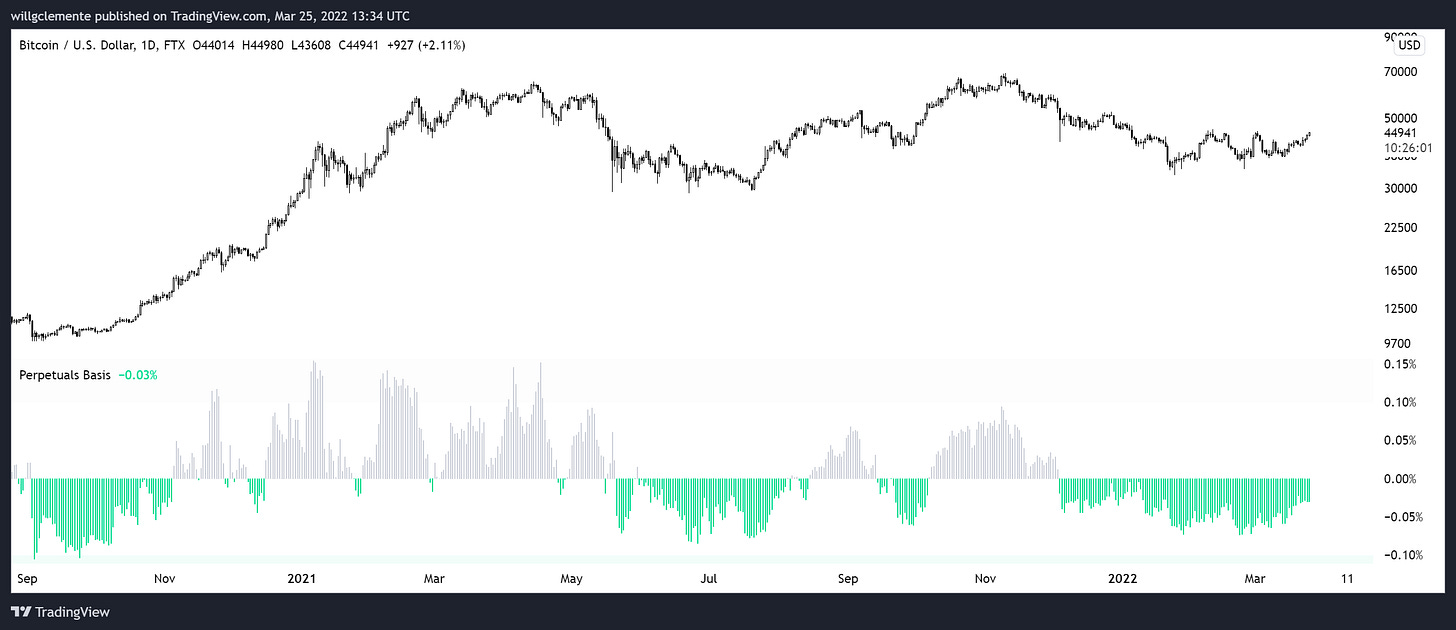
Spot premium persists, although declining slightly over the last week or two. This is one of the longest spot premia over perps regimes in Bitcoin’s trading history.
Quarterlies (which I’m not going to go into depth this week because I did in the prior two letters) remain in backwardation when adjusted for CPI inflation. This current regime has lasted 65 days compared to the 35-day regime of last summer. Another sign of derivatives greed reset in confluence with the spot premium.
Now on to the on-chain side of things. First up we have the LTH Accumulation ratio, comparing the annualized rate of LTH supply growth to Bitcoin’s supply issuance. This is showing the most deflationary reading in Bitcoin’s trading history, in other words, long-term holders are locking up supply at a pace that is outpacing the amount of BTC being introduced into circulation every day.
Another way to look at this, but instead by the actual historical spending behavior of entities on-chain; illiquid supply continues to rise. Supply continues to move to entities who sell less than 25% of the coins that they take in. This is very different from the signature during 2018.
Of the on-chain accumulation, it actually appears that some of this has come from smaller entities (orange line); with whales holdings in a broader downtrend despite a spike over the last few days.
Another hint as to the backdrop of Bitcoin market behavior, this looks at the premium that Bitcoin price trades at amongst different global trading hours. What we can see in the chart is that over the last 10 months (as of today) the United States trading hours have been trading increasingly at a premium.
Mining
Exxon ($XOM) Bitcoin Mining Pilot
Like Conoco Philips ($COP), as mentioned in our Week 26 letter, Exxon is now the latest US energy company to be secretly running a pilot Bitcoin Mining program according to Bloomberg.
The pilot program officially started in January 2021. The project is utilizing excess natural gas that would otherwise be flared in North Dakota to mine Bitcoin. This is an agreement with an external company to take gas from an oil well pad in the Bakken shale basin to power generators that are used to run Bitcoin mining rigs.
Not only does this create an additional source of revenue for Exxon, but it reduces CO2 emissions and enables them to save 18m cubic feet of gas per month. This is wasted gas that would otherwise be flared off since there isn’t enough capacity in the existing pipelines.
Since the current project has been successful at driving revenue and reducing emissions, Exxon is considering expanding the program into Alaska, Nigeria, Guyana, and Germany. Bitcoin mining is setting up to be an excellent strategy for Exxon to meet its corporate goal of ending flaring by 2030.
The world continues to watch energy companies and Bitcoin mining companies become one. Bitcoin miners are incentivized to find the cheapest energy available, and that is wasted energy. As older generation mining rigs start to become unprofitable at large mining farms, these ASICs will likely be bought up by energy companies. These energy companies will use these old machines to turn their worthless wasted energy into Bitcoin.
Looking down the road, this integration of Bitcoin into the energy industry will be another source of liquidity for mining rigs. If you’re a small-scale miner who is looking to exit your ASIC position and maybe upgrade to new generation rigs, energy companies are now interested in buying your older rigs. This continues to play into the thesis that the rigs you purchase today will retain their value for years to come.
Reuters: Coal to crypto: The gold rush bringing bitcoin miners to Kentucky
Blockware Solutions was recently featured in a Thomas Reuters Foundation article. The article highlights how the state of Kentucky is working to attract Bitcoin miners with tax incentives and how companies like Blockware Solutions are creating new jobs and bringing outside capital into the state.
Above is part of a new Bitcoin mining farm being built deep in the Appalachian mountains.
CFO of Blockware Solutions (pictured above), Warren Rogers describes the new facility saying, "We're building our own Fort Knox."
Here’s an inside look at what one of the buildings looks like.
Bitcoin mining infrastructure like this will continue being built around the United States and the entire world.
This disruptive technology is going to balance existing energy grids, clean up wasted energy, and incentivize investment into R&D projects that focus on the development of cheap renewable energy. If there is any new breakthrough technology, energy producers can partner with Bitcoin miners to immediately begin monetizing their newfound energy source.
All of this will be done while bootstrapping and distributing the world’s soundest monetary technology, Bitcoin.
All content is for informational purposes only. This Blockware Intelligence newsletter is of a general nature and does consider or address any individual circumstances and is not investment advice, nor should it be construed in any way as tax, accounting, legal, business, financial or regulatory advice. You should seek independent legal and financial advice, including advice as to tax consequences, before making any investment decision.


