Blockware Intelligence Newsletter: Week 71
Bitcoin on-chain analysis, mining analysis, macro analysis; overview of 1/14/23-1/20/23
Blockware Intelligence Sponsors
If you are interested in sponsoring Blockware Intelligence email: sponsor@blockwaresolutions.com.
Blockware Solutions - Buy and host Bitcoin mining rigs. Bulk purchase the brand new S19J Pro+ from Blockware at a price below directly ordering from Bitmain. Limited remaining supply.
NordVPN - Privately and securely browse the web. This is critical to handling your Bitcoin carefully. Use code: “Blockware” for a 30-day money-back guarantee.
Summary
Retail sales were down 1.10% in December, indicating Fed policy is beginning to affect aggregate demand.
The Producer Price Index came in lower than expected, providing another indication of inflation subsiding.
After giving one of the most overbought readings of the 2020’s, the Nasdaq has begun to consolidate the gains made over the last couple of weeks.
Bitcoin has flipped realized price into a support level; this has historically marked the end of bear markets.
On-chain activity is still relatively calm but RHODL ratio and a slight increase in the number of transactions are showing signs of life on-chain. Increasing on-chain activity is indicative of higher demand, which is necessary for a transition from a bear to a bull market.
Spot to futures volume, perpetual futures open interest relative to market cap, and the percentage of futures contracts margined with crypto, all indicate that traders and short-term speculators are still in risk-off mode and the recent rally was driven primarily by spot purchases, not derivatives.
Hashprice bull markets are when miners perform well, and it looks like Bitcoin may be on the cusp of the next one.
Miner Capitulation ended according to Hash Ribbons, indicating that there may be limited downside for BTC moving forward.
Energy Gravity sits at $0.11, indicating many miners are operating slightly above their breakeven.
Bloomberg Podcast
Listen to Blockware Solutions CEO, Mason Jappa on the Bloomberg Crypto Podcast. Mason Jappa and Bloomberg reporter David Pan discuss the troubling year that miners just experienced, how large players are being forced to liquidate thousands of Bitcoin mining rigs, and who’s buying them.
General Market Update
Despite another relatively quieter week of economic data releases, we’ve seen last week’s volatility continue this week.
In our opinion, some of the most interesting news of the week is the legislative debate surrounding the US Government debt ceiling. Currently, the ceiling sits at $31.4T, which we were on track to hit on Thursday.
The debate is whether we kick the can, and raise the debt ceiling for the 79th time since 1960, or whether we enact Government spending cuts before kicking the can.
If you haven’t figured it out already, the debt ceiling is fairly arbitrary and will inevitably be raised. The debate is when the ceiling is raised, and whether any actions to slow borrowing will take place first.
Democrats are in the ‘kick the can’ boat, and hope that raising the ceiling will allow the Government to repay due lenders using newly lent funds. Republicans, on the other hand, want to slow the rate of spending (borrowing) before discussing raising the ceiling again.
It should be noted that although the US reached the current ceiling on Thursday, it doesn’t mean that everything is going to immediately crumble to the ground. Treasury Secretary Yellen believes that the US wouldn’t exhaust its cash reserves until at least June.
A scenario where the US defaults on its debt obligations is unlikely, but would certainly have an extremely large ripple effect on global markets. There have been ideas proposed that would allow the US to continue paying its bond holders even if an agreement takes time to be made.
US Retail Sales MoM Change (TradingEconomics)
Data released on Wednesday by the US Census Bureau indicates that in the month of December retail sales were down by 1.10% from November.
This is congruent with the declining CPI inflation numbers that we discussed in this newsletter last week. This could potentially be a signal of an impending recession as consumers are finally spending less as a result of a tightened financial environment.
That being said, retail spending was still up around 6% from December 2021, roughly in-line with CPI growth.
This is certainly something the Fed is keeping an eye on. Our team believes that it reassures the Fed that they’re heading in the right direction, but still have lots of work to do. Several FOMC officials spoke on Wednesday in support of a 25bps rate increase when the committee meets in a couple of weeks.
After public discourse from several Fed officials on Wednesday, CME’s FedWatch Tool is now predicting a ~95% probability of a 25bps hike on February 1st. This is up from a 65% probability 1-month ago.
On the production side, we got last month’s Producer Price Index (PPI) numbers on Wednesday. In the month of December, the PPI declined more than expected, signaling that inflation is clearly beginning to subside.
PPI is a leading indicator of CPI, as higher (or lower) prices for producers will eventually bleed over into the consumer. In early 2022, this newsletter highlighted PPI as an indication of higher CPI values to come. Now we’re seeing the opposite as PPI falls more aggressively than expected.
PPI grew by 6.2% YoY and -0.5% MoM in December, in comparison to 7.3% YoY and 0.2% MoM in November.
On Thursday we got the release of last week’s Initial Jobless Claims (IJC) numbers.
IJC is a measure of the number of individuals applying for government benefits for the first time following unemployment. As we discussed in this newsletter last week, employment is likely to become a focus of the Fed in 2023.
IJC came in at 190,000 for the week of 1/14/23, this was significantly below expectations of 214,000. This now sits in-line with late April and mid-September’s numbers.
With the labor market remaining very resilient in aggregate, it could create a need for the Fed to continue their restrictive regime for longer than originally planned in order to effectively squash demand.
For the equity indexes, early this week saw the most extreme overbought conditions of this bear cycle. This could mark the cyclical bottom, or be a signal of more selling to come.
The definitive signal we’re looking for will come as this market attempts to digest its recent gains.
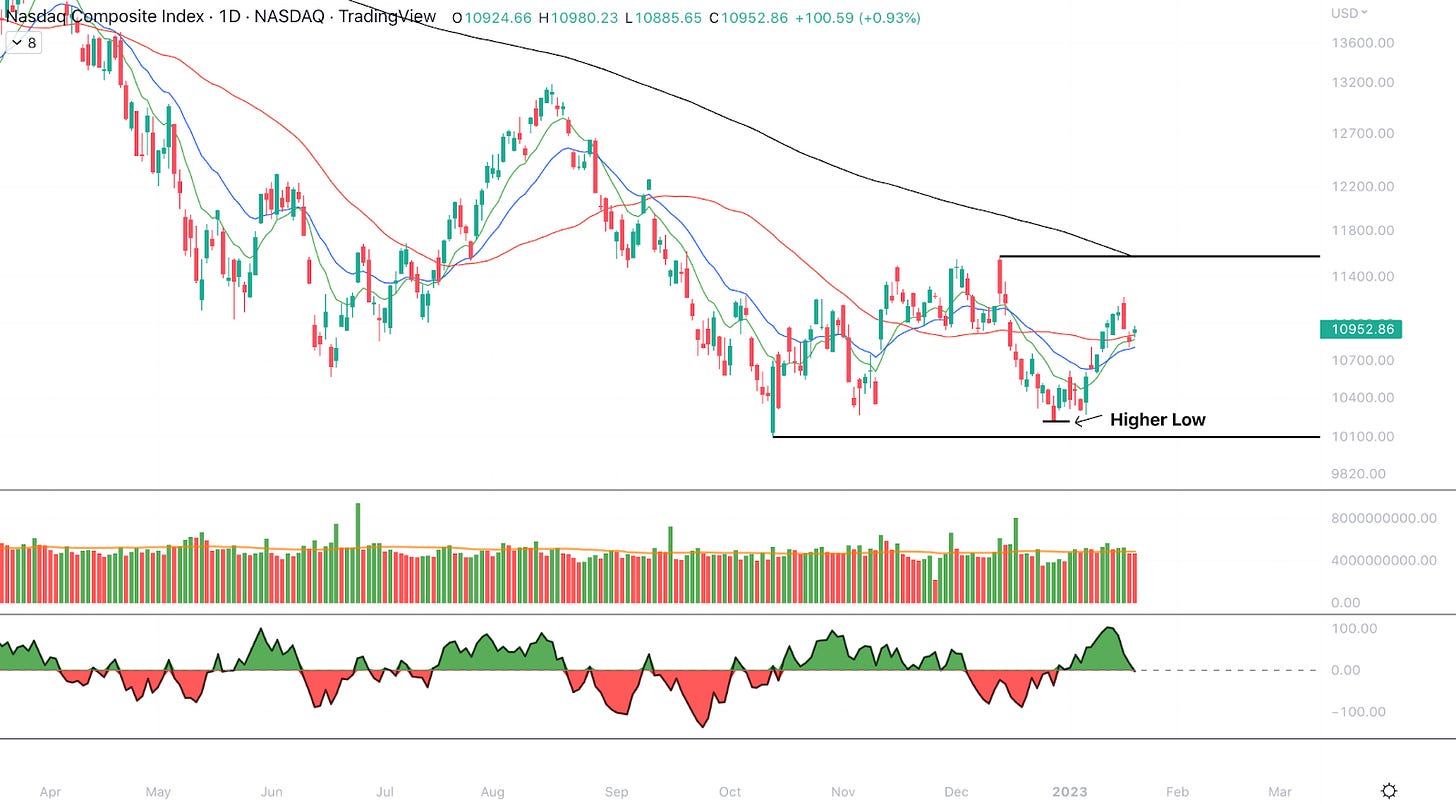
Nasdaq Composite Index, 1D (Tradingview)
The McClellan Oscillator (bottom pane) is a fairly popular tool used to measure the breadth of the market. This indicator is essentially a MACD of the Advance/Decline Line, which counts the number of stocks in the index increasing vs. decreasing in price.
On Friday last week, the McClellan Oscillator gave an extremely overbought reading of 103.32. The Nasdaq hadn’t seen a value above 100 since May, and >103 hasn’t been seen since June 2020’s 118.70 print.
This was a clear signal that buyers were likely near exhaustion and price was due for a pullback or consolidation.
Earlier in the week we saw a continuation of last week’s buying, but price action on Tuesday was on very light volume.
On Wednesday, the index retreated back towards its 50-day SMA after running into sellers around its Volume Weighted Average Price anchored off its previous June 16th low. This selling came on fairly strong volume, coming in around its 50-day average, and 32% greater than Tuesday’s volume.
On Thursday the selling continued as the Nasdaq undercut its 10 and 50-day MAs.
The Nasdaq already put in a higher low, after failing to undercut the 10/13 low of $10,088.83 during its December selloff. We’re now on the lookout for the index to find support before making a higher high above $11,571.64.
Ideally, we would see a lower volatility sideways digestion to allow shorter term moving averages to catch up to price and provide a launch pad for the index to continue higher. A consolidation that holds ~$10,800 at the convergence of the 10 and 50-day MAs would be most ideal.
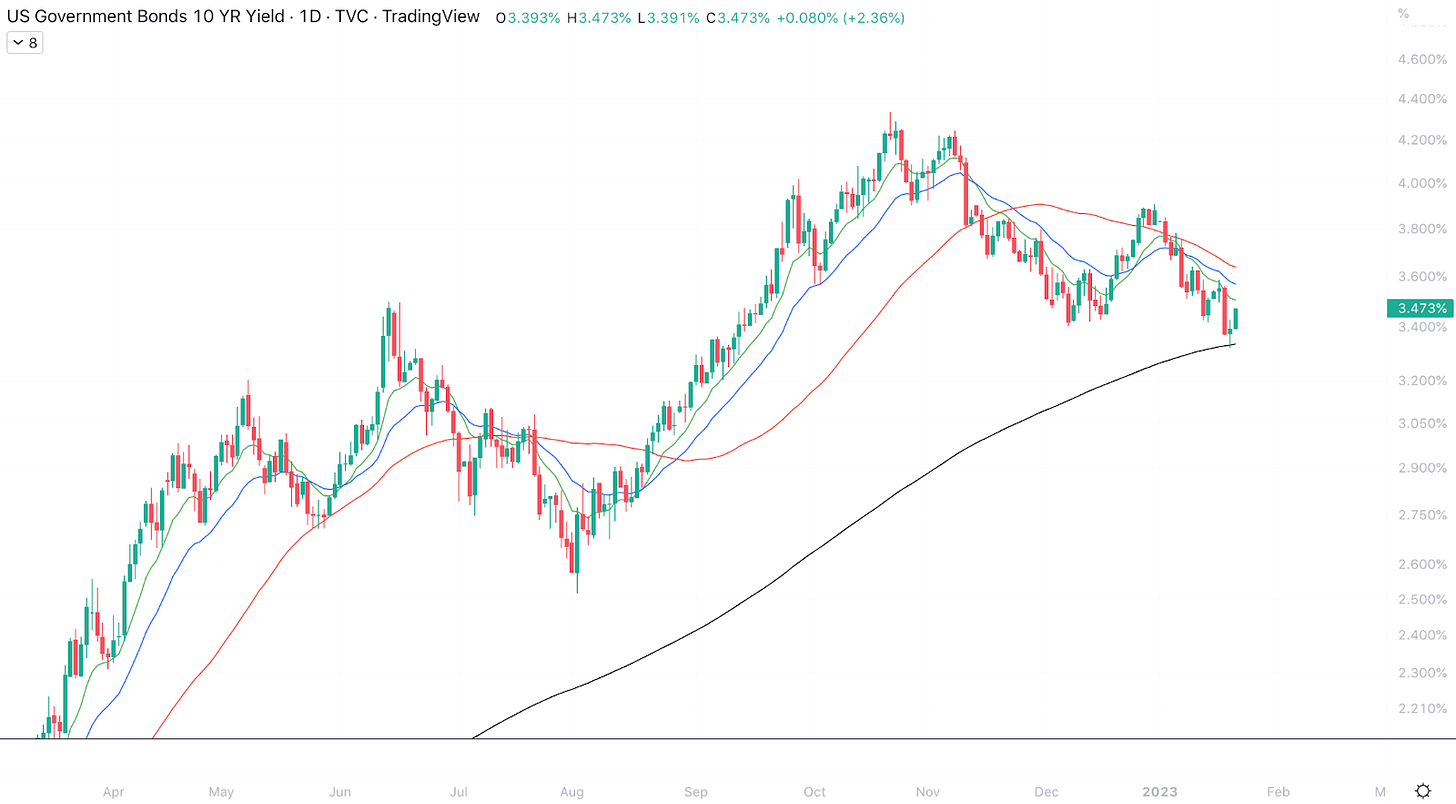
US 10-Year Treasury Yield, 1D (Tradingview)
This week we’re continuing to see a strong rally underway in the Treasury market. We’re seeing the strongest buying occur in the middle-upper end of the curve.
As mentioned in the last several Blockware Intelligence newsletters, our team views this as institutional defensive positioning as recession risks rise.
Despite recession risks rising, shorter maturity Treasuries are still seeing a fairly robust bid. This is likely due to the simple fact that investors can receive a 4.6%+ yield on a “risk free” 3 or 6 month Treasury.
Crypto-Exposed Equities
Similar to the equity indexes and Bitcoin itself, we’ve seen a few days of attempted consolidation from crypto-equities this week.
The strongest names this week are those who’s price remains above the 10-day EMA and had positive candles on Thursday. A few examples of names showing strength relative to the rest of the industry group were: MARA, MSTR, COIN, and RIOT. Some relatively weaker names for comparison were: SI, WULF, SDIG and BKKT.
Our team is watching spot Bitcoin price action to judge what’s to come for these equities. If BTC can maintain its current constructive consolidation it would certainly be bullish for these stocks. A break below ~$20,300 for BTC would likely result in these stocks headed back towards their lows.
Above, as always, is the excel sheet comparing the Tuesday-Thursday price action of several crypto-equities, Bitcoin, and a mining ETF.
Bitcoin Technical Analysis
Following last week’s monstrous gains, we’ve thus far seen a healthy digestion underway for BTC.
Bitcoin/US Dollar, 1D (Tradingview)
After a period of strong price action, the forthcoming digestive period gives an indication of the strength of buyers. As of Friday morning, BTC buyers appear to be retaining control.
In the world of technical analysis, we look for low volatility and low volume consolidations to allow shorter-term moving averages to catch up to price and provide a launch pad for higher prices, as mentioned earlier in this newsletter.
BTC is clearly very overbought here, but just because something is overbought doesn’t mean it can’t become even more overbought.
As mentioned above, a break below ~$20,300 would invalidate the strength BTC is currently showing. On the other hand, a break above ~$21,650 would signal that BTC is likely headed towards higher prices.
Bitcoin Onchain and Derivatives
Bitcoin’s price is now above realized price (the aggregate cost basis of all Bitcoin).
This is hugely bullish; the previous instances of this cross have signaled the end of a generational buying opportunity, and they have been followed by months of up-only price action.
If you recall from our 2023 market forecast report, we predicted realized price would be flipped into support this year. It’s too early to say it is support, but so far that prediction is looking solid.
Some analysts may claim that long-term holder realized price is another resistance level but I would disagree for one primary reason.
Long-term holders behave differently than short-term holders. Long-term holders tend to very rarely sell their Bitcoin. The supply of Bitcoin held by long-term holders is up and to the right over the long-term. You do see long-term holders sell part of their holdings during bull runs, but this requires substantial USD denominated returns to incentivize them to do so. The price needs to reach levels that are 2x, 4x, or even 10x higher than the realized price of long-term holders before we see them begin to sell. Even then, they do not sell all, or even most, of their BTC.
Over the next few months, we will be looking for on-chain trends that signal whether we are moving from a bearish environment to a bullish one.
Some trends we would like to see are increasing on-chain activity including higher transaction volume, movement of young coins, positive momentum in the number of new addresses and/or entities, and higher levels of supply, both young and old, in profit.
RHODL Ratio (orange) is a ratio of the realized cap for 1 week old coins and the realized cap for 1-2 year old coins. In simple terms, this is comparing how much of the realized cap is coming from young vs old coins. Higher values indicate younger coins are having a more dominant impact on the realized cap, lower values indicate less impact from younger coins. The green line is just analyzing the trend by comparing the RHODL ratio to its 365 day moving average.
As mentioned, increased activity from younger coins is a trend we want to see to confirm we are leaving the bear market. A local bottom in RHODL represents the point at which young coins, aka traders/speculators/new market participants, are most absent from the market. We are still at that point but the positive momentum as related to the 365D moving average signals that younger coins should begin reentering the market very soon.
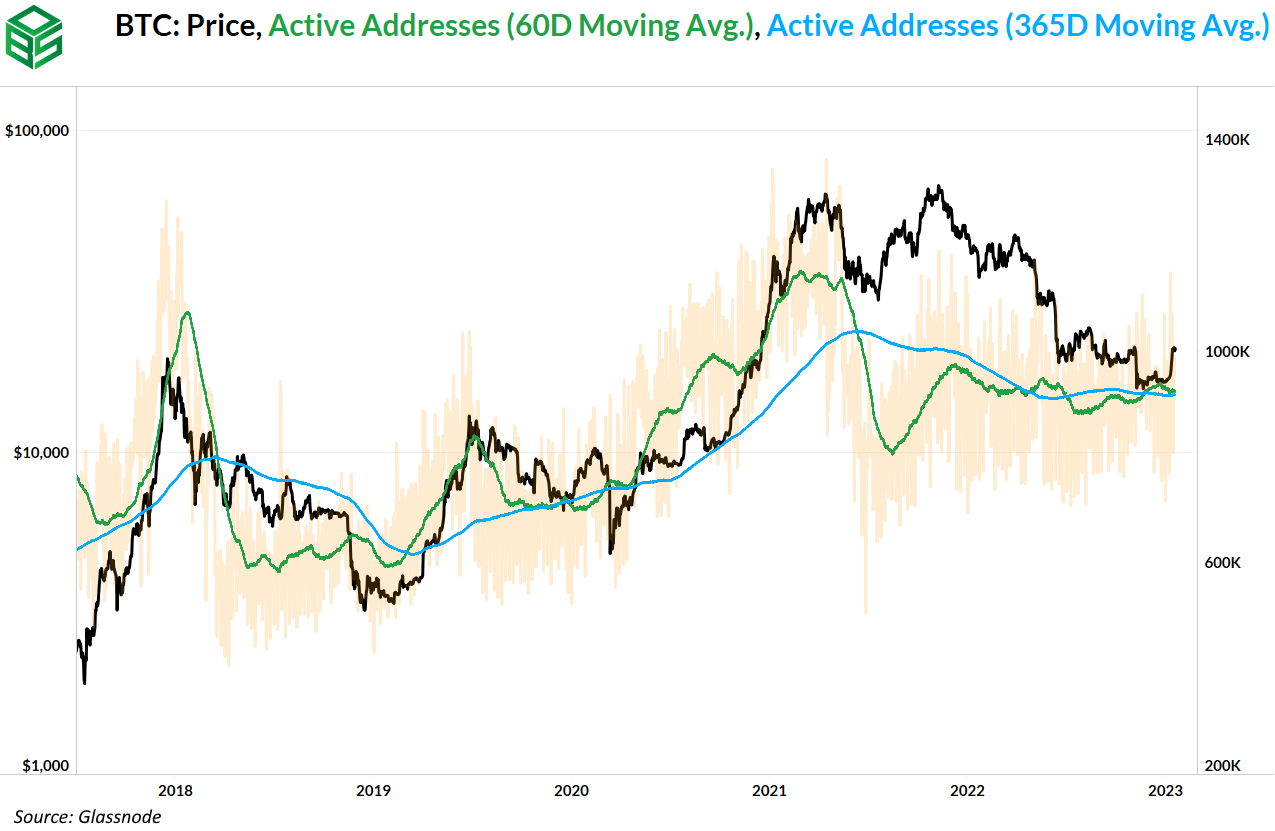
This week we’re gonna take another look at active addresses.
To reiterate, we want to see increasing on-chain activity as a sign that the dark days of the bear market are over. Notice how in the months following the 2018 bottom there is a sustained period in which the 60D moving average of active addresses is greater than the 365D moving average.
We haven’t yet seen such activity this time around but we will continue to monitor this metric as it can show whether or not on-chain activity is increasing.
Looking at the number of transactions (adjusted for transactions for in-house exchange transactions), we have seen a noticeable increase.
We have seen the largest number of on-chain transactions since spring/summer of 2021. Should we continue to see an increase in the number of transactions that would be a very bullish sign as it shows more demand. At the end of the day, the price is determined by how much the marginal buyer is willing to pay and how much the marginal seller is willing to accept. Increasing demand, as evident by more on-chain transactions, will result in a higher price as marginal buyers have to outbid each other.
Observe the increase in the number of transactions that coincides with the end of the 2018 bear market.
A trend we don’t want to see is massive leverage or derivatives volume as the price increases. Some amount of leverage and derivative volume is to be expected, especially once the next bull-mania phase is entered. But, price increases absent excessive leverage, driven mostly by spot purchases, are more likely to be sustained in the short term.
This chart from The Block shows the ratio of spot BTC volume vs futures volume.
This is exactly the behavioral trend we want to see. Increasing spot volume relative to futures volume.
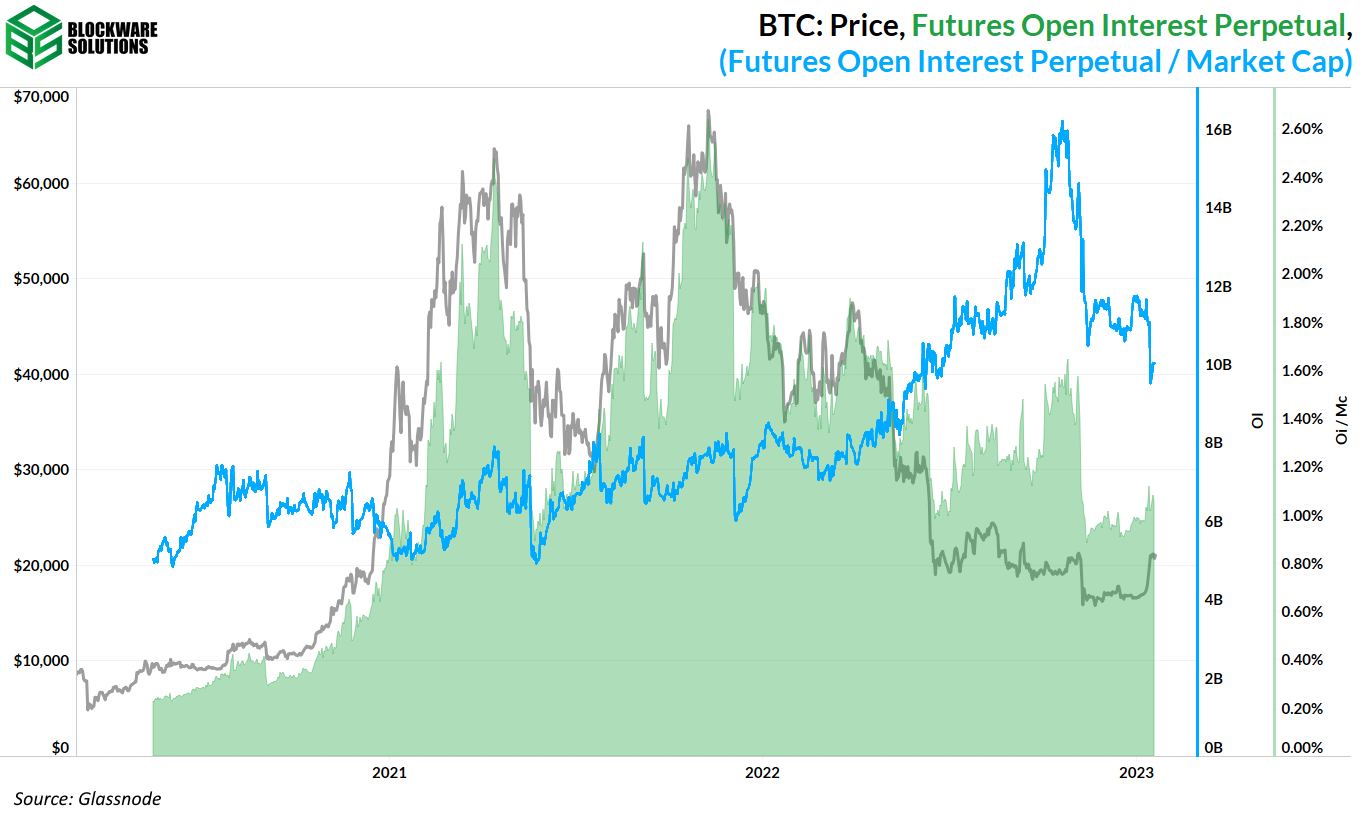
Throughout the past few months, we have been keeping tabs on perpetual futures open interest (OI) relative to market cap. Volatility was relatively low from mid-June 2022, after the Luna and 3AC implosion, until the FTX implosion in November. During this time, a large amount of OI accumulated, especially relative to market cap.
In the past two months, we have seen OI relative to market cap continue to decline, and unadjusted for market cap, there hasn’t been any notable build up in OI either.
Again, this is a good sign because it shows the price appreciation is coming from true demand for spot BTC, not BTC derivatives. This shows that the majority of traders and short-term speculators are still in a risk-off mode; too fearful to re-enter the market.
We can see further evidence of risk-off behavior by looking at the declining trend in the percent of futures open interest margined with crypto. This measures what percentage of crypto futures open interest is margined with the native coin vs margined with USD or a USD-pegged stablecoin.
Using BTC as collateral for a BTC futures contract is of course riskier as declines in the price of BTC lower the value of your collateral; meaning you are effectively double-dipping. However, we are seeing a diminishing percentage of futures contracts being margined with crypto which should allow for more sustainable price appreciation.
Bitcoin Mining
Hashprice Bull Runs
Throughout Bitcoin’s history there are periods when hashprice, a metric that measures miner revenue per TH per day, increases over a substantial amount of time. We saw a hashprice bull run in 2019 and a hashprice bull run from 2020 to 2021.
For example at today’s $0.07 hashprice, an S19XP (140T) mines ~$10 per day. If hashprice increased back up to $0.20, that same machine would be earning $28 per day.
Looking at the chart below, it is possible that Bitcoin is on the cusp of another hashprice bull run.
Miner Capitulation Ends
Hash ribbons are a great way to quickly determine whether miners are actively turning off or turning on in aggregate. Since this time last week, the metric has indicated that the miner capitulation that originated in November 2022 is now over. More weak inefficient miners have been purged from the network and the strongest of the industry remain.
Historically, the end of miner capitulations mark ideal times to deploy capital into Bitcoin and Bitcoin mining.
Energy Gravity
The following chart is based on a previous Blockware Intelligence Report that models the relationship between the price of Bitcoin and its cost of production. The model makes it easy to visualize when the price of Bitcoin is overheated or in the process of bottoming.
This week we continue to see more confirmation that Bitcoin is likely in the process of bottoming.
All content is for informational purposes only. This Blockware Intelligence Newsletter is of general nature and does consider or address any individual circumstances and is not investment advice, nor should it be construed in any way as tax, accounting, legal, business, financial or regulatory advice. You should seek independent legal and financial advice, including advice as to tax consequences, before making any investment decision.


