Blockware Intelligence Newsletter: Week 17
Bitcoin on-chain analysis, mining analysis, equity-analysis; overview of 11/26/21-12/03/21
Dear readers,
Hope all is well and you had a great week. Before getting into the letter, just a brief friendly reminder that our Blockware Intelligence Indicator Dashboard is now live! Can visit here: intelligence.blockwaresolutions.com
Will be releasing a video on our YouTube this afternoon walking through the dashboard and explaining some of the functionality. We are wide open to your feedback as this is built for the community. Enjoy!
Overall, here are our general bull and bear cases for the Bitcoin market:
Bull: On-chain supply dynamics (illiquid supply, LTH supply, HODL waves, dormancy, etc), On-chain oscillator never reached exuberance and reset over summer, Summer included on-chain behaviors that have historically resembled a bear market, Funds have fresh PnLs in January & therefore hunger to take on risk, Macro uncertainty
Bear: Price action still looks like a failed macro breakout, need to reclaim $60K, OI excluding CME and Perpetual swap OI both near ATHs in both USD and BTC terms, Regime of positive premium/funding + L/S ratio with no reset, Funds sitting on large uPnLs at the end of the year looking for reasons to lock in gains + hesitant to take on risk at this time, Macro uncertainty
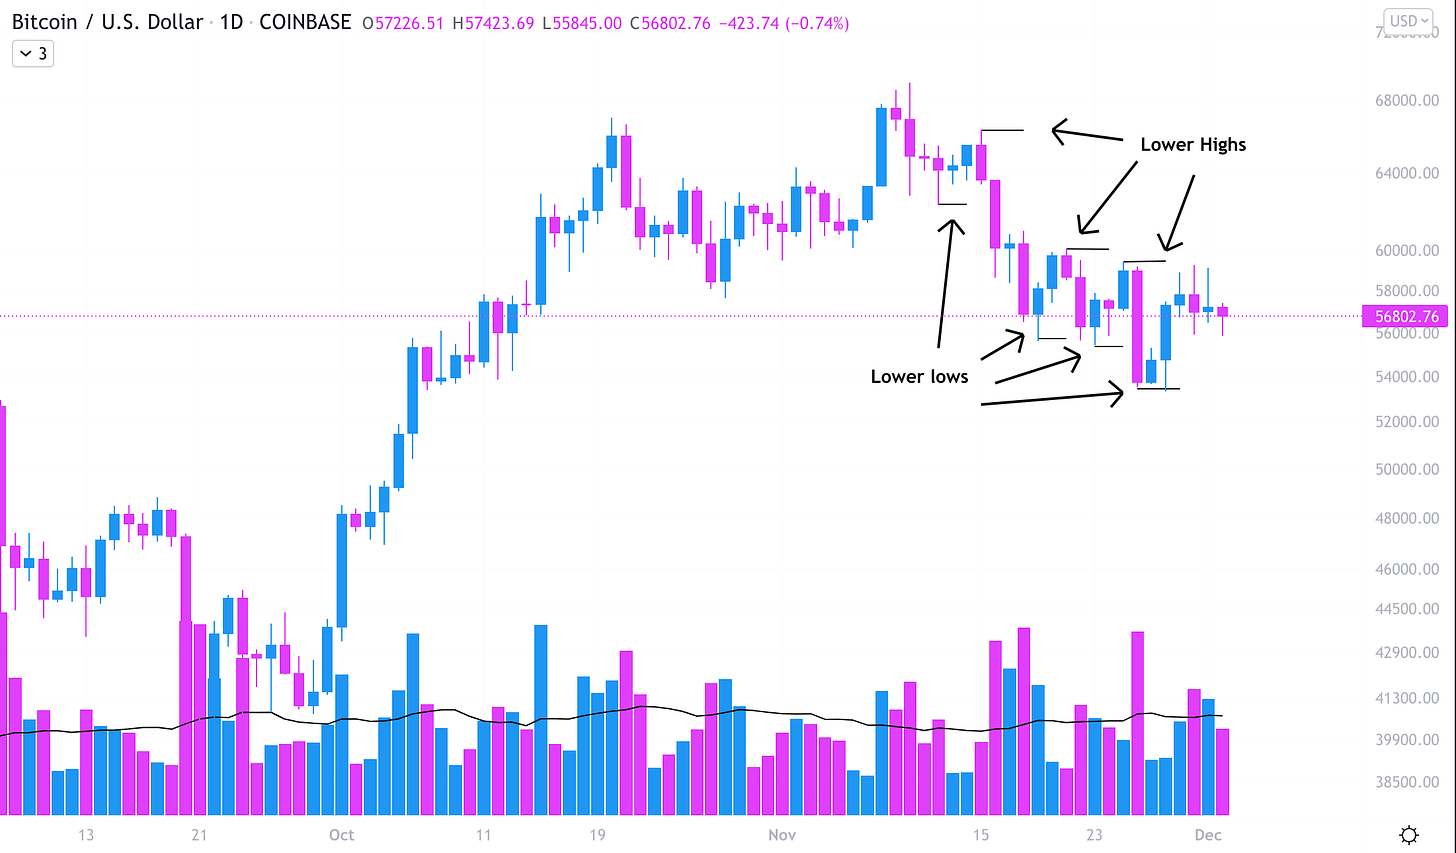
If we evaluate Bitcoin based solely on price action, it looks like we’re likely not quite out of the water. Over the weekend we saw a nice bounce from near the previous resistance from September 7th. But BTC failed to put in a higher high after the move higher.
The past few weeks have been pretty consistent, BTC undercuts the previous low and then bounces, being sold off before being able to pass that previous high.
In order to make a legitimate rally attempt, look for BTC to make a higher high. At the moment this would mean a cross above the 11/25 high at $59,446.
From an on-chain perspective, what we discussed last week was the importance of the short-term holder realized price or cost basis. For technical analysts, think of this as an on-chain volume-weighted average price.
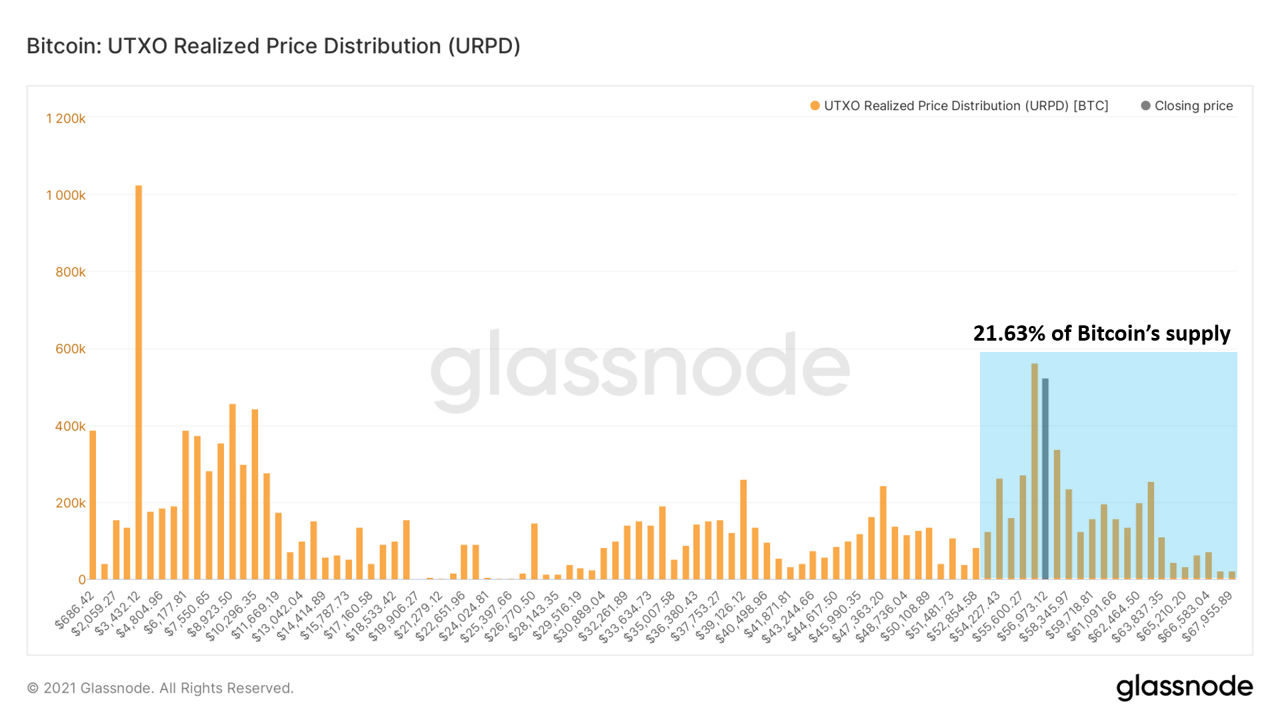
Near textbook bounce off of support band, which still stands just above $53K. Bouncing off $53K was also a significant level because that is the $1T market cap threshold for Bitcoin. Note in September of last year and September of this year we bounced off the band more than once before truly bottoming out and moving higher. Just something to keep in mind.
Speaking of the 1 trillion dollar market cap threshold, 21.63% of Bitcoin’s money supply has now moved above. We see this as validation of Bitcoin as a legitimate macro asset class.
Supply dynamics continue to hold bullish outlook for the broader picture. Here we look at illiquid supply shock ratio which tracks the movement of coins from weak to strong hands, as well as the long term holder supply shock ratio which looks at the movement of coins from short to long term holders. Continuing to see a climb in illiquid supply shock so no major concern from that perspective; at both the 2017 peak and peak in April earlier this year the ratio declined for several weeks before the price rolled over. In addition we continue to see the long-term holder supply shock ratio rolling over, suggesting some profits being taken by long term market participants as per usual bull market behavior. Remember, long-term holders scale into weakness and scale-out into strength. Short-term holders buy into the bull market and then either leave/capitulate into the bear, or age into long-term holders. Whenever illiquid supply is climbing and long-term holder supply is declining that has historically resembled bullish market conditions.
These supply dynamics are also reflected by other metrics including HODL waves, CDD, destruction, etc. but have been excluded from the letter due to the email length restriction.
Aside from macro and traditional markets, one thing to keep in mind is derivatives market dynamics. Excluding CME, we have a substantial buildup of open interest in both BTC and USD terms. The way I think of open interest is like pressure build-up, at some point this pressure will get releases, but the direction of the release depends on positioning/liquidity as well as what happens admist the release. For example leveraged traders longing the dip on leverage the night of May 18th before the final leg that pushed BTC down to $30K.
Perpetual futures open interest is even higher than the chart below. Some have referenced this to be a “new normal” because funds are potentially using perps as a substitute for spot when funding is low to maintain delta-neutral positioning and execute the cash/carry trade now made possible by the contango (positive sloping futures curve) from the Future ETF. Although this is an interesting theory, there is no way to quantify this.
In combination with this, we have been in a regime of positive funding/derivatives premium along with L/S ratios. Usually what we see are regimes of either positive or negative funding before a major liquidation event that flips the regime. Looking below we can see: Negative regime after March 2020, positive regime into September 2020, negative/mixed regime (uncertainty) heading into Q4 2020, positive regime until May 2021 but got several resets along the way, negative regime over summer, positive regime since August, reset in September, now sitting in a positive regime with no reset yet.
TLDR: See our bull/bear cases at the beginning of the letter. Overall on-chain dynamics do not point to us entering a “bear market” and the “macro” of Bitcoin still looks strong. Derivatives data shows a large build-up of OI, that will likely get released at some point, just not sure exactly when. Would love to see some kind of OI wipeout followed by a regime of negative/mixed funding similar to post-September into Q4 of last year. Possibility we could see a “darth maul” type candle that wipes out both longs and shorts. Just depends on positioning and the actions we see as the event would theoretically unfold, similar to the untying of a balloon effect we described.
At certain times different parts of our analysis are weighted differently depending on the unique scenario. At this time we are weighing a larger portion of our outlook to legacy markets and overall macro.
Equities
Despite the Nasdaq only down 0.33% for the week as of Thursday’s close, this week we’ve seen dangerous price action in many tech stocks.
Thursday showed us some potentially promising action for QQQ, gapping down to open below Wednesday’s close and then reversing to close inside of Wednesday’s range. This is what we call an “oops reversal” and it sometimes marks the bottom in a correction.
The oops reversal is a sign that someone made a mistake. People often put their sell stops at the previous day’s lows. So when the Q’s opened up below that low, it automatically triggered their order to sell. When another buyer stepped in to accumulate, people bought back their shares fueling a move off the bottom.
But I’m not totally convinced that Thursday was our bottom. I like to see price supported by previous price structure, or at least a moving average of it. The most logical place to find support is around the high before the previous correction on September 7th at $382.78.
We can also use volume weighted average price (VWAP) and anchor it to that previous high. This gives us the average price shareholders have paid for QQQ since it made that high. This is a common place for portfolio managers to add to a position as they can then say they paid an average price for the stock.
Anchored VWAP off the Sep. 7 highs is currently at $381.89, just above the 50 day SMA at $380.56. This seems like a healthier place to put in a bottom, but nothing to do but wait and see.
A/D Line (Marketsmith)
This week we’ve seen a continuation of declining breadth. The Nasdaq’s A/D line, discussed last week, continued downwards this week with price following suit.
When price and breadth fall together, we can say with confidence that there’s a true flush out occurring in the index. This is something that is necessary to create a new class of buyers at the bottom, whenever that occurs.
Coinbase (COIN):
In my opinion, Coinbase is at a serious make-or-break price level here. As of Thursday, VWAP anchored off its IPO day sits at $286.01. We closed below it Thursday, so it would be encouraging to see COIN get back above that level before we close this week.
We also have previous resistance from Sept. 3rd at $280.61, this is another logical place to find support. Be sure to keep an eye on those key levels when determining the overall trend in COIN.
Mining
Downward Difficulty Adjustment
Last Sunday morning, Bitcoin saw its first downward difficulty adjustment since the China mining ban this past summer. If you are new to mining, a downward difficulty adjustment occurs when net hash rate is leaving the network. Bitcoin’s difficulty algorithmically adjusts roughly every 2 weeks (2,016 blocks).
This past weekend's downward adjustment was partially caused by some mining pools including Binance Pool, F2pool, Poolin and ViaBTC facing a technical issue caused by domain name system (DNS) “pollution”. After a few days, most of these issues were quickly resolved by using work arounds like VPNs.
Hash Ribbons
Bitcoin hash ribbons can be used to accurately confirm significant drops in hash rate. This can occur for a wide variety of reasons (China mining ban, halving events, significant price drop, or DNS issues).
Looking at the Glassnode chart below, Bitcoin has had four “miner capitulations” since January 1st, 2020. While we did just have a slight drop in difficulty (indicating hash rate has dropped), there is minimal evidence that suggests we will see any form of real miner capitulation. Hash rate has a very high probability of continuing to grow due to how profitable it has been to deploy ASICs and keep them plugged in.
Fees % of Block Reward
Since this summer, the mempool has been fairly dead. For reference, the mempool contains all of the potential transactions that have been broadcasted, but not yet written to the Bitcoin blockchain.
During times of high usage / volatility, the mempool can get congested, incentivizing users of bitcoin to pay higher fees to get in the next block (to speed up their transaction finality).
Fees as a % of the block reward is a relevant metric for miners because if fees are high then miners become increasingly more profitable. In the chart below, you can see back in April of 2021 that fees became 20% of the total block reward. Of course, more recently, fees have dropped significantly.
This isn’t necessarily a bad thing. Miners would be happier if fees were higher, but they are still highly profitable at today's bitcoin price.
Disclaimer: Not financial advice, for informational purposes only


Funny how when the market is tanking, not that many people post in the newsletter threads! Hodl and appreciate how bright your financial future will be due to Bitcoin.
Excellent newsletter and thanks to share your great info balance analyst. 👏🏻👏🏻👏🏻