Blockware Intelligence Newsletter: Week 82
Bitcoin on-chain analysis, mining analysis, macro analysis; overview of 4/1/23-4/7/23
Blockware Intelligence Sponsors
Blockware Marketplace - Buy, sell, and trade hosted Bitcoin mining rigs.
Passport is the Bitcoin hardware wallet you already know how to use. With a gorgeous design and familiar interface, Passport makes it easier than ever to self-custody your Bitcoin.
No more sitting at your computer or squinting at tiny screens. Passport seamlessly connects to your phone, empowering you to quickly view your balance and move Bitcoin in and out of cold storage.
Get yours today at:
https://foundationdevices.com/?mtm_campaign=Blockware
Use code: BLOCKWARE for $10 off!
If you’ve thrown your hands up trying to run a lightning node, relax, you’re not an idiot, It’s not intuitive and manual management means you won’t survive.
These guys are friends of the newsletter and have a limited private beta for readers to trial automated LND operations like rebalancing and channel fee management.
Email paul@encryptedenergy.com and mention us for personalized onboarding.
Summary:
March’s job report shows that American companies added 236,000 jobs last month, just below expectations.
The Challenger Report released this week showed that Q1 of 2023 had the most announced layoffs since Q3 2020, and the 7th highest Q1 of the 21st century.
Stocks and bonds had an overall strong week, as declining labor conditions have led to market participants expecting future interest rates to decline faster.
Bitcoin’s price structure indicates we’re gearing up for an explosion of volatility.
Users that joined the Bitcoin network in the 2021 bull run are maturing into convicted, long-term holders.
The rate of new entities joining the network is accelerating.
Low realized volatility signals that Bitcoin is likely due for a big move.
Stagnant Open Interest relative to Market Cap, and a mixed funding rate indicates a risk-off appetite among traders.
Foundry USA Bitcoin Mining Pool increases fees from 0.
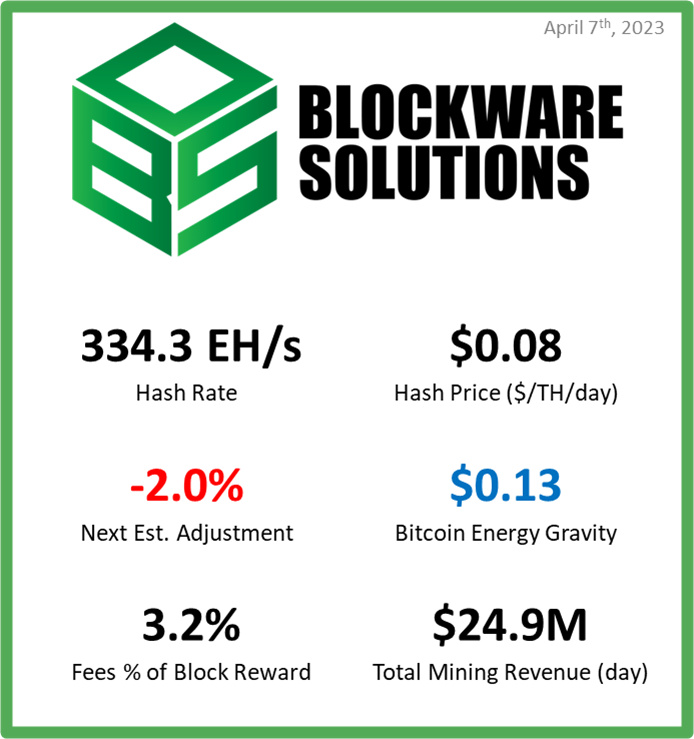
The breakeven electricity rate for a modern Bitcoin ASIC is $0.13/kWh.
At a typical hosting rate today, new-gen Bitcoin ASICs require ~$15,800 worth of energy to produce 1 BTC.
General Market Update
Note that US markets are closed today in observance of Good Friday.
Overall, it’s been another fairly quiet week on the macro side of things. However, we did receive several updates on broader labor conditions in the US that all show a quickly degrading job market in the US.
This morning we saw the release of the March jobs report. This report showed that employers added 236,000 jobs last month, leaving the unemployment rate at 3.5%.
Market expectations for this report were 239,000. The 3,000 job surprise is not super significant, but you’ll see that all labor metrics reported this week did not meet expectations.
This week we also received the payroll report from ADP, which showed that private American companies added 145,000 jobs in the month of March. This was significantly less than expectations of 210,000 and February’s 261,000.
US Job Openings (Bureau of Labor Statistics JOLTS Report)
This week we also received February’s Job Openings and Labor Turnover Survey (JOLTS) report from the Bureau of Labor Statistics. This report shows that there were 9,931,000 open jobs at the end of February, the first break below 10,00,000 going back to May 2021.
This was well below January’s 10,563,000 openings and expectations of 10,400,000.
We also received March’s Challenger Report this week from Challenger, Gray & Christmas. This report seeks to measure the amount of public announcements of job cuts in a given month.
The report for March showed that US companies announced a total of 89,703 job cuts. This was up 15% from February and 319% from March 2022.
Across the entire first quarter of 2023, CG&C measured 270,416 job cuts. This was the 7th highest amount of Q1 job cuts in the 21st century and the highest single quarter since Q3 2020.
These numbers all show that labor conditions are quickly worsening in the US. Fed Chair Powell has repeatedly stated that the labor market is something that the Fed is watching closely at this stage of the cycle to indicate whether tightened financial conditions are having their intended effect.
Clearly, tighter financial conditions have begun to have a major impact on the jobs market and the broader economy.
Despite the economic downturn that was 2022, the labor market was largely strong throughout the year. Now as we head further into 2023, we’re beginning to see employers take an opposite stance as the economy begins to slow.
Despite the negative outlook for the labor market, stocks have had a fairly strong week.
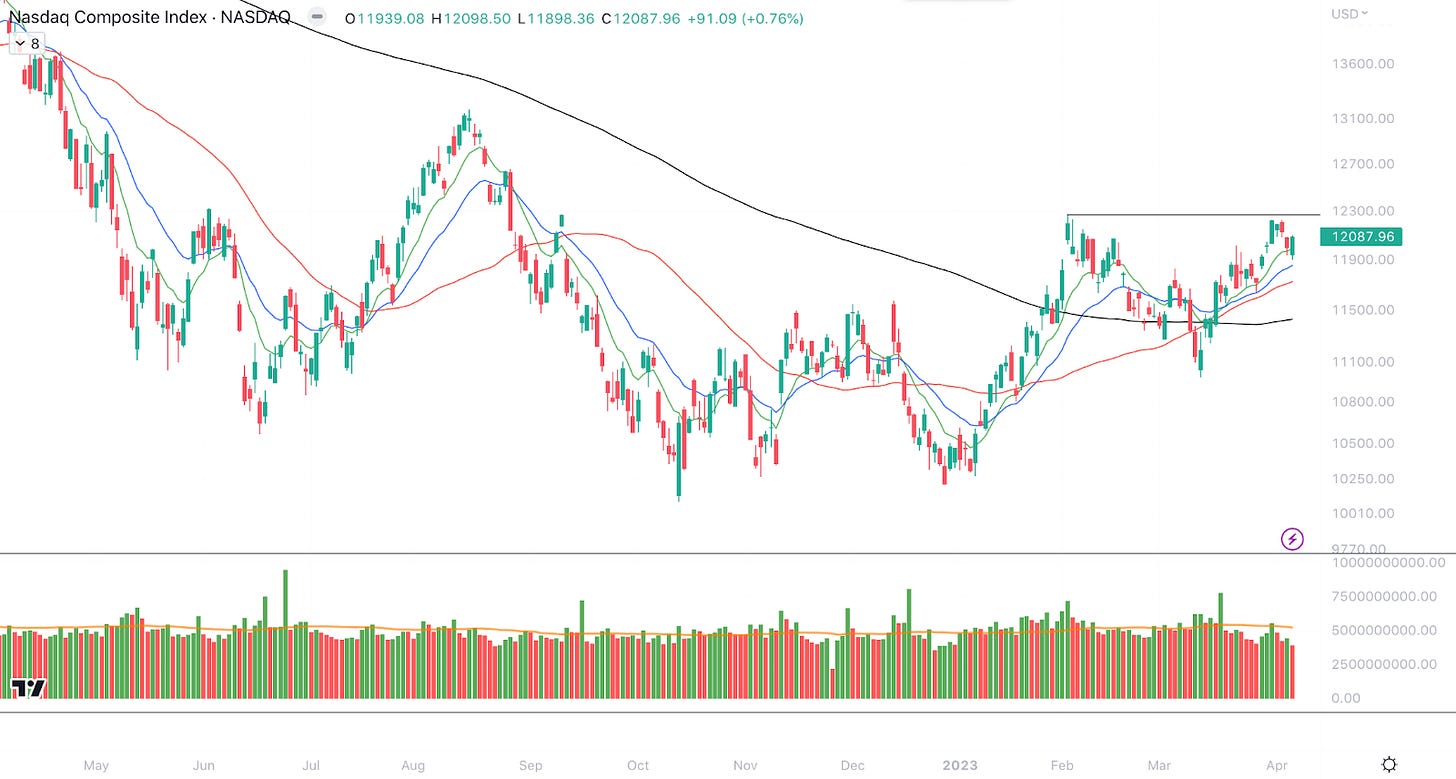
Nasdaq Composite Index, 1D (Tradingview)
Last week we discussed how the Nasdaq had significant resistance looming overhead at ~$12,300. This week, we saw confirmation of this level attracting sellers, as the index was unable to break above this level.
That being said, the index remained very strong and pulled back to its 10-day EMA on light volume before bouncing on Thursday. Despite the index close to flat on the week, we did see a fairly strong week of buying in the Treasury market.
2-Year Treasury Yield, 1D (Tradingview)
Price action in the Treasury market supports this thesis, as yields moved lower surrounding the labor data releases discussed above. As you may know if you’re a consistent reader of the Blockware Intelligence Newsletter, the 2-year Treasury is the most policy-sensitive of government bonds.
The strength being shown from stocks and bonds is likely the result of a shifting future outlook on interest rates. With interest rate raises appearing to have their intended effect on US companies, the Fed may be more inclined to pause their hike cycle.
If market participants are expecting lower rates to come, we’ll generally see a drop in yields (remember that bond prices and interest rates have an inverse relationship). A drop in yields generally has the effect of higher stock prices, as discussed in this newsletter last week.
Heading into next week, the BLS is set to release March’s CPI number on Wednesday (April 12th) before the open.
Bitcoin-Exposed Equities
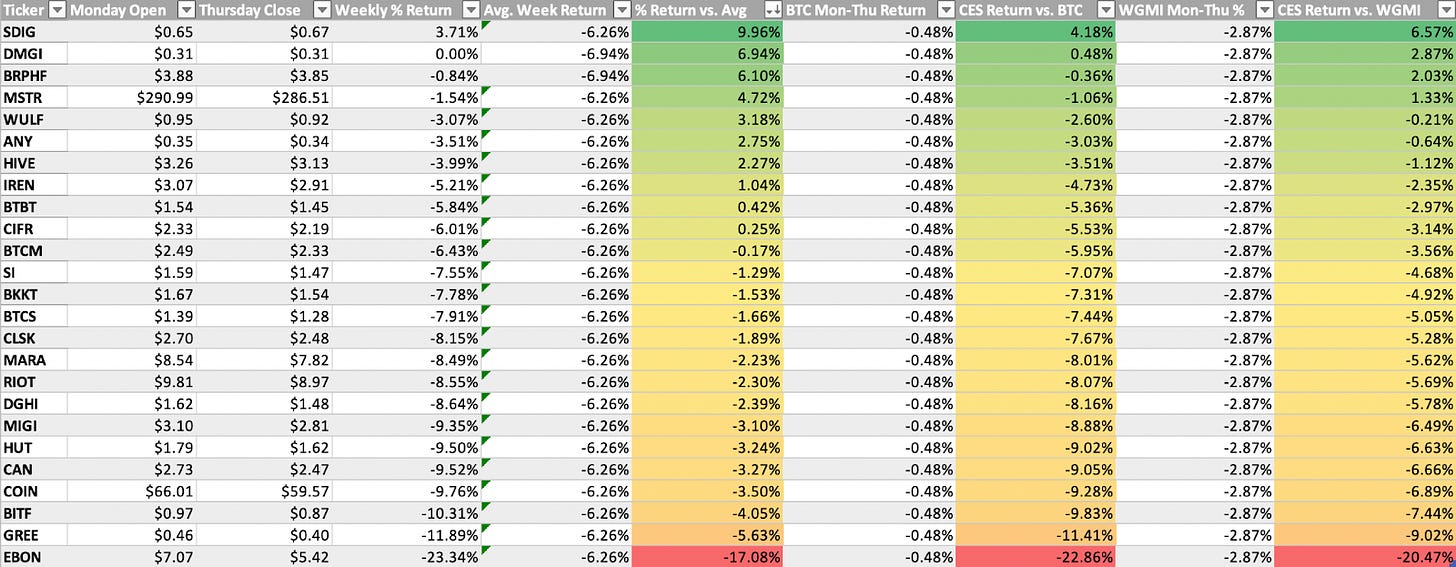
This week, in terms of price action, we’ve seen a very mixed bag from Bitcoin-exposed equities.
Certain names, namely the less liquid ones, broke down to close out the week. Examples of this can be found in EBON, MIGI, and CAN.
Other names were able to remain flat towards the end of the week, or even caught a bounce on Thursday. Examples of these names are MSTR, CIFR, WULF, and IREN.
The breakdown of certain names is a bit of a concern here in the short-term. Throughout 2022 we saw a recurring theme of Bitcoin-equities leading the price action of spot Bitcoin.
If this case is to continue, this week’s equity price action could indicate that BTC is due to break lower. However, this is a secondary indicator and should not dictate your investment thesis, in my opinion.
Above, as always, is the Excel sheet comparing the Monday-Thursday performance of many Bitcoin-exposed equities.
Bitcoin Technical Analysis
The past several weeks have been boring for BTC in terms of price action. But taking a step back, BTC’s price grew by 72.26% in Q1, making it among the best performing assets of the year.
Bitcoin / US Dollar, 1D (Tradingview)
As we’ve discussed for the last few weeks, BTC continues to ride sideways through this range defined by the Summer 2021 lows, and the 10-day EMA.
Volatility contraction is always something that should attract your attention as a technical analyst. Compressions to the trading range indicate an intensifying battle between buyers and sellers, as neither are able to make substantial progress.
As one cohort is able to regain control, we usually see the other group capitulate and flip sides. This leads to explosions of volatility as price shoots to the upside, or breaks lower.
A good example of this for BTC was back in December/January. We saw a period where volatility compressed significantly, and then BTC ripped up through $20,000 and beyond.
Heading into the weekend, continue to keep an eye out for a break above ~$29,000 to signal continued upside. Alternatively, a break below ~$27,000 may indicate lower prices to come in the medium-term.
Bitcoin On-chain and Derivatives
Following last week’s bullish-cross between short-term holder and long-term holder realized price, STH RP continues to trek upwards.
This metric has historically served as support during bull phases as short-term holders tend to defend their cost-basis with buys; so it is reasonable to expect that BTC will not drop lower than ~$22,000. This floor continues to rise as purchases at the current price are increasing the cost-basis of short term holders.
The supply of Bitcoin that hasn’t moved in 2 or more years is reaching new all-time highs every single day.
If you think back two years ago, that was the mania phase of the bull market; with droves of new participants buying BTC. Some of these market participants have come and gone, as is typical with bull markets. However, some of them did the work to learn about Bitcoin, what it is and why it is important, and have HODLed through the peaks and troughs of the past two years.
~1,512,000 BTC was bought during the bull market of late 2020 / early 2021 and hasn’t moved since. Note that because the line is sloped upwards, instead of being a straight line up, this shows that it was not a single entity accumulating at a single point in time (like an exchange), but rather, the accumulation took place throughout the bull market and those coins are now maturing.
Juxtapose this with the 2017 bull market into the preceding bear market, where the amount of BTC last active 2+ years ago diminished as fewer bull-market induced retail participants fled, and more of the older coins sold into the rally.
The signal here is that, based on on-chain data, more users are just buying Bitcoin and being patient. A diminishing number of entities are willing to exchange their BTC for fiat currency. The run up to $69,000 and the subsequent drop to $16,000 have not shaken the confidence of veteran market participants (nor the newly bred class of 2020/21 HODLers).
‘New Entities’ is experiencing positive momentum as indicated by the 30-day moving average > 365-day moving average. The Bitcoin network has received ~120,000 new entities per day over the past thirty days, up ~20% from the yearly moving average.
An increasing rate of new entities joining the network is a sign of increasing demand and trend has historically signaled a shift from bear to bull markets.
Realized Volatility from the past two weeks is on the lower side of things. This isn’t surprising to anybody that has been paying attention to price as it’s been relatively calm recently.
Realized Volatility tends to reach this low of a level right before a large move; so be on guard. Given that overall on-chain structure points bullish, I would not be surprised if the next move is another leg up. Although it’s certainly possible that the next move could be down due to macro uncertainty as well as the fact that the Fed’s balance sheet has shrunk two weeks in a row; liquidity tends to be a good indicator of which direction Bitcoin will trade.
By analyzing Perpetual Futures Open Interest (the amount of $ in non-expiring futures contracts) relative to Market Capitalization, we can gauge how much leverage is outstanding relative to the size of the market.
High OI relative to MC means the market could be vulnerable to a short-squeeze or liquidation cascade, which would result in a price swing being more volatile than it otherwise would have been due to forced buying or selling respectively.
Because Perpetual Futures are non-expiring contracts, periods of sideways price action can result in a build up of open interest as existing contracts remain open while new ones are opened simultaneously. Note the period of relatively sideways price action preceding the FTX implosion.
BTC has essentially traded sideways for the past three weeks, yet, we haven’t seen a build up in open interest. This is a signal that the market is still in a risk-off mode. Moreover, the medium-term trend of decreasing OI / MC has not been broken, which is reassurance that, even in the event of downwards volatility, price is most likely not going to decrease to the level it was at to begin the year.
The funding rate for perpetual futures contracts has flipped negative today, continuing a mixed regime. Mixed funding indicates uncertainty among derivatives traders about the near term direction of the price. Couple this with the decreasing Open Interest relative to Market Cap and it further confirms that a risk-off appetite is present.
Bitcoin Mining
Foundry USA Pool No Longer Has 0 Fees
After the China mining ban, Foundry USA became the largest Bitcoin mining pool in the world as ASICs fled China for North America, and large public and private US miners pointed their hashrate to Foundry as they charged 0 fees.
Below are the new pricing tiers offered by Foundry. An important point to note is how much hashrate is required just to start receiving any sort of tiered discount. 150 PH/s is nearly 1,500 S19j Pros, which is a pretty significant amount of hashrate, unless you are one of the public miner behemoths.
S19 Had a Tough Last ~ 8 Months
Earlier this year, Blockware published Pricing ASICs, a valuation model for bitcoin mining rigs. Looking at the historical price action of the S19 model, you can see the price of the machine has been highly correlated to the price of BTC since it was released.
Over the last 8 months, it has been a tough environment for miners holding this model as the market price has fallen from $5,000 to $1,900, falling significantly more than the price of BTC has dropped. However, if we are on the cusp of another bull run, it’s possible we see the USD price of this rig trend up and its BTC price trend sideways, which would be ideal for miners moving forward.
Energy Gravity
The following chart is based on a previous Blockware Intelligence Report that models the relationship between Bitcoin's price and its production cost. The model makes it easy to visualize when the price of Bitcoin is overheated or bottoming.
All content is for informational purposes only. This Blockware Intelligence Newsletter is of general nature and does consider or address any individual circumstances and is not investment advice, nor should it be construed in any way as tax, accounting, legal, business, financial or regulatory advice. You should seek independent legal and financial advice, including advice as to tax consequences, before making any investment decision.


