Blockware Intelligence Newsletter: Week 11
Bitcoin pulling back after setting new all time highs, what's next?
Dear readers,
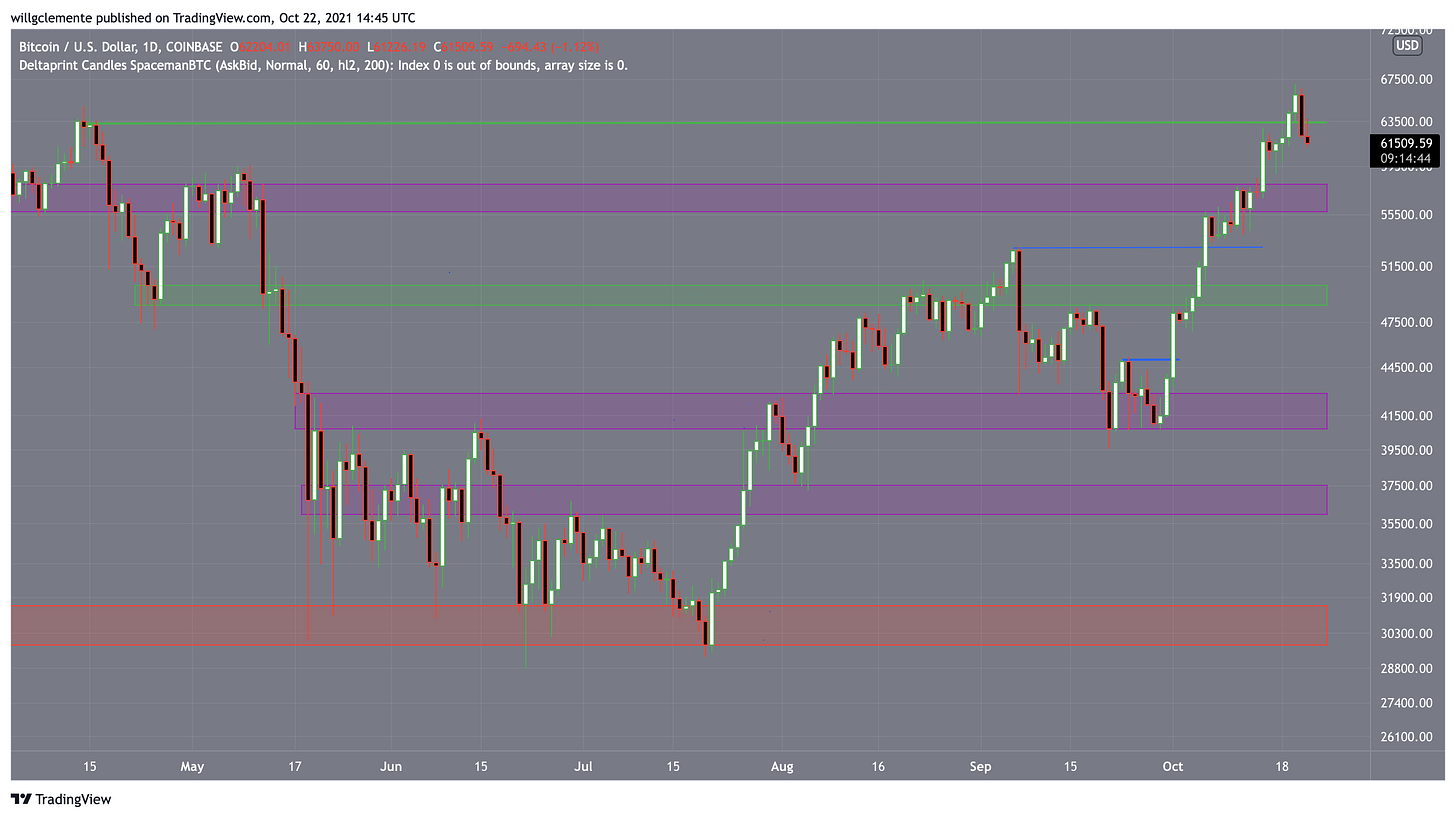
Hope all is well and you had a great week. Coming off last week’s all time high daily close, Bitcoin has reached new all time highs of $66,999 on Coinbase. Since then we’ve seen price correct, reaching as low as $61,200. Let’s dive into the dynamics behind this recent price action and what to look for as we presumably move higher towards the end of the year.
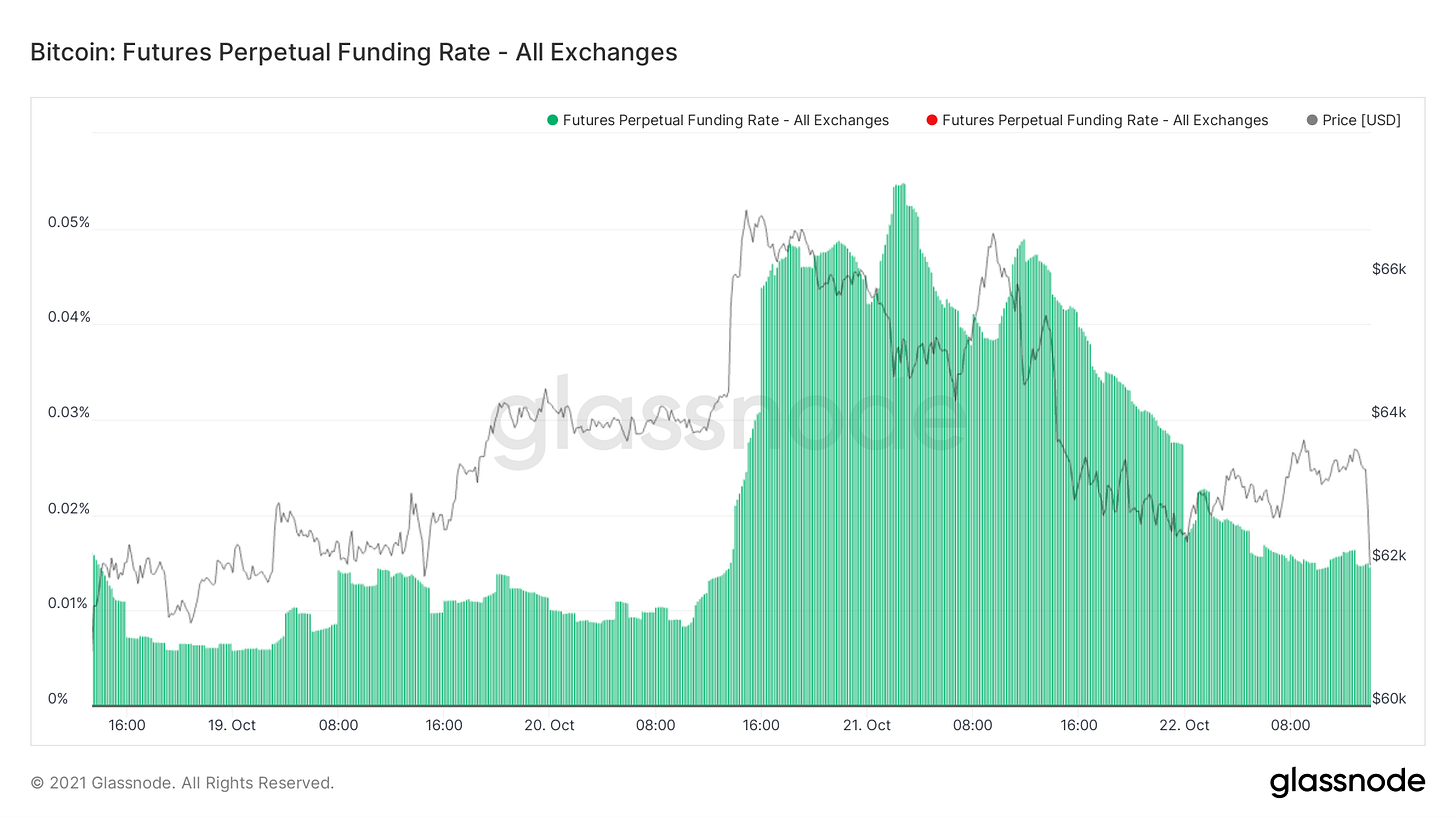
Following the all time breakout we saw a massive influx of leverage come into the market. This was evident through leverage ratio (OI/Exchange balances), high open interest (specifically COIN margined open interest), tight liquidation levels, and of course funding rates. Funding reached upwards of 150-175% APR on some exchanges, which is not sustainable. Where I really became concerned (I tweeted about this Wednesday night) was when funding was rising as price was grinding down. These dislocations between price action and funding are where I find using funding as a tool most useful. Seeing this dynamic meant that the effort perps were exerting to push price up was being overwhelmed by selling from spot. In other words perp traders were longing the dip on leverage.
This cleansing is not surprising and there were several early warning signs that this would occur. (not that you can ever have 100% confidence)
After this correction, following briefly reaching price discovery, we now have a bit of overhead supply, although still minimal. Currently only 1.59% of supply is overhead.
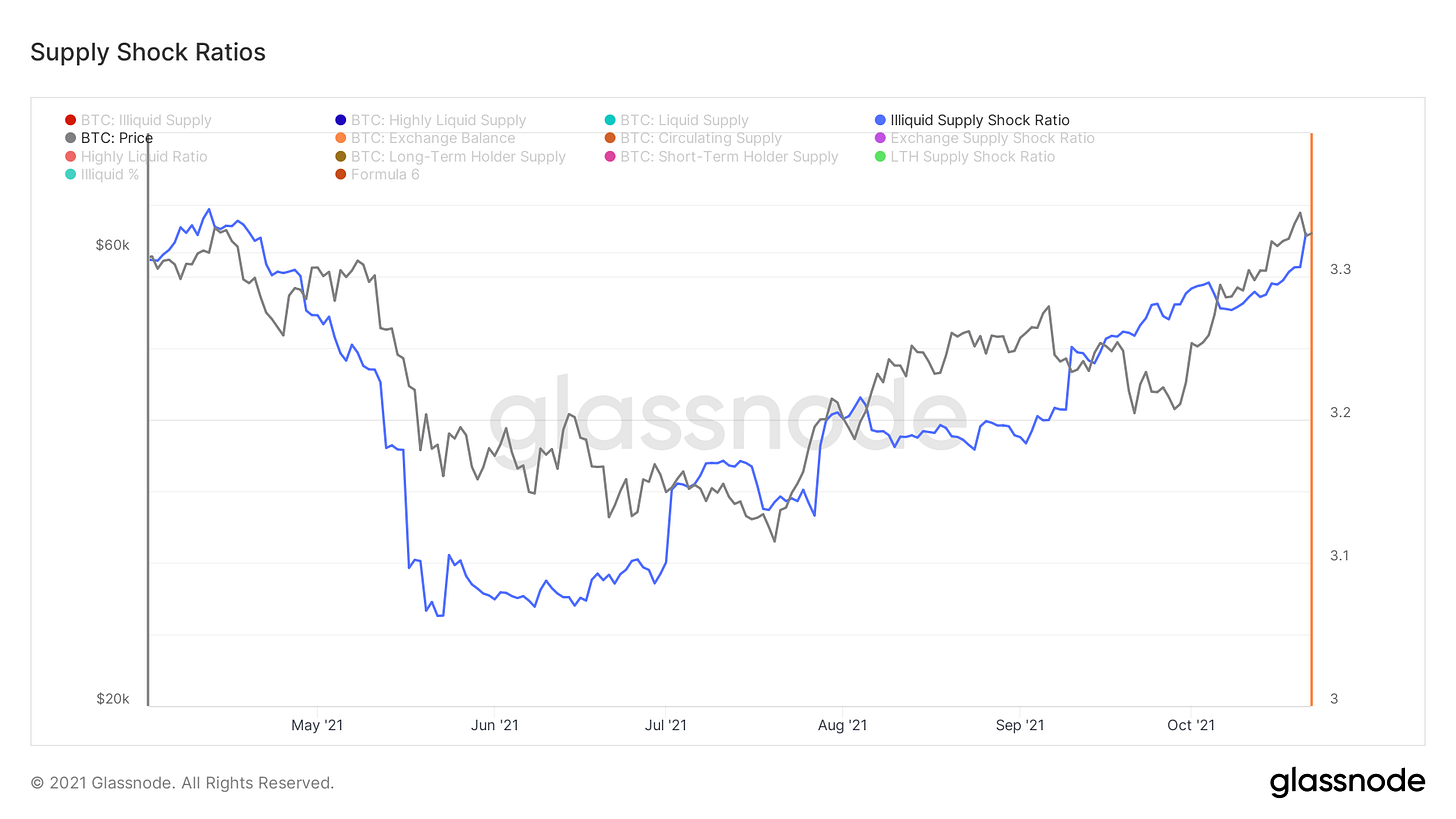
Looking at my illiquid supply shock ratio, we’re continuing to see supply move to on-chain entities with minimal history of selling. (<0.25% of the coins they take in) This is a leading indicator, showing that although we’re experiencing a short-term correction/leverage flush, the mid-longer term picture remains unscathed.
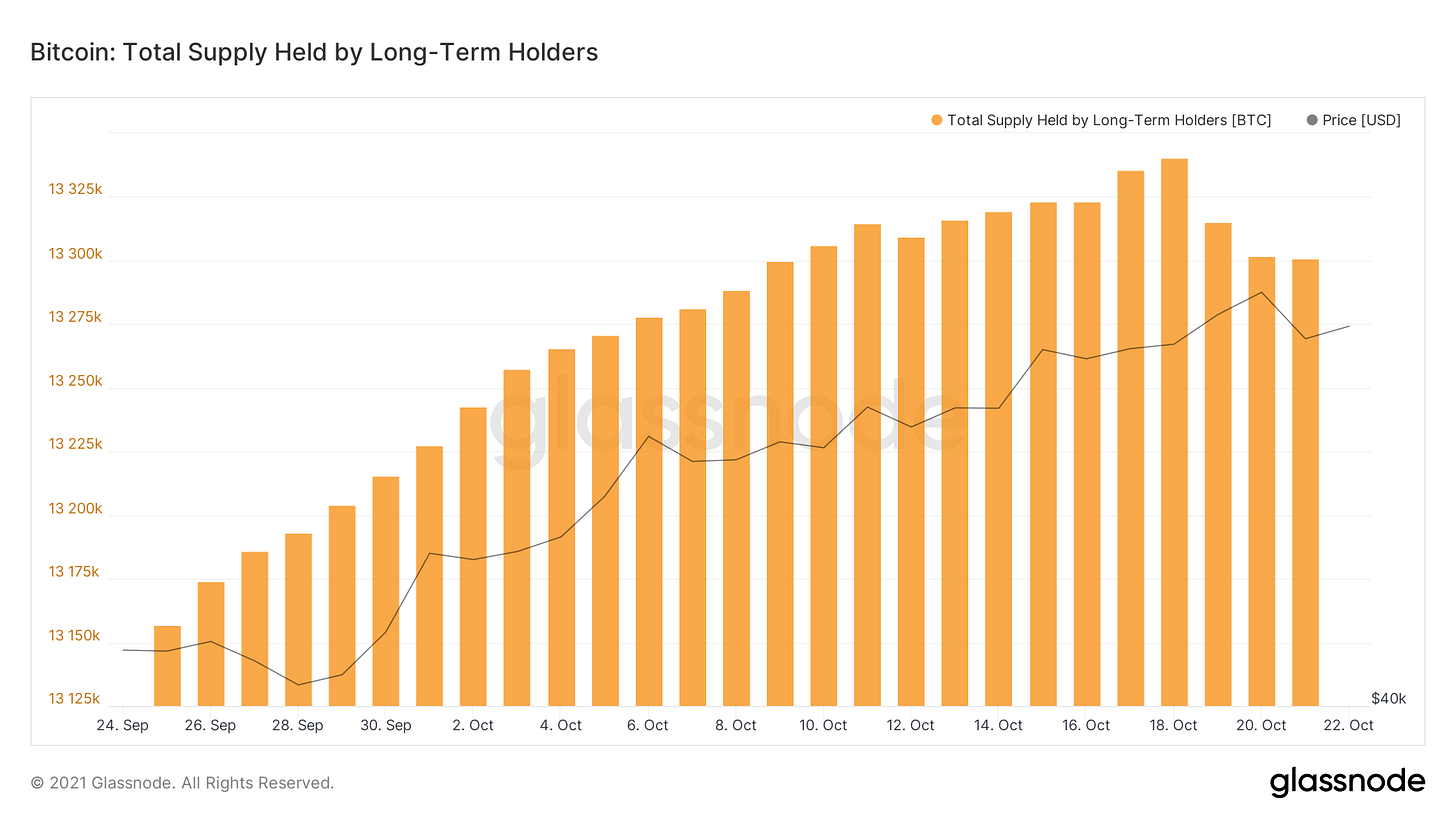
We have been following the behavior of long term holders (entities who have held their BTC for >155 days) for months now, going all the way back to summer. After reaching all time highs in the long term holder supply shock ratio (very macro bullish), we are finally starting to see these LTHs begin to distribute. We have been expecting this.
As we’ve talked about, long term holders buy into weakness, and sell into strength. They don’t perfectly buy the cyclical bottoms and they don’t perfectly sell the cyclical tops. Seeing this distribution (long term holders selling their bags to new market participants) is natural Bitcoin investor behavior and I suspect we’ll continue to see long term holder’s supply decrease.
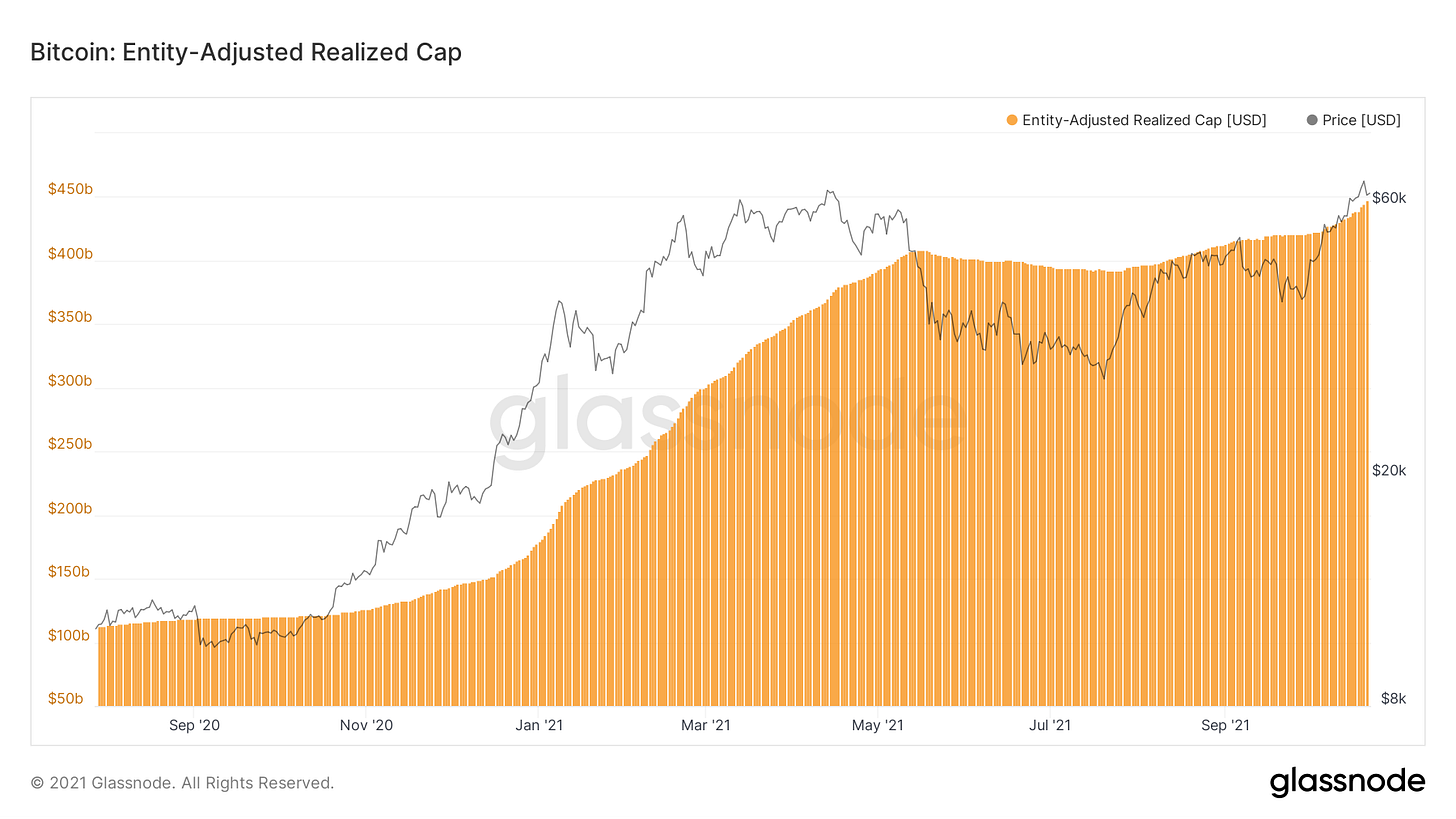
Entity adjusted realized-cap has reached another all time high, now at $447.5B. Dividing realized cap by supply, we get realized price which sits at an all time high of $22,600. Realized cap is the capitalization of Bitcoin based on the last time a coin was moved; in other words it’s a way to measure the amount of value stored in the Bitcoin network. Seeing this decline over summer meant investors were realizing losses, but now seeing RC back in an uptrend means that coins are realizing profits as new capital inflows enter the market and absorbs those realized gains.
With this in mind, let’s check out some ways we can utilize realized cap moving forward to identify when the market becomes overheated, as we presumably see higher prices over the coming months.
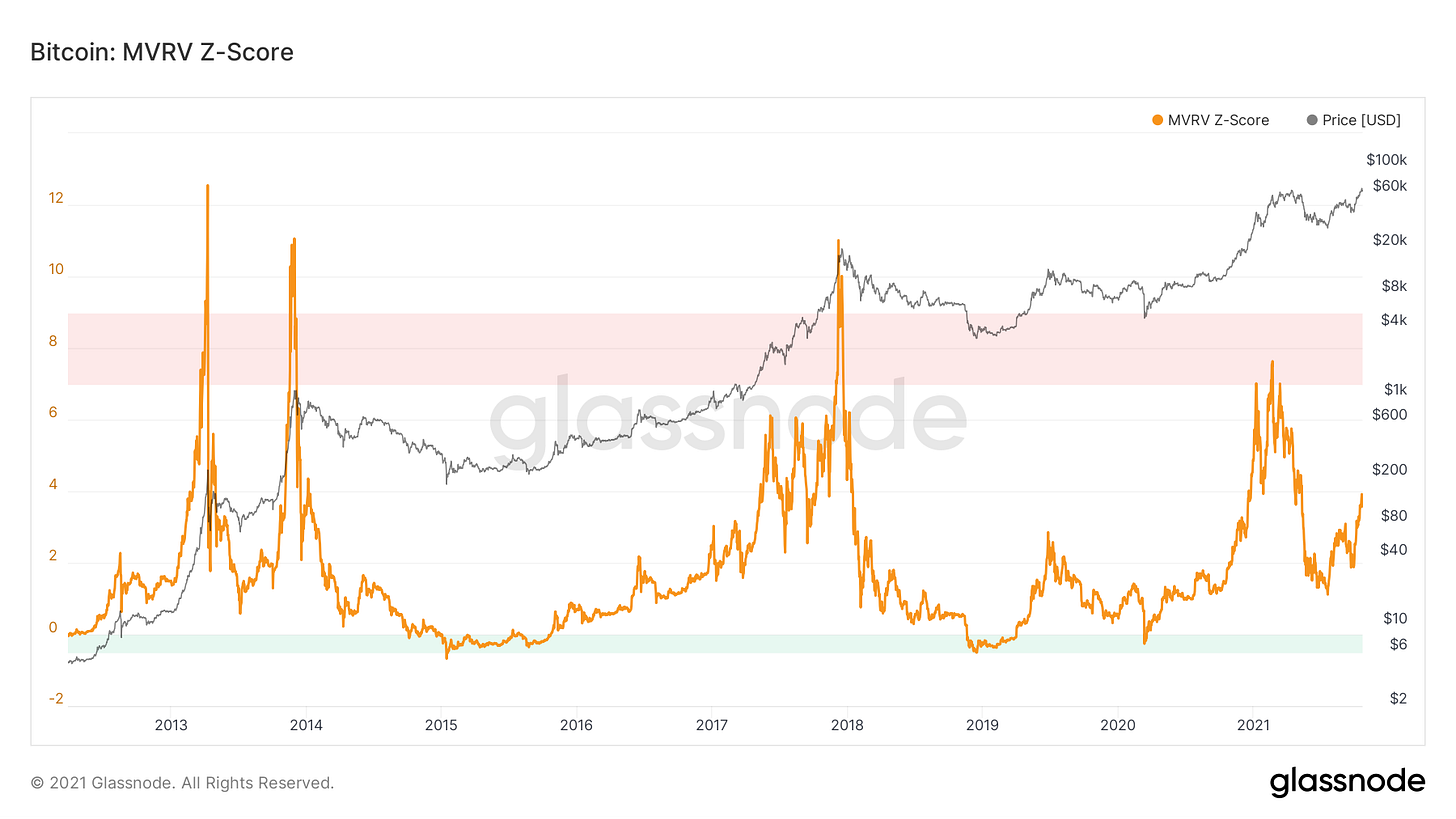
First off we have MVRV; market value to realized value. This illustrates when the marginal bid far overshoots the actual cost basis of investors or value stored on-chain. Z-scoring this ratio (adjusting it for volatility) has given very clear top signals in the past. Note we never reached a true overheated peak earlier this year and are starting to climb back upwards after almost a full reset over summer.
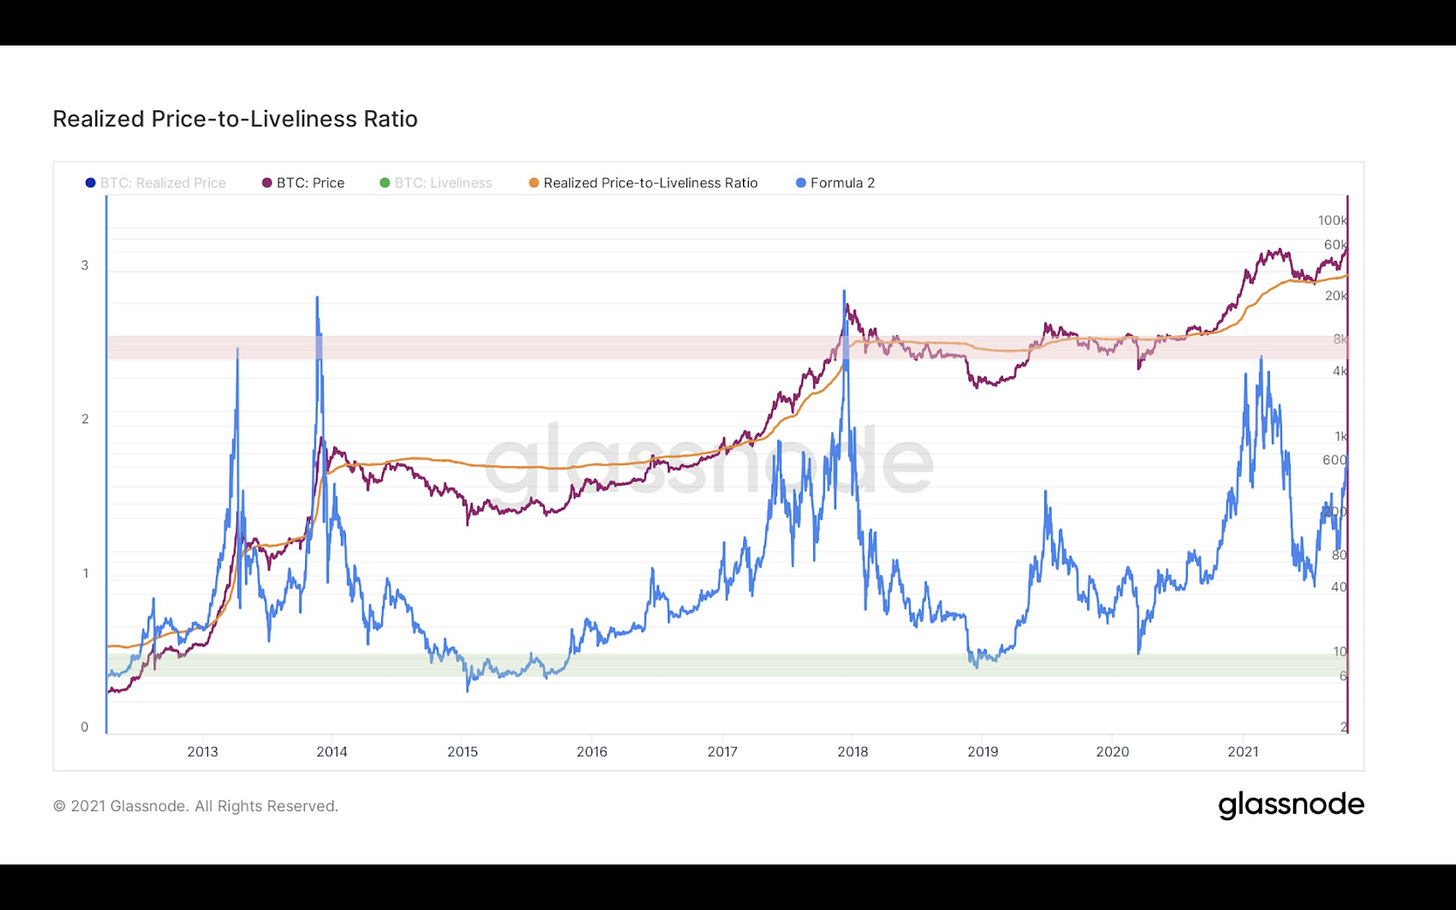
Next up, we have a crossover between realized cap and liveliness. We’ve talked about liveliness in depth and I’ve put out a twitter thread including an explanation of it before, but essentially it is a ratio of coin day destruction/creation; as a way to gauge accumulation/distribution trends. Taking a ratio between realized cap and liveliness gives us the orange line, which has historically been a key level that Bitcoin’s price has interacted with.
Going a step further, we can then divide Realized price-Liveliness by price itself, giving us the blue line. This ratio has provided some good de-risking zones, as well as accumulation zones in bear markets.
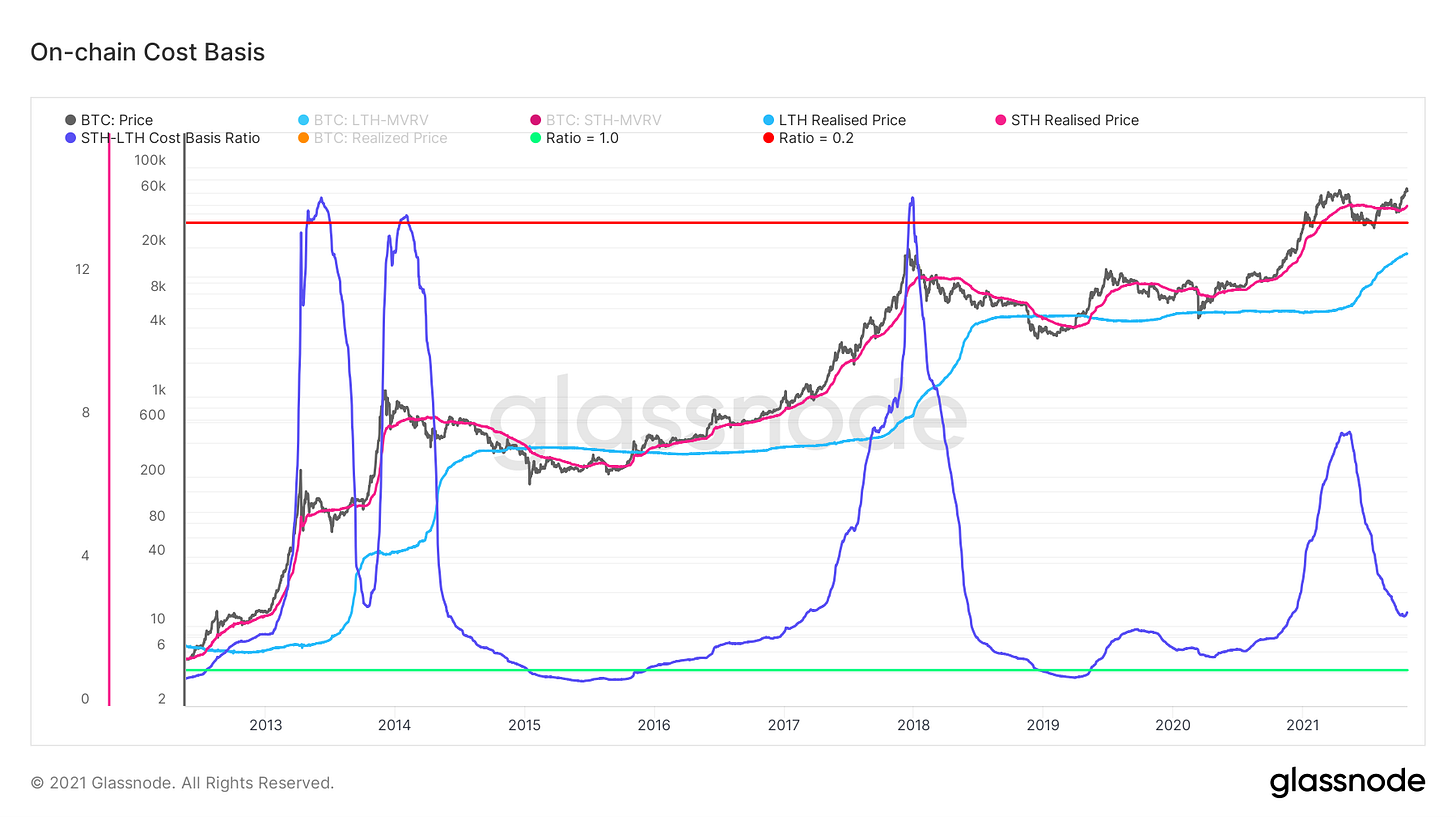
Next up we have on-chain cost basis. This looks at long term holder realized price (or cost basis) and short term holder realized price (or cost basis). When long term holder cost basis breaks above short term holder cost basis, it has historically been a great time to accumulate. In addition by running a ratio between long and short term you get the dark blue line. This ratio can be used to identify times to de-risk in the bull market as well as accumulate in the bear market.
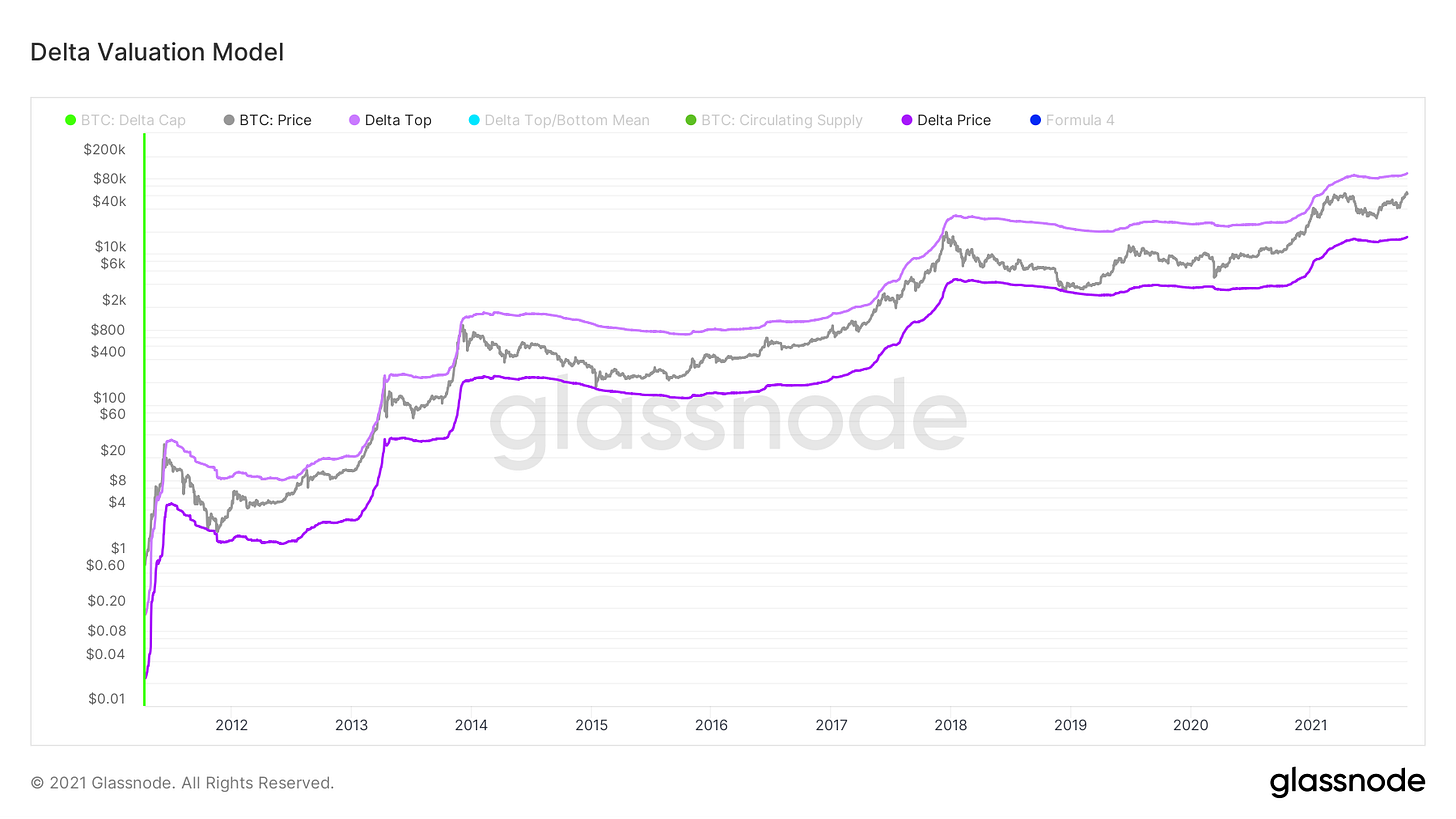
Last but not least for this week we have our delta valuation model, which I introduced a few weeks back. Delta cap (dark purple line) is the difference between average cap (all time moving average capitalization of Bitcoin) and realized cap. This has been a conservative floor estimate and has never been broken. Taking a multiple of this, we get the delta top line, which has also been a pretty accurate way to model macro peaks for BTC. This currently sits just above $117,000, but because it is partially based on mean reversion, would slope upwards if we see continued price appreciation.
These are just a few of the on-chain metrics that I would be eyeing to try to identify when price is starting to get overheated. Other metrics such as Market-cap to Thermocap, Reserve Risk, RHODL ratio, etc. I often get asked “WHEN will the top be?”The key takeaway I want to leave you with is that I find it more useful to watch out for specific investor behaviors rather than time itself.
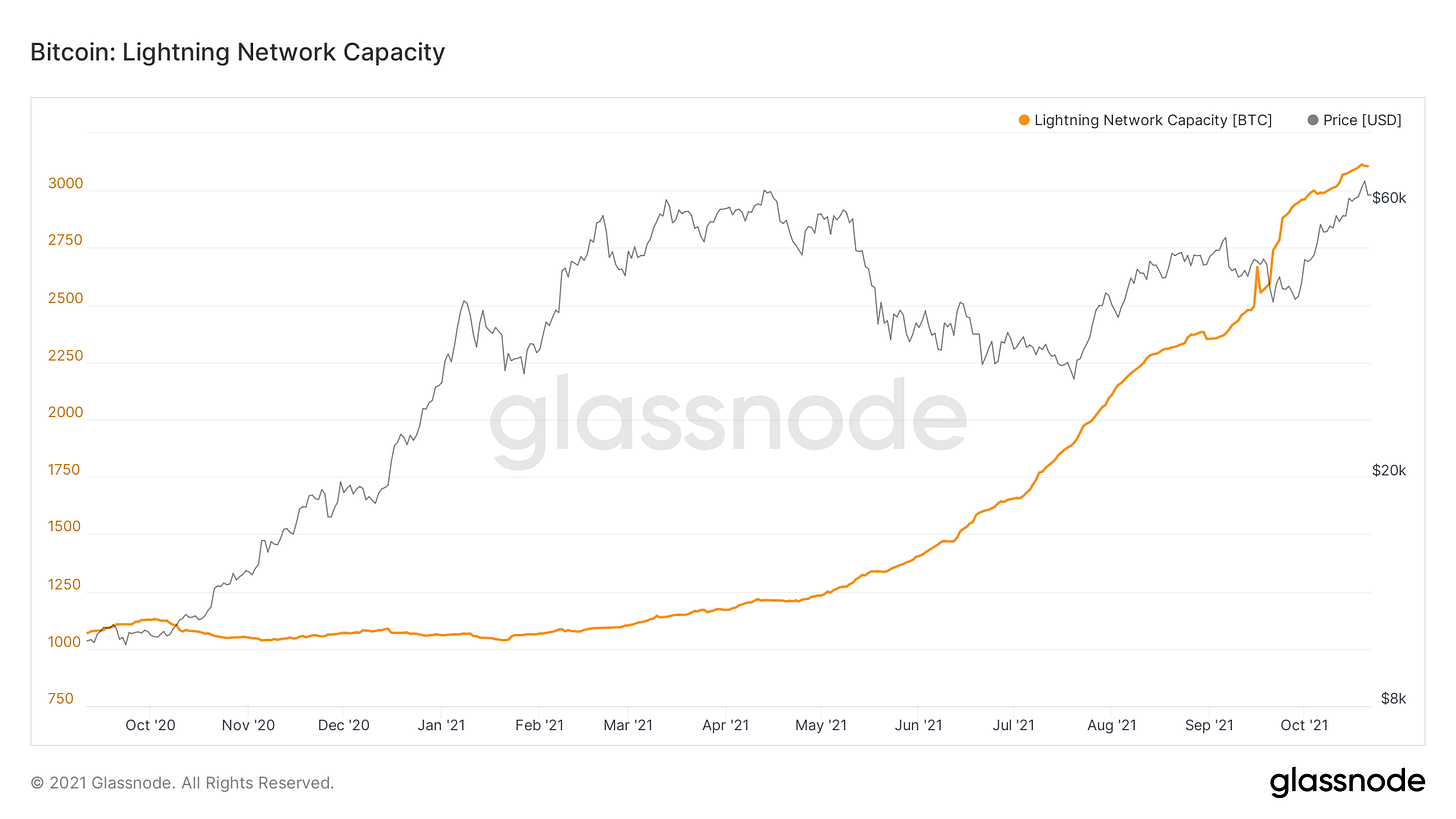
Last, we take a look at the lightning network capacity. This has exploded throughout the year, reaching new all time highs of 3,123 BTC this week. Although still small, it is very cool to watch capacity grow, as lightning will be crucial for Bitcoin to transition towards a medium of exchange.
Bitcoin-Related Equities: By Blake Davis
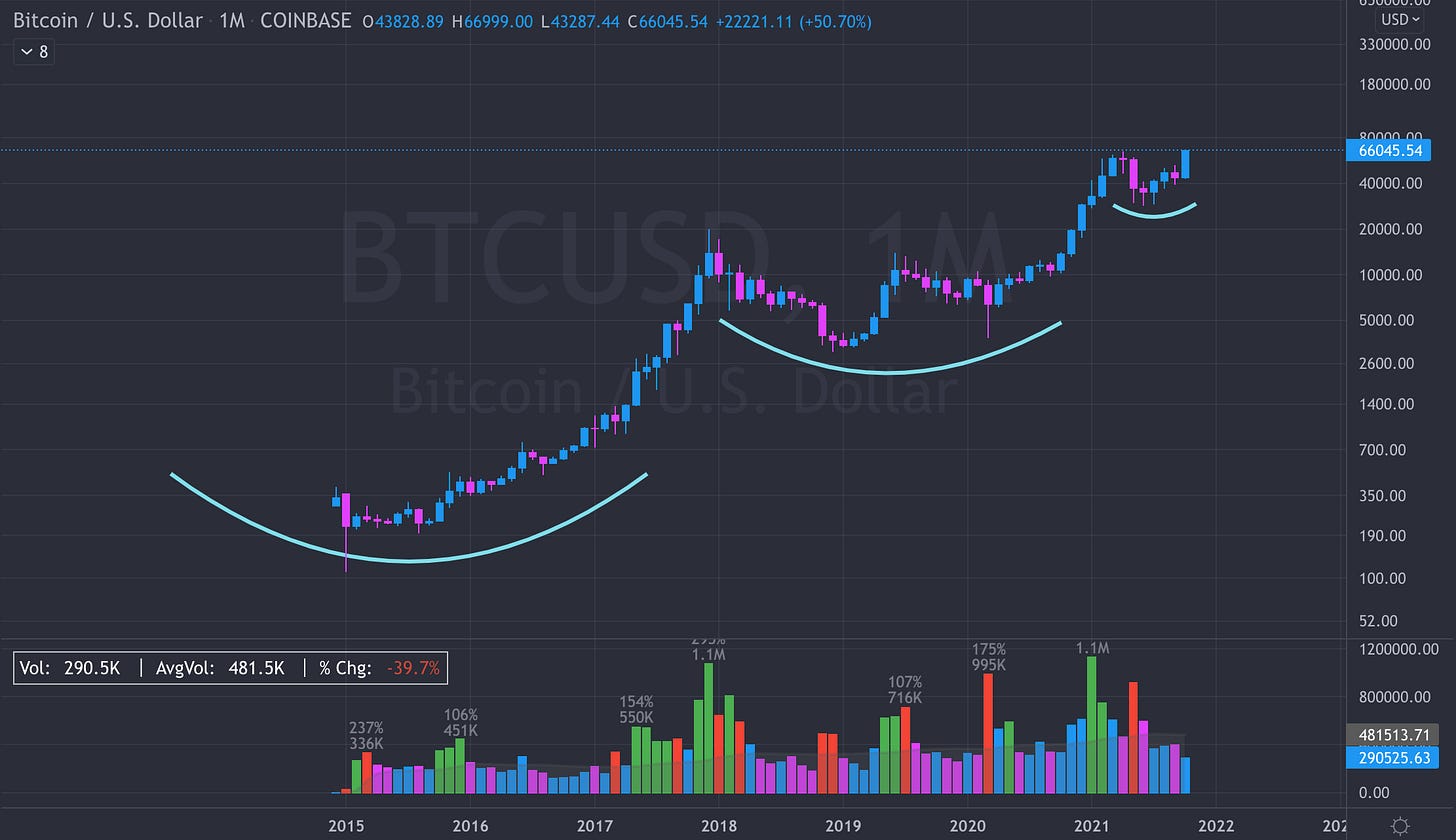
With Bitcoin entering a new phase of price discovery now is the time to be paid for the work we’ve put into identifying leaders. The combination of the market indexes tearing towards new highs and Bitcoin already cracking all-time highs is an environment with a ton of potential headwind for crypto-exposed equities. As we’ve learned from past studies of these crypto stocks, they on average follow the price action of Bitcoin to a factor of 1.00. This means that with BTC moving into new high ground, it’s likely that a crypto-exposed equity will do the same. If we calculate beta using the S&P as comparison we get about 11.6. This means that these crypto-exposed stocks follow the price action of BTC roughly 12x closer than they follow the S&P. This monthly logarithmic view of Bitcoin below shows a multi-year cycle that, in my opinion, looks to be aiming for higher prices through the remainder of 2021.
This is why it is so important for investors in crypto-exposed names to keep an eye on both BTC and the equities they hold. I like to employ the strategy of mostly watching BTC, when it appears to me that it could be gearing up for a move higher I switch my focus to watching individual crypto stocks and find places to enter. The best time to buy is when something enters new highs after a 7+ week base. Basing is when stocks (or cryptocurrencies) wear out investors with weak hands and take eyes off the name to create opportunities for demand to return once it breaks back out. Assets that make new price highs are most likely to continue to make new highs, which is why buying all-time highs is a strategy that has been extremely successful for investors. Most people are scared to buy into all-time highs, thinking that price has run up too much off the bottom for them to be buying now. In reality, buying near the bottom is much more dangerous due to the concept of overhead supply.
When price is beaten down, there will always be people who bought higher, who are waiting for price to run up just so they can dump their position and come out at break-even. The amount of supply waiting overhead can be massive, and make it very hard for price to reach back into highs. To be an objective observer of the markets, we need to train ourselves to think in terms of price action. If you believe Bitcoin is going from $60,000 to $200,000+, it’s going to need to break into all-time highs numerous times before it gets there. In terms of risk, the area of all-time highs is actually a low risk area to be buying. Think about it, everyone who has ever bought shares and held them until now are in profit, so overhead supply is zero. This naturally creates a lower risk area to buy stocks because the only sell pressure will be shorts (who can be squeezed if price action is strong) and profit takers.
I’ve discussed this almost every newsletter but this week is exactly why the concept of relative strength is so important. We’ve spent the last few months trying to identify the strongest names in the industry group so that when they break out, we know which ones are most likely to give superior returns. At this time, there’s a solid handful of names who appear to have more horsepower than the rest of the group. Notice how the names I’ve discussed every week have been pretty similar. If we’ve seen the same names acting strong every week for months, it’s pretty fair to say that something is going on there. Institutions are clearly attributing value to these companies and are accumulating shares. When we see huge volume with prices heading north, financial institutions buying stock are what make that happen. Bill O’Neil once said, “That isn’t your Aunt Sally buying”.
If I had to identify the top-tier names, as of writing on Thursday, I would rank them in the order of:
1. COIN
2. MARA
3. HUT
4. SI
Aside from these select crypto-related names, there are few companies who are simply exposed to crypto who also have good looking charts. AMD, TSLA, SQ, NVDA, and CME are some names that come to mind on this front.




Nicely written, I particularly liked the bit about buying ATH's - you've got a good point!
Great analysis. Cheers guys👍