Blockware Intelligence Newsletter: Week 37
Bitcoin on-chain analysis, mining analysis, equity-analysis; overview of 5/7/22-5/13/22
Blockware Intelligence Sponsors
If you are interested in sponsoring Blockware Intelligence email: sponsor@blockwaresolutions.com.
FTX US - Buy Bitcoin and crypto with lower fees on FTX. Use our referral code (Blockware1) and get 5% off trading fees.
Blockware Solutions (Mining) - It is difficult to buy ASICs, build large mining facilities, and source cheap scalable electricity all on your own. Work with a trusted partner like Blockware to deploy capital into Bitcoin mining.
Blockware Solutions (Staking) - Ethereum 2.0 is almost here, now is the time to stake your ETH with Blockware Solutions Staking as a Service to take advantage of 10-15% APR when the Ethereum network switches over to Proof of Stake.
Summary
The announcement of new CPI data on Wednesday showed a 8.3% increase in consumer prices from April 2021, 20bps over estimates. The real concern is the steadily increasing Core PPI which is a leading indicator of CPI.
10-year Treasury yields have fallen slightly this week hinting at a potential bounce in the fixed-income bear market, as of Friday morning equities are attempting to follow suit.
The Nasdaq Composite and S&P 500 have been extremely oversold, increasing the likelihood of a short-term rally before a probable third leg down.
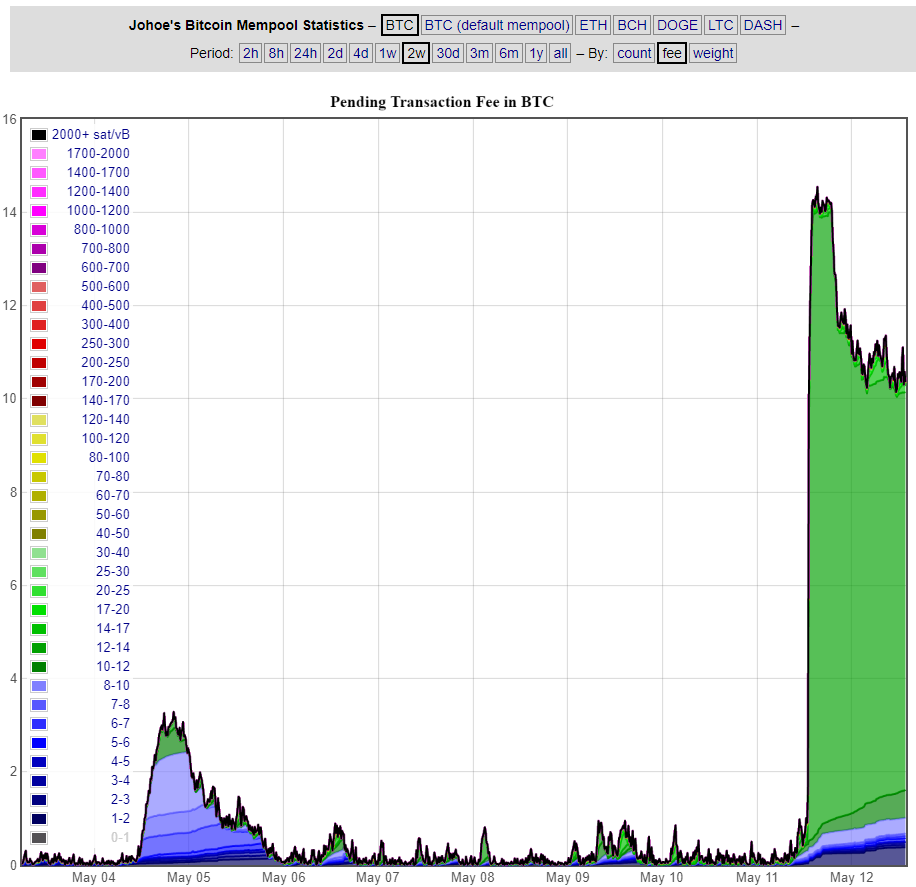
Bitcoin transaction fees saw yet another huge jump this week. Pending transaction fees in the mempool reached a level not seen since May 2021 due to Binance UTXO consolidations.
Bitcoin is approaching a potential inflection point where old-generation mining rigs like S9s may become unprofitable even at competitive electricity rates. If the price falls further and these rigs turn off, mining difficulty could adjust down, making new-gen rigs earn more BTC.
General Market Update
It’s been another bloody week of price action in the general market, which shouldn’t have been a shock if you’ve read this newsletter at any point in the last 5 months.
The release of new Consumer Price Index (CPI) data was the big news this week on the macro front. As a reminder, CPI measures the price for a basket of goods that are commonly consumed by everyday citizens and then compares that to the price of that basket one year ago.
This is then converted into a percentage which gives us an estimate of how much inflation consumers have felt over the last year. But CPI is a flawed metric that generally vastly underestimates how much purchasing power has truly decreased.
The issue is that, like most things, CPI is calculated in a centralized environment by officials who need to keep politicians happy to keep their jobs. That basket of goods is adjusted often to reflect “updates in consumer preferences” when in fact these new goods only work to keep CPI numbers lower than reality.
But the fact of the matter is that CPI is widely used by market participants so it will inevitably have a large impact on investment behavior, regardless of whether it is flawed or not.
CPI 1M (Bloomberg)
On Wednesday, CPI data for April came in at 8.3%. This was 20bps (0.20%) lower than last month, sounds bullish right? There’s a few possible reasons as to why the market fell on news like this.
The first is that much of the market operates based on assumptions. Many institutional estimates for this month were that CPI would come in at 8.1%. Therefore, a higher print than expected is a sign that inflation isn’t slowing down quite as quickly as people had hoped, and lead to further selling.
Secondly, and in opinion most importantly, is that we’re in a bear market. In general, news shocks will tend to affect the market in the direction of the trend. In a bull market, most news stories, regardless of their level of bullishness, will draw buyers into the market for one reason or another. The opposite is true in a bear market.
This is also the reason why companies may report strong earnings in the midst of a bear market, yet see stock prices plummeting. This is something that dumbfounds new investors, yet we see it time and time again. It only further emphasizes the age old trading quote to “Never fight the trend”.
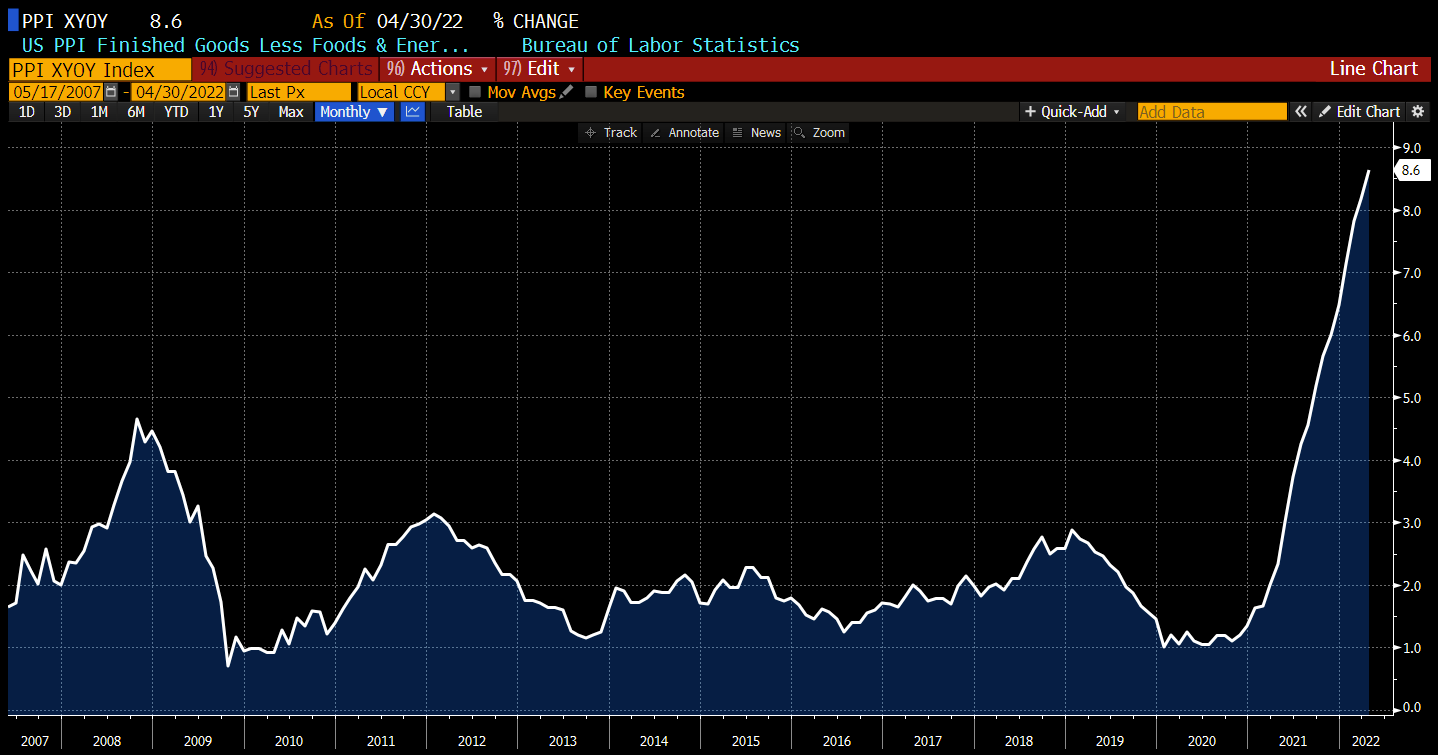
Data for another inflation metric called the Producer Price Index (PPI) was also released on Wednesday morning. PPI is calculated by comparing the price of a basket of inputs (raw materials, capital goods etc.) to their price one year ago.
Instead of seeing how much inflation the average American consumer has seen since 2021, we’re now looking at how much inflation the producers of the goods that we consume have felt. This is important because producers generally feel inflation first and then are forced to raise the prices of their products, in turn causing consumer inflation.
Core PPI 1M (Bloomberg)
Core PPI, which subtracts energy and food costs from regular old PPI, came in at 8.6%. This was the 18th month in a row of increased PPI, which is a concern because, as we’ve just discussed, PPI is a leading indicator of CPI.
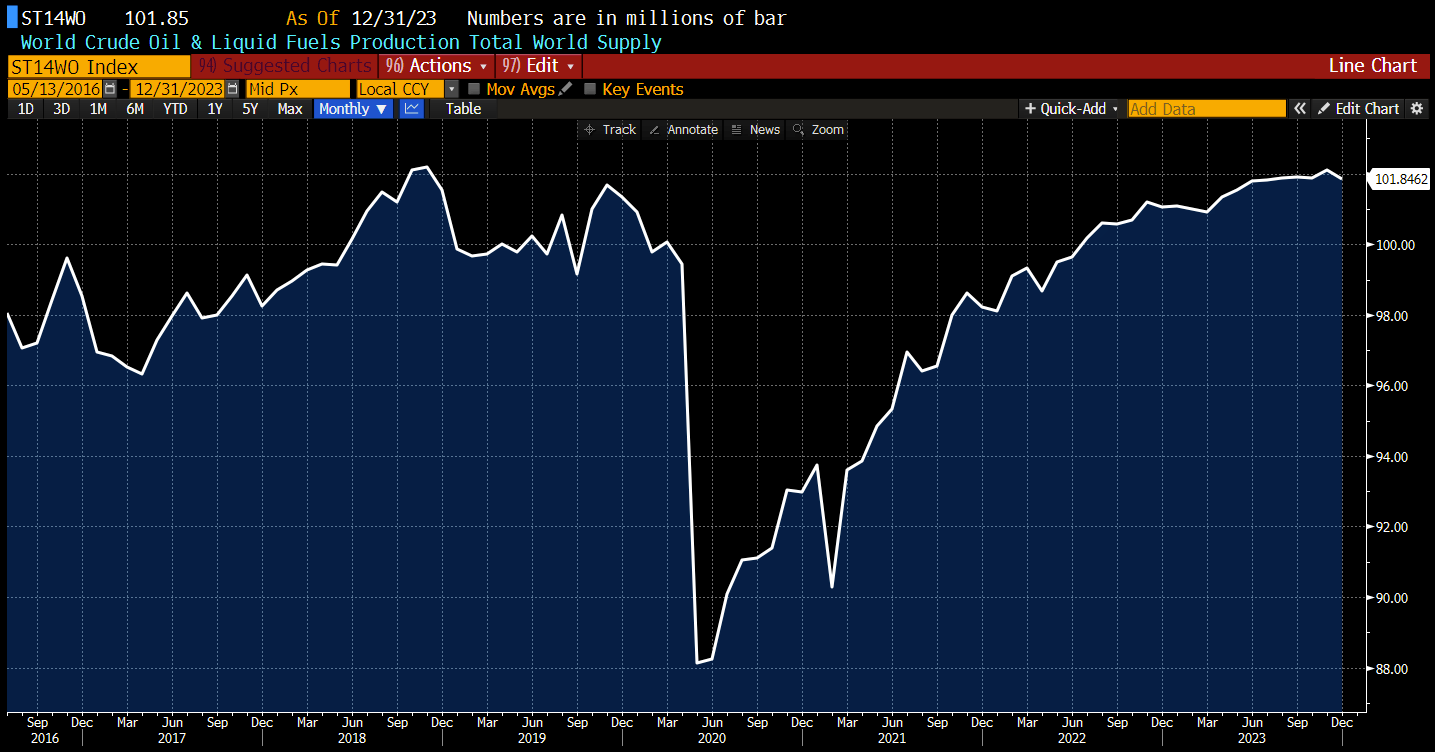
Crude oil has held up fairly well, which isn’t too shocking given this environment. Prices are essentially being propped up by a flattening total world supply.
CFDs on WTI Crude Oil 1D (Tradingview)
If we examine the basic macroeconomic supply and demand graph we’ll see that when supply decreases while demand remains stagnant, prices will rise as consumers compete for less oil.
Crude Oil and Liquid Fuels Supply (Bloomberg)
The two main reasons for this are sanctions on the export of Russian oil, which accounts for roughly 10% of the world supply, and the fact that with higher interest rates, oil producers have less cash on hand to deploy towards production.
Interestingly, bond yields have been fairly correlated to the stock indexes this week. Remember, bond prices and yields move inversely, so when yields are falling then bonds prices are rising.
Because we saw a sell off in equities, accompanied by a bid for bonds, it would appear that investors are valuing the safety of bonds over equities but at this point. But four days of bond buying isn’t enough to get me too optimistic.
10Y Treasury Yield (Bloomberg)
Although we’re seeing a bounce today, the stock market is essentially unchanged from the perspective this newsletter has been sharing for the last several months. There is extreme weakness among tech stocks as institutions continue to de-risk.
Yet despite the sell-off in equities, we’re still yet to see mass capitulation. Selling has undoubtedly been persistent but not quite extreme.
The indexes have circuit-breakers, which halt trading for a period of time if the index has fallen a certain percentage that day. These help to slow down selling and allow people to cool off for a few minutes.
In an extreme panic driven sell-off, circuit breakers are often hit (15 minute break once we’re -7% for the S&P). We haven’t come very close to needing that in this market but we did in 2020.
We have been very oversold among the indexes which made the likelihood of a bounce increase, as we’re now seeing on Friday. If you follow me on Twitter you would’ve seen a discussion of this on Monday.
In my opinion, this is simply a short-covering rally, also known as a deadcat bounce, but we must always remain open to all possibilities. One argument for the bottom being in is that everyone and their brother is saying that we haven’t seen true capitulation yet, generally when there's a widespread belief (and everyone thinks they’re a genius), it won’t happen.
I believe that the most likely scenario is a rally back up into the flat/declining moving averages before running into resistance to create our third leg down. Three legs down is a very common shape that bear markets tend to take, but don’t hold me to it.
IXIC 1D (Tradingview)
This is assuming that the market will put in a formidable rally here, of course it is also possible that this doesn’t turn into a multiple week rally and we continue on this 2nd leg down.
Market breadth has been poor as the number of advancing stocks is very low.
Nasdaq with A/D Line (Marketsmith)
Above, the solid blue line is the Nasdaq’s Advance/Decline line, which tracks the number of Nasdaq stocks that are up on the day, or down. You can see that the A/D line is indicating extremely poor breadth, with only ~400 of the 3,500+ Nasdaq stocks advancing.
Furthermore, sentiment is pretty poor too. You can think about sentiment as essentially the current mood of market participants, are they overwhelmingly excited, nervous, euphoric or panicking?
In order for the market to bottom, sellers need to be exhausted, meaning sentiment needs to be so bearish that all who would’ve sold already have.
It doesn't necessarily mean that the market has to crash in a scorched earth event, but just that selling needs to be profound enough that it slows and buyers can steal the reins.
The market is designed to punish those who are undisciplined and emotional. At the dead bottom, you’ll always see weak investors finally give into their fear and dump their losing positions, this is precisely the moment when the market will turn around and leave them in the dust.
One metric I commonly use to gauge market sentiment is the Equity Only Put/Call ratio, which compares the number of open “put” derivative contracts to open “call” contracts. Going long a put is essentially a short position where you make money if that stock falls, and a call is a long position.
When investors are overwhelmingly long puts, sentiment would be very bearish as most people are betting on the market to continue falling. These are the moments where we must be on the lookout for a bottom.
CBOE Equity Only Put/Call Ratio 1D (Tradingview)
Sentiment is fairly poor among current market participants, on Thursday the Put/Call reached 1.36, the highest value (most bearish sentiment) since April 2020. This is what helped fuel the Friday rally attempt currently underway for equities.
In my opinion, the put/call hasn’t reached the extreme values I would expect to see at a true market bottom which would back the idea that we’re due for a third leg down. But, as always, the market doesn’t care about my opinion, stay diligent.
Bear markets are the absolute best time to focus on honing your knowledge and trading skills. At the turn of the markets, a new crop of traders who used their time more effectively than the rest will always emerge.
I’ve created a series on the Blockware Intelligence youtube channel explaining technical analysis and equity investment from the very basics, you can check out episode 1 here.
Crypto-Exposed Equities
With the selloff this week in equities and cryptoassets, it’s not much of a shock that crypto-equities have generally have had a very poor week.
That being said, there’s an argument to be made that these stocks could have bottomed this week. One of my favorite trading patterns is called the “undercut and rally” (U&R). This occurs when a stock undercuts a previous support zone and then turns around to rally.
This pattern works because the undercut will blow out lots of stop losses and cause others to open up short positions. As I mentioned earlier, the market likes to cause pain and then punish those who let the market cause them pain (very evil I know).
Bitcoin put in this pattern on Thursday when it undercut the 2021 lows at $28,600 and then formed an upside reversal which has, so far, held.
Bitcoin/USD 1D (Tradingview)
Several crypto-exposed equities created this same pattern this week. EBON, CLSK, BKKT and HUT are some examples of this.
That being said, making buys here comes with tons of added risk.
As always, here is the weekly spreadsheet to compare the Monday-Thursday returns of several crypto-equities to that of spot Bitcoin and Valkyrie's Bitcoin Mining ETF, WGMI.
Bitcoin On-chain, Derivatives, Price Action
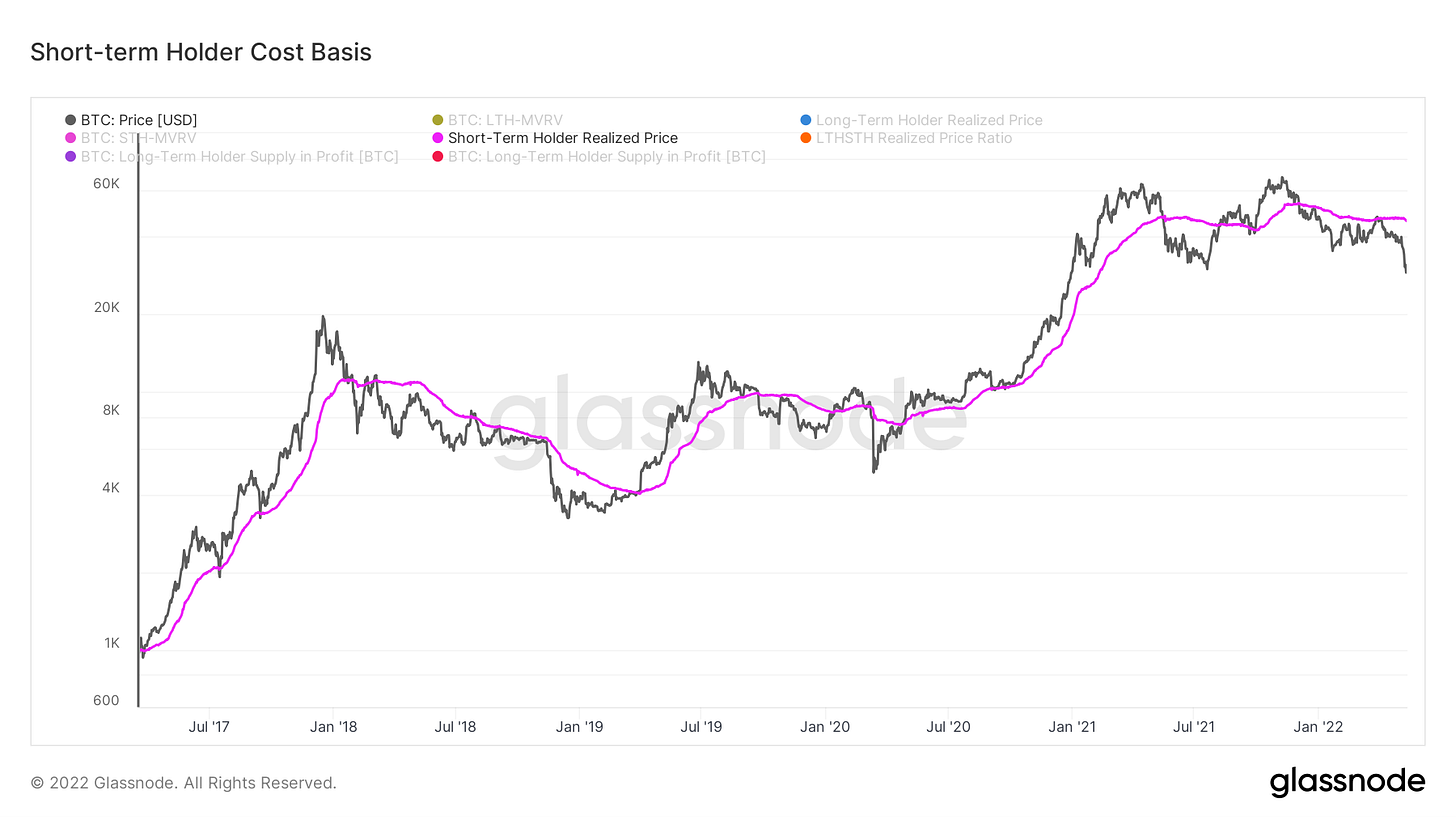
After the failed underside retests of the momentum thresholds we’ve described in this letter at $47K, Bitcoin has seen a sharp correction for 7 weeks in a row, pushing as low as $25K this week. These last few days have resemblance of some capitulation and likely a local bottom, with the largest 3 day volume bar on Coinbase since May 19th of last year. This means a lot of Bitcoin supply has changed hands.
Some substantial losses have been realized, reaching $2.5B in net realized losses on two separate days this last week.
A fair portion of these realized losses have come from the Luna Foundation Guard. With the death spiral caused by the substantial drop in UST’s peg, LFG was forced to liquidate their BTC reserves totaling over 80,000 BTC.
This resulted in the largest days of net BTC inflows to exchanges in nearly 5 years.
This also resulted in a decline of whale balances as well.
After becoming cautious in this letter on the break below $53K, we are of course now far from the short term cost basis level that we look at as a momentum threshold.
We are in the upper 20K-low 30K “value zone” we’ve described for weeks and therefore do see this has a time to nibble for long term investors. However, despite seeing some short term relief and local bottom, we also believe we are nearing the generational cyclical bottom; something we haven’t tried to claim once before in this letter. Let’s talk about why.
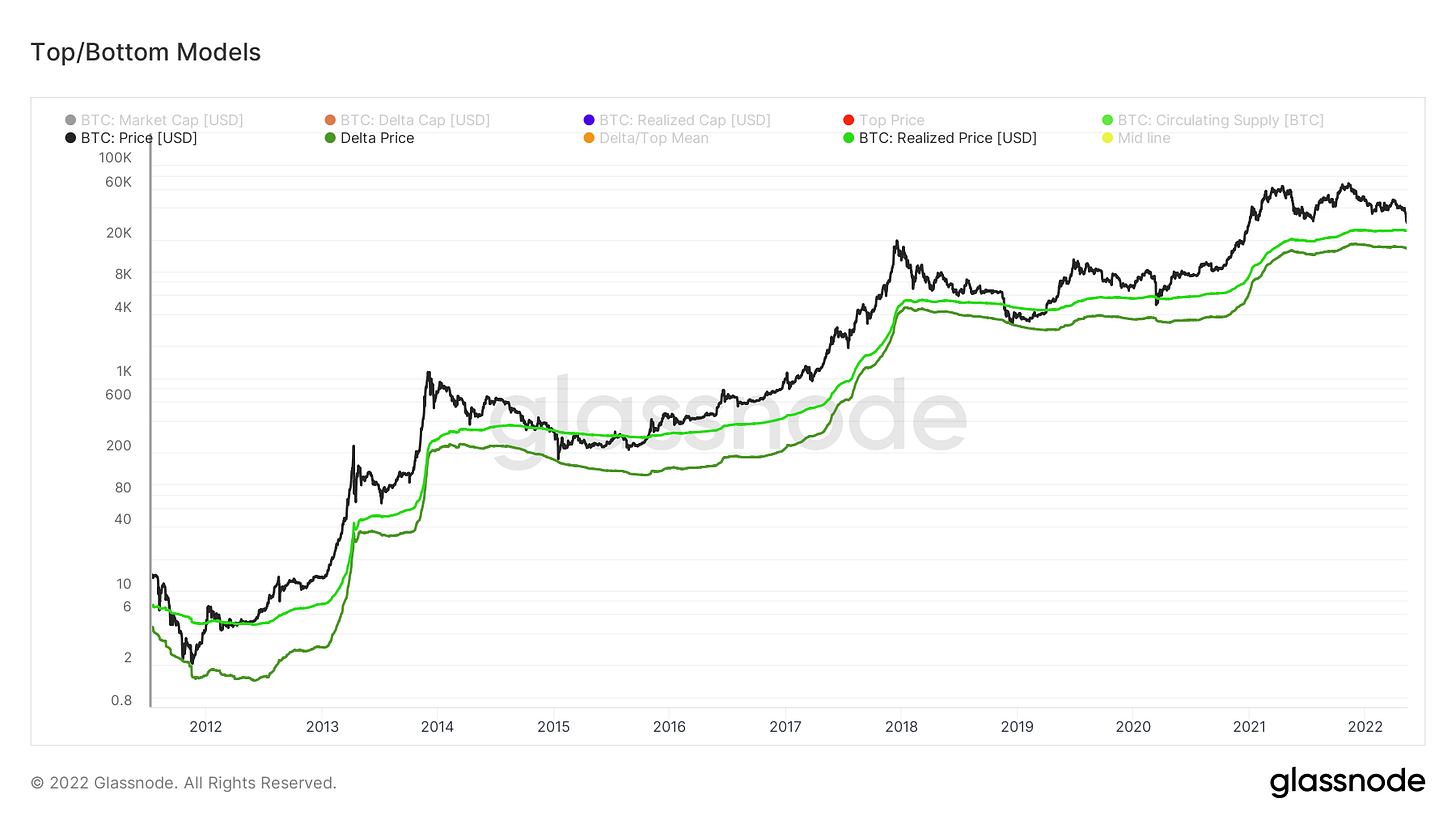
BTC is very close to realized price, the aggregated cost basis of all investors on-chain; this currently sits at $24K. Any prices below realized price should be seen as extreme value.
The z-scored comparison of Bitcoin’s market value to realized value is another way to visualize this. The green zone signals general buying opportunities, and we are getting awfully close to it.
Dormancy flow has been in the green buy zone for several months now, but is now pushing lows of what marked bottoms in 2011, 2014, 2018, and lower than the Covid crash of March 2020.
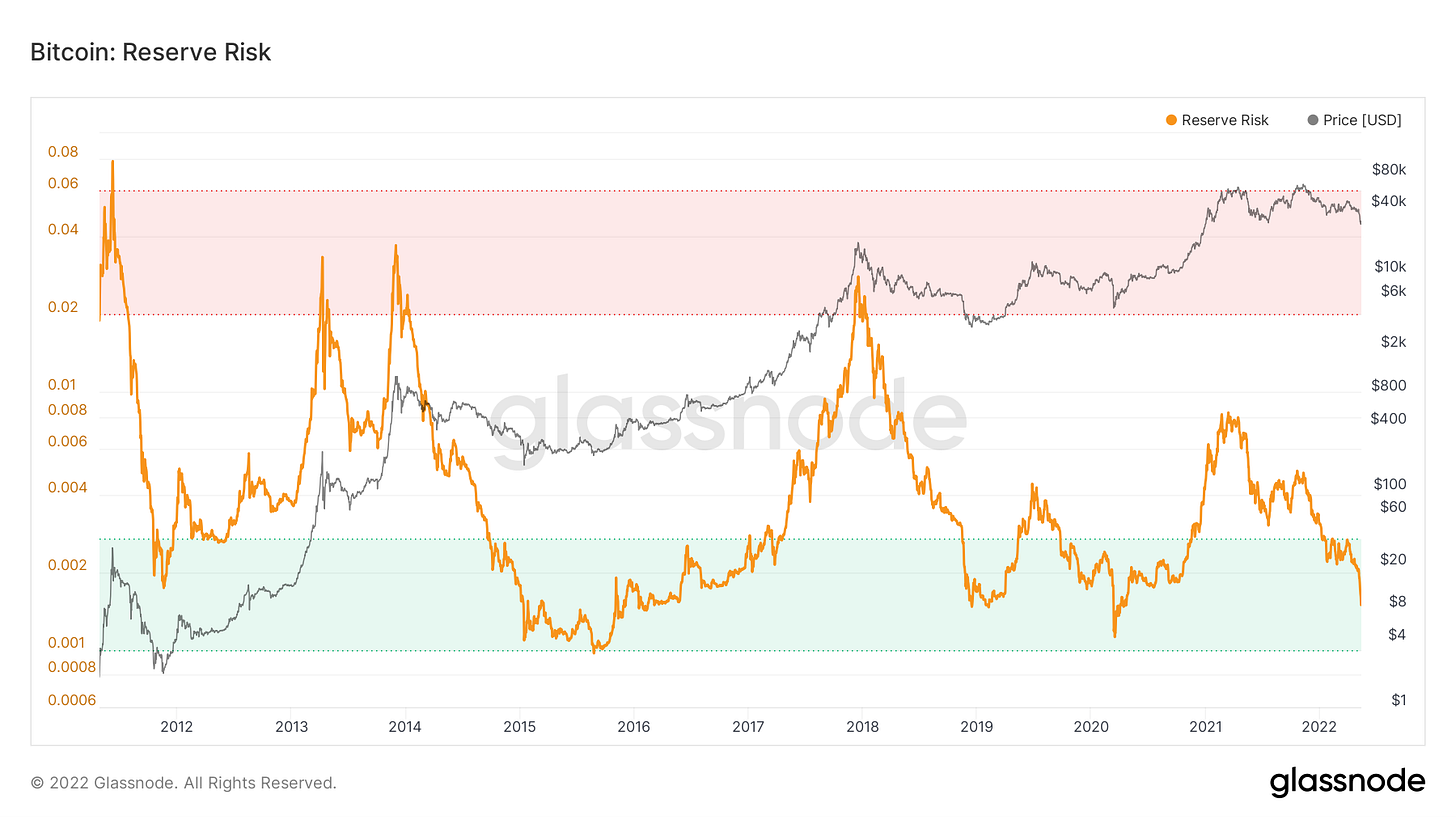
Reserve risk, measuring HODLer confidence in comparioson to price is heading into the lower bounds of the buy zone as well.
The mayer multiple, the comparison of price relative to the 200 day moving average, is nearing in on some of the lowest prints in BTC history.
And lastly, BTC is approaching the 200 week moving average, sitting at $22K.
The confluence of these indicators and price levels signal that Bitcoin is becoming deeply oversold. We aren’t calling the absolute cycle bottom *yet*, but are getting awfully close and expect these levels to be seen as great buys looking back in 2-3 years.
The biggest tail risk to this thesis remains macro uncertainty, with the potential for a correlation driven capitulation from equities; as BTC has never been around for a major recession. Although this is a logical thought process, one must ask themselves if this time is different, or will the confluence of signals that BTC has bottomed be sufficient to make a probabilistic decision based on historical data. Of course in this letter we aren’t here to make that decision for you, but rather provide you the information to be able to do so yourself.
Bitcoin Mining
Pending Bitcoin Transaction Fees Soared (Again)
Last week, pending Bitcoin transaction fees soared to levels not seen since July of 2021. This week pending transaction fees soared yet again, more than 4x the number of fees as last week. As of Wednesday, there was 14+ BTC worth of pending transaction fees sitting in the mempool waiting to be mined by miners.
Above you can see the large increase in pending transaction fees compared to last week. Transaction fees are important to miners as it is one of the two key components of miner revenue. The block subsidy is currently a large majority of miner revenue, but in the long run, fees will eventually become the main source of revenue for miners.
Mining Network Distribution Breakdown
At the start of 2021, Blockware Intelligence published a report titled: New Generation Mining Rigs are Safe Haven Bitcoin Dividend Assets.
The report contained a table that estimated the miner network distribution of hardware type and electricity rate (based on CoinShares Research and Blockware Research). From these estimations, we can analyze the network and determine at what price points certain segments of miners become unprofitable purely from an operating expenditures standpoint. The table from the original report (published in March) is below.
At the time, this was calculated using a Bitcoin price of $44,500 and a hash price of $0.20. Since then the price of Bitcoin has fallen and mining difficulty has increased.
For the updated table below, a Bitcoin price of $28,000 and a hash price of $0.12 were used to calculate the breakeven price. Additionally, S9s as a percentage of the total network was adjusted lower, since about 20 additional EH has come online since the original table above was published. Virtually all of this additional hash rate is new-gen rigs S19s, M30s, etc. so “S19 % of the network” increased.
Because of this increase in network difficulty, breakeven prices have risen. Since the price has dropped as well, miners have inched closer to their higher breakeven prices and margins are being compressed for everyone.
In the bold red are the segments of miners that are currently operating unprofitably (if those machines are still running). This is estimated to be 5% of the network, and a large majority of that 5% is right on the cusp of profitability at $28,583.
As noted in previous Blockware Research, just because a miner is currently unprofitable, does not mean that they turn their rigs off immediately. They have negotiated contracts to consume certain amounts of energy, and they turn into desperate speculators hoping the market turns around without having to completely shut down their operations.
If we see the market continue to fall over the next 30-60 days, it is reasonable to expect some of these S9s to begin dropping off the network, potentially even causing a decrease in total network difficulty. If this occurs, then new-gen miners begin to see a nice volatility buffer. Their breakeven prices would actually start to drop if difficulty drops due to old-gen rigs capitulating.
What does this mean? It indicates that we are potentially on the cusp of a small miner capitulation, and historically miner capitulations mark Bitcoin price bottoms. It also continues to highlight our previous research that new-gen mining rigs are safe haven bitcoin dividend assets in the short to medium term (12-18 months).
All content is for informational purposes only. This Blockware Intelligence Newsletter is of a general nature and does consider or address any individual circumstances and is not investment advice, nor should it be construed in any way as tax, accounting, legal, business, financial or regulatory advice. You should seek independent legal and financial advice, including advice as to tax consequences, before making any investment decision.











Love this newsletter! Learned so much with these posts. Thank you and keep up!