

Blockware Intelligence Newsletter: Week 33
Bitcoin on-chain analysis, mining analysis, equity-analysis; overview of 4/8/22-4/15/22


Blockware Intelligence Sponsors
FTX US - Buy Bitcoin and crypto with zero fees on FTX. Use our referral code (blockware) and get a free coin when you trade $10 worth.
Blockware Solutions (Mining) - It is difficult to buy ASICs, build large mining facilities, and source cheap scalable electricity all on your own. Work with a trusted partner like Blockware to deploy capital into Bitcoin mining.
Blockware Solutions (Staking) - Ethereum 2.0 is almost here, now is the time to stake your ETH with Blockware Solutions Staking as a Service to take advantage of 10-15% APR when the Ethereum network switches over to Proof of Stake
Webull - Trade crypto-equities. Open an account and make your first deposit by April 30th and get three free stocks, each valued between $3-$3,000.
If your company is interested in sponsoring Blockware Intelligence (125,000+ subscribers on Substack, YouTube, and Podcast), please email sponsor@blockwaresolutions.com.
Summary
CPI inflation is now at 8.5% but PPI inflation, which historically tends to lead CPI, is currently over 15% and the highest in nearly 50 years.
The spread between CPI and the 10 year yield is the highest it has ever been, signaling we will likely see a continued sell off in bonds.
Despite record inflation, spot Bitcoin is holding up surprisingly well and several crypto-exposed equities have outperformed of recent as institutions look for exposure to BTC in legacy markets.
Heavy exchange outflows
Whale accumulation visible on-chain after a month of distribution
3 out of the last 4 Bitcoin Mining Difficulty Adjustments have been negative.
This means individual Bitcoin miners have been mining more BTC than they would have expected by now.
2022 Hash rate projections have been overestimated (so far), and new generation machines today are likely to remain profitable for many years to come.
General Market Update
It’s been a short, but choppy, week of price action across the general market. A lot of this stems from the biggest financial news event of the week, the announcement of new CPI data.
If you somehow haven’t already heard, the Consumer Price Index came in at 8.5% YoY. This means that a basket of goods that the government has determined regular people buy has increased in price by 8.5% in the last year.
The funny thing is that the components of that basket are often adjusted for various reasons, some legitimate and some not. But the fact of the matter is that CPI inflation is the highest it’s been since 1981.
CPI YoY (Bloomberg)
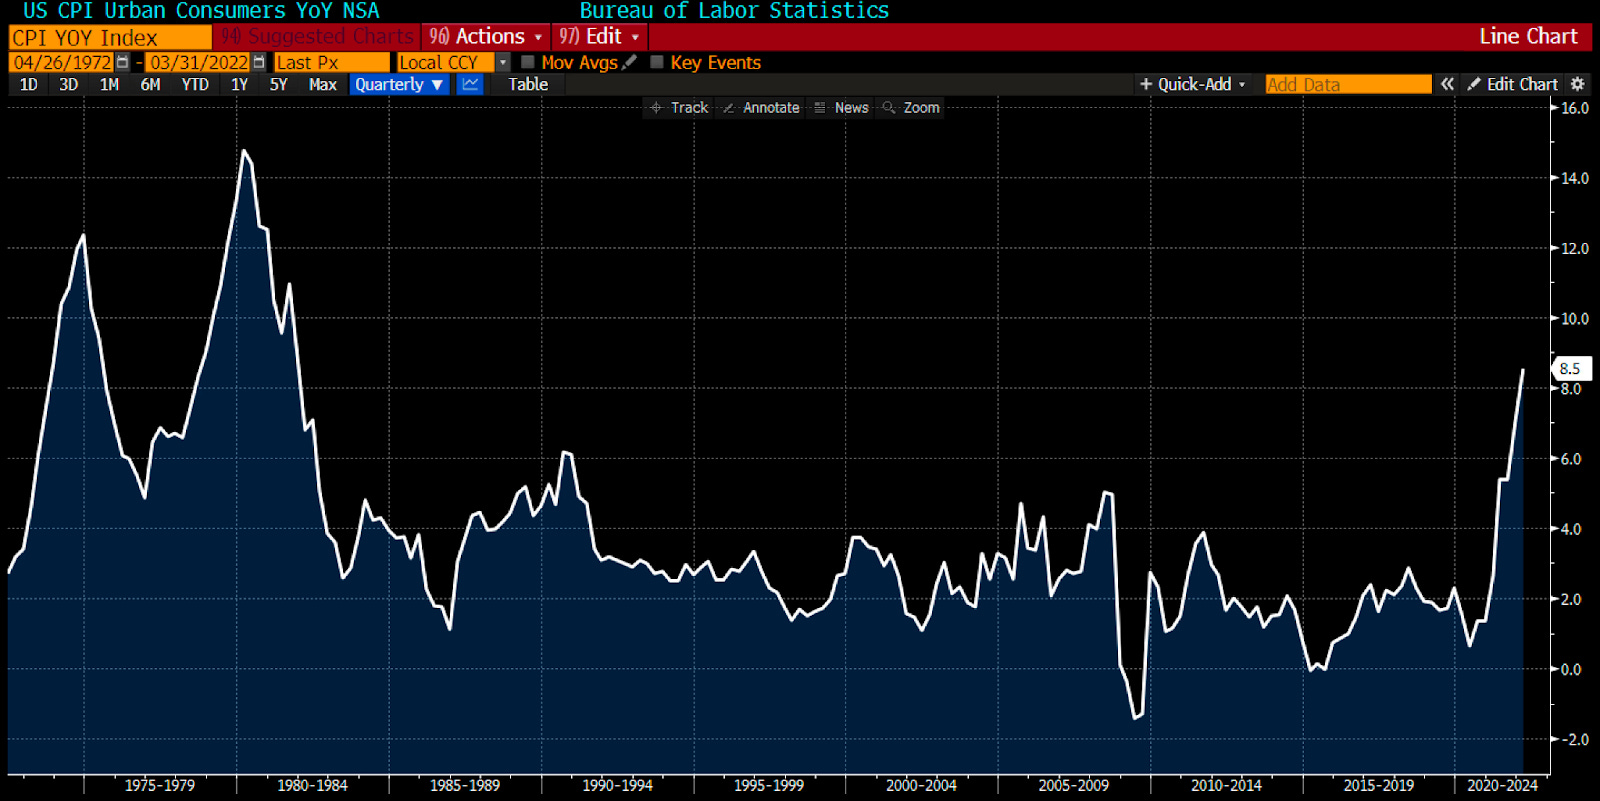
Another fun fact for you is that the equation used to calculate CPI was changed in 1978. If we used that original equation today CPI would be at roughly 17%, an all-time high.
Another inflation metric that we can look at is the Producer Price Index (PPI) which measures the inflation of input costs for producers. Currently PPI is at 15.2%, in US history it was only higher for 2 quarters in 1974.
PPI YoY (Bloomberg)

In my opinion, PPI should be the number that is the biggest financial talking point at the moment. PPI tends to lead CPI, meaning that inflation hits producers first who then raise prices for consumers.
As inflation and fear of inflation rises, people and institutions sell their stocks, crypto and fixed-income securities. This explains the massive selloff we’ve seen underway in the bond market.
US10Y Yield (Bloomberg)

The 10 Year Treasury yield just recently broke through this roughly 40 year downtrend line. A signal that investor sentiment has fallen as there is increased fear of rising prices, causing a sell-off in bonds.
One way we can compare the yield of bonds with inflation is to subtract the yield of a 10Y bond from the current CPI number, otherwise known as the CPI-10Y spread.
This gives us the real yield of the 10Y treasury, or the return an investor can expect to receive after taking inflation into account.
CPI-US10Y Yield (Bloomberg)

In the bottom pane of the chart above you can see the CPI-10Y spread. As you can tell, the spread is at the highest it has ever been, meaning that the real yield of owning a 10Y bond has never been lower. Real returns on the 10Y are even lower today than they were through the stagflation of the 1970’s and 80’s…
And as we just discussed, PPI is indicating that we likely have higher CPI numbers to come in the future. Therefore, we can speculate that we most likely will see a continued sell off in the bond market.
So what does this mean for riskier assets like stocks and crypto? It’s not great news, higher bond yields compresses the valuation metrics used by institutional investors. This means that risk preference falls when bond yields rise, causing a sell-off in stocks and cryptoassets.
We can see this reflected relatively strongly in the equity markets this week. Yesterday’s weekly close was fairly ugly for the S&P 500 but even more so for the Nasdaq Composite.
Nasdaq Composite 1D (Tradingview)

Above I’ve drawn in the inverse head and shoulders pattern that has become a favorite among bullish traders on twitter. Ideally, we would see the Nasdaq bounce around this level to confirm this bottoming pattern.
Unfortunately, that doesn’t appear to be the case as we closed the week only 25 basis points off the weekly lows. Furthermore, the 10EMA (green) is now crossing over the 21EMA (blue) as a signal of short term weakness that we last got on January 11th.
Nasdaq Daily Indicators (Marketsmith)
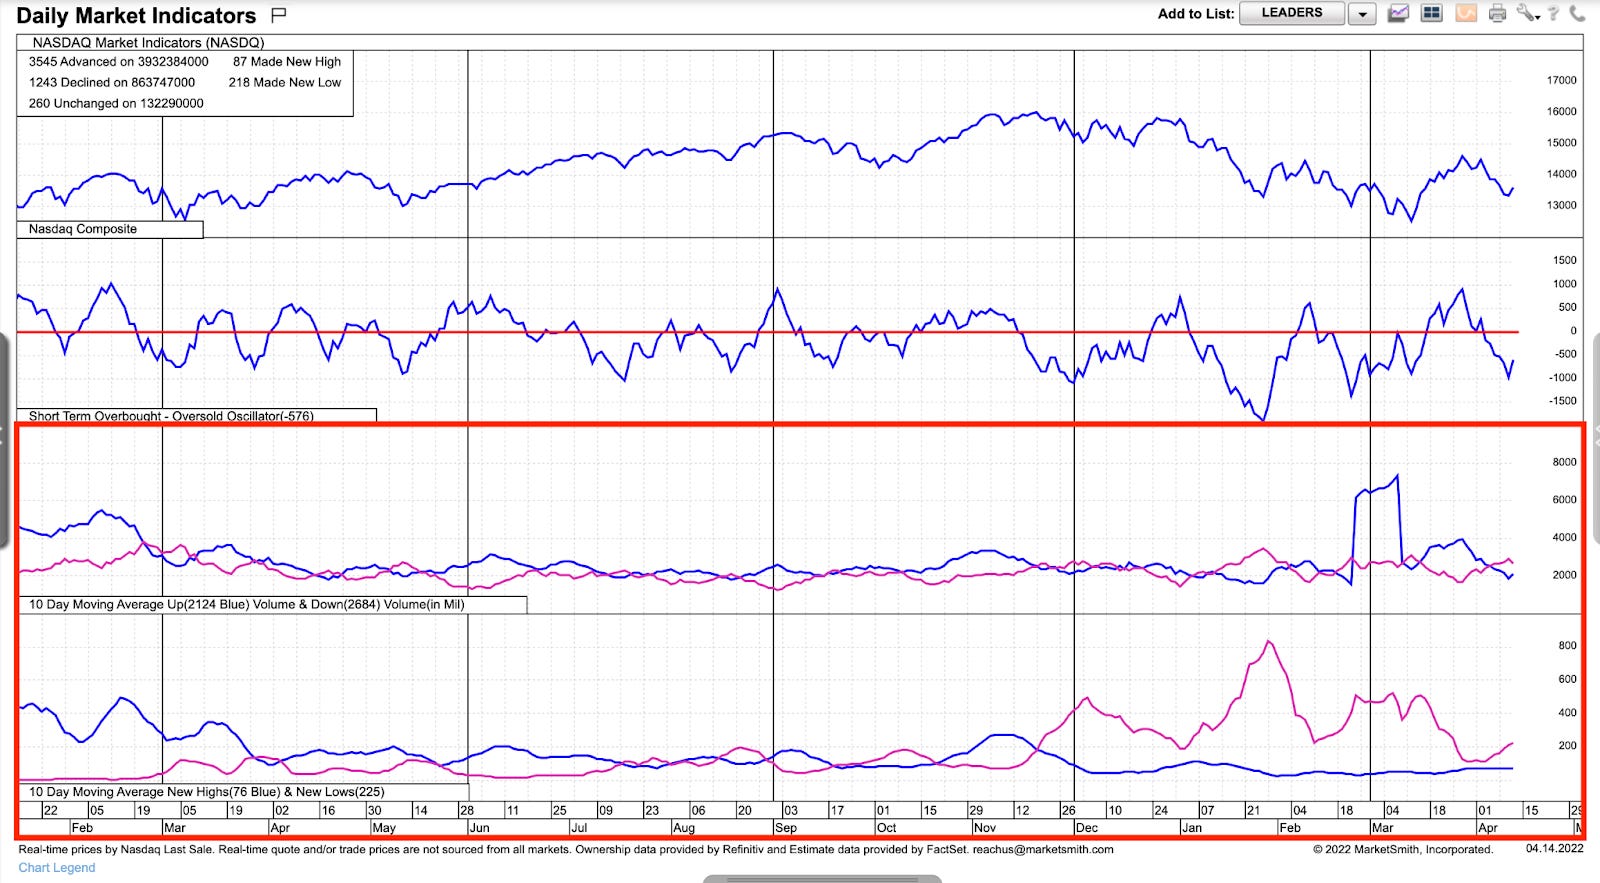
Above I’ve highlighted the bottom two panes of this group of indicators. The top one shows us a 10 day moving average of both up and down volume on the Nasdaq. As you can see, the MA of down volume (pink) has surpassed the MA of up volume (blue).
This is a fairly bearish indication that tells us that Nasdaq stocks are, in general, selling off on large volume. Over the last 10 days, the big fish have been looking to sell stocks more than buy.
At the bottom you can see a 10 day moving average of the number of Nasdaq stocks making new highs vs. new lows. It shouldn’t come as too much of a shock to see that the number of stocks making new highs (blue) is stagnant, if not declining, and the number of stocks making new lows (pink) has increased this week.
SPYV vs. SPYG (Tradingview)

We can also look at particular index ETFs to gauge what areas of the market capital is flowing to and from. As you can see above, since November value stocks in the S&P have vastly outperformed growth stocks.
This tells us as traders where we should be focusing our attention. In an inflationary environment, there are several industries that stand to benefit from higher prices. Generally, these are commodity companies which explains why value stocks have held up so well.
Okay, so what’s the bull case? That would be the idea that rapidly increasing inflation is not necessarily a new topic, it’s all anyone has talked about for months now. At this point, it’s hard to believe that not nearly everyone who would sell stocks due to inflation already has.
Crypto-Exposed Equities
Crypto-equities haven’t had the greatest week either. With Bitcoin down roughly 5% on the week at the time of writing, it’s no surprise people have been selling Bitcoin-related stocks too.
Of course, some stocks in this group are acting better than others. Sell offs are a great time to hunt for relative strength, as these are the stocks that are likely to perform best once the market pressure is alleviated.
I believe that at the moment, some of the technically strongest crypto-exposed equities are: ARBK, CLSK, MIGI, MSTR and BTCS.
Interestingly, Valkyrie's Bitcoin Miners ETF, WGMI, has outperformed spot Bitcoin returns over the last month, as you can see below.
WGMI vs. BTCUSD (Tradingview)

It would appear to me that despite all the macroeconomic pressure, institutions are still looking for an avenue to invest in Bitcoin through the legacy markets.
Many funds are not allowed to own anything other than equities and therefore, use crypto-exposed stocks or ETFs to expose themselves to BTC. This is one possible explanation for WGMI’s outperformance.

Above is the comparative excel sheet for crypto-exposed equities. As you can see, the average crypto-stock has outperformed spot BTC once again this week, returning -3.36% compared to BTC’s -5.21%.
The only name that remains in the top 5 from the last newsletter is MIGI. Not too much of a surprise as they reported Q4 and full year 2021 earnings 3 weeks ago and they crushed it.
Revenues were up 79% in Q4 and 886% for the year. Gross profit was up 89% in Q4 and 2526% for the year. This is due to the fact that they plugged in 33,000 ASICs in 2021 and came into the year with only 7,000 (a 471% increase).
On-Chain and Derivatives
After talking through some of the macro drivers creating a backdrop of uncertainty across all markets including Bitcoin; let’s look at some Bitcoin-centric metrics worth noting.
For our value/momentum framework we still see it the same way: Value in the low $30Ks, Momentum on closes above $47K. For now, Bitcoin is in “no man’s land” price-wise based on this mental framework.
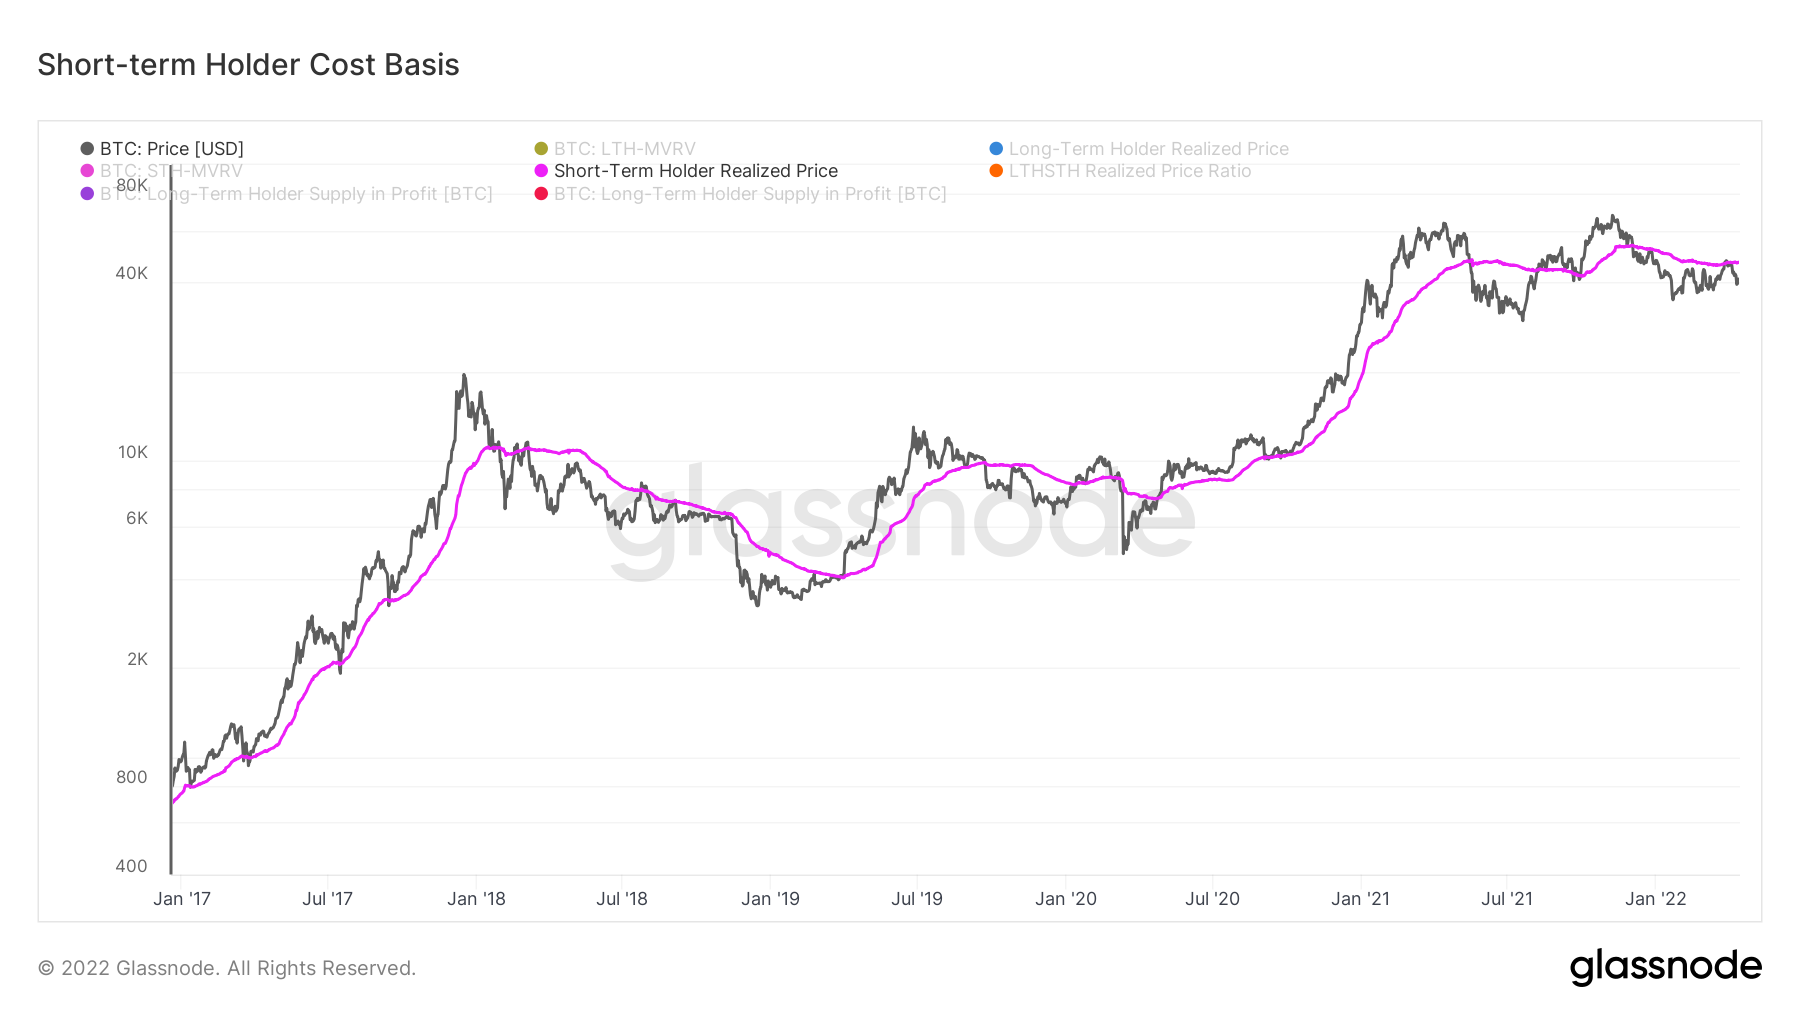
Last week (we didn’t send out a newsletter because of Bitcoin2022) Bitcoin failed to hold short-term holder realized, which is the aggregated cost basis of market participants that have been on-chain for less than 155-days. Until proven otherwise, a failed underside retest. There are behavioral dynamics built into this: In raging bull markets new market participants don’t want to sell at a loss and you see price bounce off retests of the cost basis as support. In bear markets new market participants (that likely don’t have a fundamental understanding of the asset class) look to break even and exit the market as soon as possible, thus causing several underside rejections of the cost basis on the way down.
These dynamics make the price band a good trend/momentum following strategy, to at a minimum look at in confluence with other moving averages and trend following indicators. This currently sits at $47,000.
Have seen spot premium come back over the last week; both on an aggregated basis as well as looking in more granularity by comparing Bybit perps to Coinbase spot and Bitfinex spot.
There is a non-zero chance that the macro uncertainty we described could cause a contagion event(even though I don’t think it’s asymmetrical to place a huge bet on this happening); but even if that were to occur, doubt the decline in Bitcoin would be to the same level of severity as March 13th, 2020. Why? Derivatives are not nearly as jacked up as they were in March 2020 front running the 2020 halving.
This is illustrated in two main ways; firstly the spot premium we just noted.

The second way is by looking at the percentage of futures contracts collateralized with crypto. We’ve talked about this several times before, but the general idea is that longing Bitcoin with Bitcoin as collateral has a negative convexity to it if the trade starts going against you. What I mean by this is that not only does your PnL decrease but so does the value of the collateral you are using for that contract. This creates a negative feedback loop of liquidations, the most brutal example of this effect was March 13th, 2020.
The decrease in the percentage of contracts collateralized with crypto has come down to roughly 40% from 70%, making a healthier overall backdrop and lower likelihood for a cascade to the magnitude of March 2020. Another factor would be the fact that exchanges that dominate volume over the last 6 months such as FTX have less aggressive liquidation engines than Bitmex did at the time of the March 2020 selloff.

Underneath the surface, there is a heavy phase of accumulation on-chain.
Exchange outflows have reached a rate that has only ever occurred 3 times before in Bitcoin’s history: following March 2020, December 2020 (a lot of which was likely GBTC), and September 2021.

Upon doing some further digging on these outflows, the notable declines have interestingly come from a confluence of United States-based exchanges over the last few weeks. (Coinbase, Kraken, Gemini)

Another measure of holding behavior is simply looking at the amount of supply last active a year+ ago; a simple but powerful metric. As of this week, an all-time high 63.7% of Bitcoin’s supply hasn’t moved in at least a year.

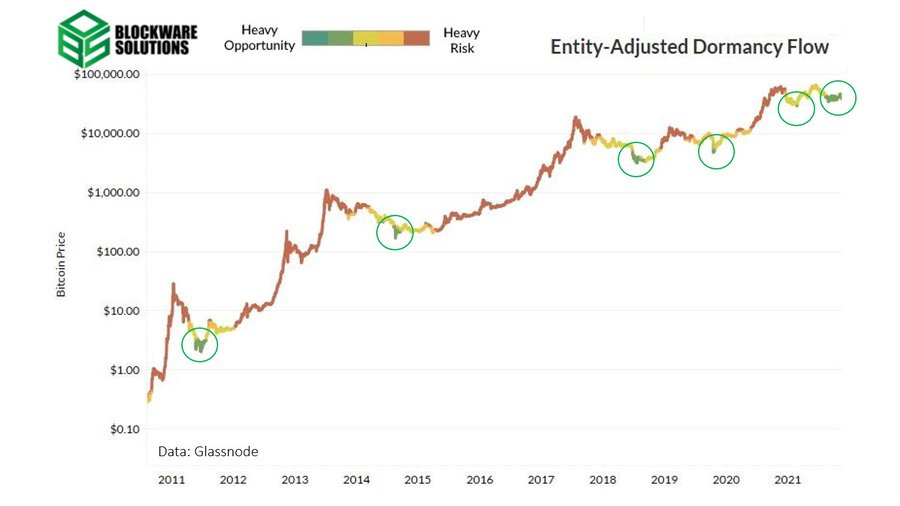
An illustration of this lack of spending is dormancy flow; comparing the amount of coin destruction to the 365 trend. Currently in the heavy opportunity zone for just the sixth time ever; which has also been the longest time BTC has ever spent in the zone.
Illiquid supply continues to climb as well, meaning 76.5% of Bitcoin’s supply is now in the hands of entities who historically have sold less than 25% of the BTC they take into their holdings.

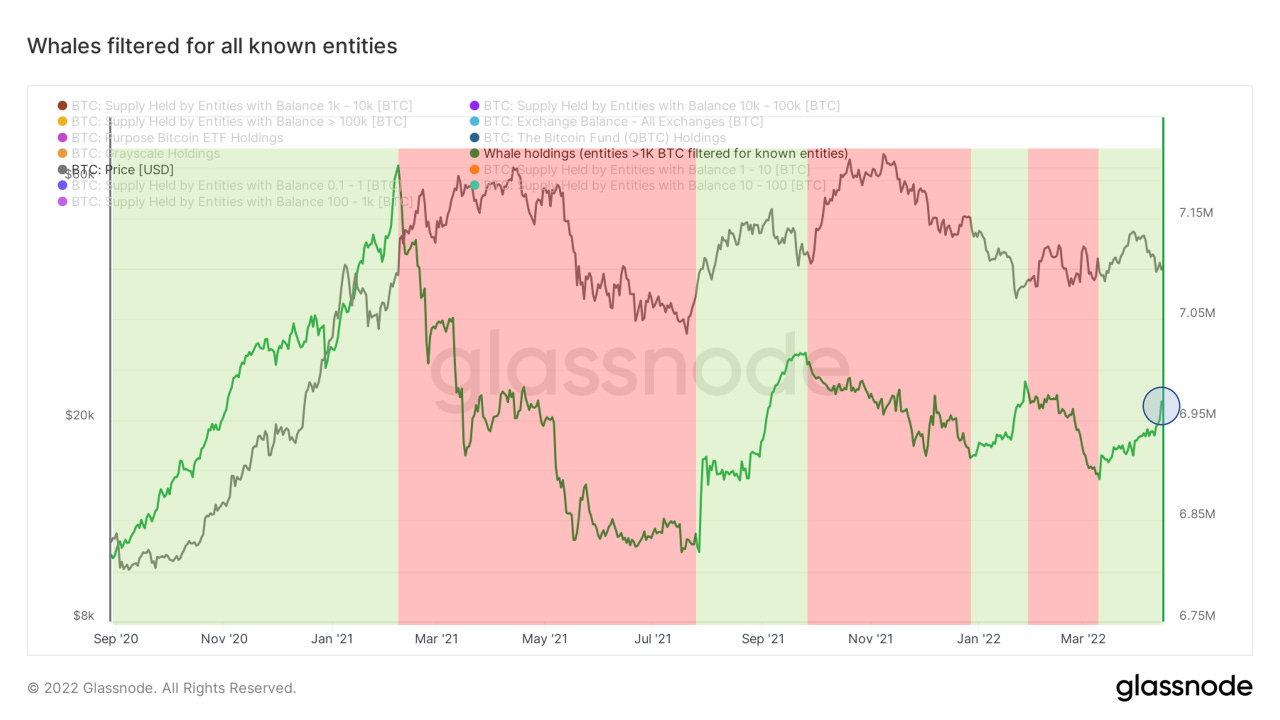
This week has seen an uptick in whales holdings for the first time since January, showing an increase in supply held by entities with over 1,000 BTC (filtering out for known on-chain entities such as exchanges).
Long-term holder realized cap net position change (30-day change of LTH realized cap) is in unprecedented territory.
Will, what on Earth does this word salad mean?
This can mean a few things. First is that LTHs are averaging down and buying lower, thus lowering their basis. However, currently, LTH supply is sideways which suggests an equilibrium of migration in and spending out. Another theory is that newer LTHs with a higher cost basis (the 155-day threshold for LTHs is just past the November ATH right now) are selling, which leaves only LTHs with a lower cost basis. Shoutout to Checkmate from Glassnode for helping me think through this.

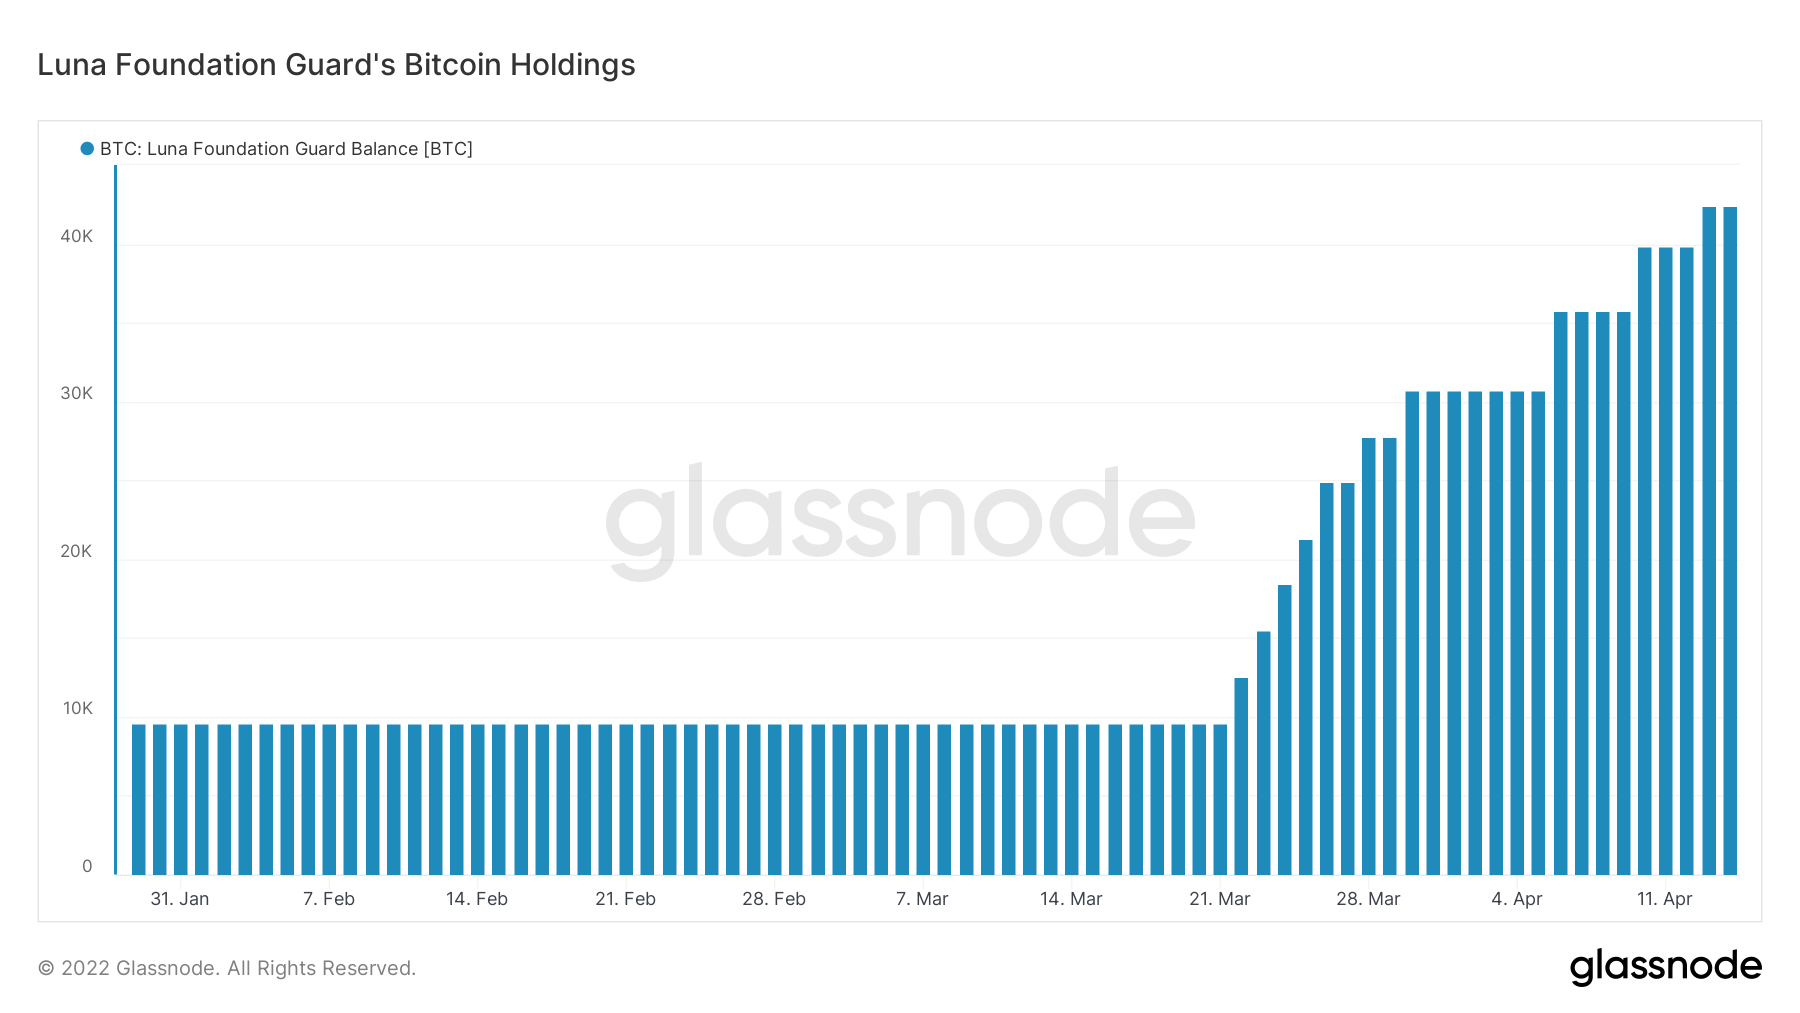
Lastly, Do Kwon and the Luna Foundation Guard continue their mission to create Bitcoin reserves; their balance has reached 42,406 BTC at the time of writing.
Intra-Bitcoin metrics all look good overall; the only concern is a potential contagion event in traditional markets that would correlate to BTC in the short term.
Mining

Bitcoin Mining Difficulty Adjusted Down, Again.
Shockingly, 3 out of the last 4 Bitcoin Mining Difficulty Adjustments have been negative. This means on each of these three occasions, it actually became marginally easier to mine a block and individual miners mined slightly more BTC than the previous difficulty epoch. A small caveat is that each of these downward adjustments was very marginal, less than 2% down. However, it is very significant that the network hash rate has not been growing at the rate many analysts expected.
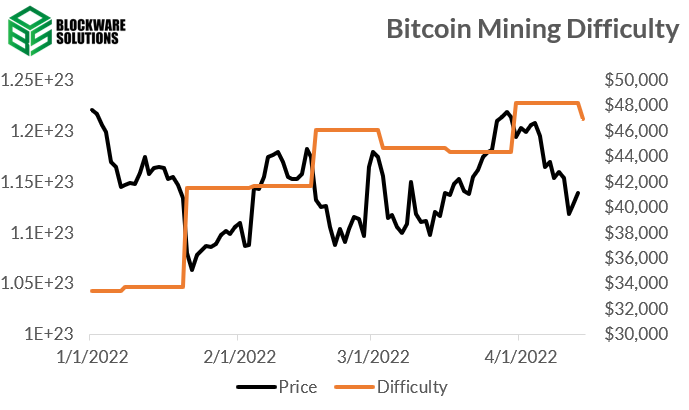
Zooming out, it is easy to see the rapid network difficulty growth that took place after the China mining ban. This occurred due to a large number of machines temporarily being turned off and shipped to other countries around the world. However, it is clear that the network difficulty growth has clearly been slowing this year and especially slowing over the last 2 months.

2022 Hash Rate Projections
For those that don’t know, hash rate and difficulty have a 1-to-1 relationship on a long enough time frame (excluding variability from randomness).
At the start of 2022, Blockware Intelligence published a hash rate projection based on public miner ASIC orders, proprietary internal Blockware Sales data, and historical trends.
Our projection stated that the global network hash rate would end the year at roughly 300 EH/s. This was 30 EH/s less than Galaxy Digital’s projection. So far the 14-day moving average of the total network hash rate is below both firms' projections and much closer to Blockware Intelligence’s projection.

Our projection is currently only 7 EH/s above the 14-day moving average.
Why is Hash Rate Growth Slowing?
There are a few key potential reasons why hash rate growth has slowed significantly.
First, it is possible that some rigs are still getting turned off in unstable geopolitical regions like Russia, Ukraine, and Kazakstan. We covered this a month ago, but Kazakstan did confiscate nearly $200M worth of mining equipment.
Second, from a projection methodology standpoint, it is possible that projections were based on historical hash rate growth too much. Bitcoin ASICs are commoditizing, so new generation machines will no longer come out and cause a magnitude increase in hash rate like 2009-2020. The new generation machines will still have the upper hand when it comes to efficiency and profitability, and they won’t become obsolete over the next couple of years.
Third, many public companies and large-scale miners may have overestimated the amount of hash rate they could deploy in a short period of time. Building the infrastructure to host 100s of MWs of power is not an easy task.
At the end of the day, the Bitcoin network is more secure than ever before, and mining with new generation ASICs is a fantastic strategy to dollar cost average into Bitcoin at a discount.
All content is for informational purposes only. This Blockware Intelligence Newsletter is of a general nature and does consider or address any individual circumstances and is not investment advice, nor should it be construed in any way as tax, accounting, legal, business, financial or regulatory advice. You should seek independent legal and financial advice, including advice as to tax consequences, before making any investment decision.
thanks for the great content
Great to have the team back. Knew something was off when I didn't receive last week's newsletter. Guess it was BitcoinConf22 lol.