Blockware Intelligence Newsletter: Week 62
Bitcoin on-chain analysis, mining analysis, macro analysis; overview of 10/29/22-11/04/22
Blockware Intelligence Sponsors
If you are interested in sponsoring Blockware Intelligence email: sponsor@blockwaresolutions.com.
Blockware Solutions - Buy and host Bitcoin mining rigs to passively earn BTC by producing blocks. Purchase new S19XPs today!
Have fun and learn more about our Bitcoin future at Pacific Bitcoin, the largest Bitcoin conference on the West Coast. Nov 10-11 in Los Angeles. Get 30% OFF tickets with code BLOCK.
For years on the show We Study Billionaires, The Investor’s Podcast Network has made a habit of chatting with the world’s best investors, like Ray Dalio, Joel Greenblatt, Howard Marks, and many more. With 100+ million downloads, they make podcasts by investors, for investors. Now, they’re joining the newsletter space. Read The Investor’s Podcast Network’s full daily commentary and expert insights in the We Study Markets newsletter.
Click here to sign up (for free) today.
Purchasing Power Under a Bitcoin Standard
On Monday we released our latest Blockware Intelligence Research Report: “Purchasing Power Under a Bitcoin Standard.”
Humanity is naturally converging on a global Bitcoin Standard due to BTC having unrivaled monetary properties. This Blockware Intelligence Research Report forecasts the future purchasing power of BTC as it becomes the dominant store of value through the demonetization of other asset classes. Click the image below to check out the report!
Summary
On Wednesday, FOMC increased the US market interest rate by 75 bps, and Powell’s hawkish speech that followed injected some fear into the financial markets.
With the dollar moving higher earlier this week, we’ve seen Treasury yields rise, and the equities indexes fall.
As of Friday morning, with the release of October’s jobs report, we’re seeing a solid bounce from equities, Treasuries, and Bitcoin to close out the week.
Realized price represents a major on-chain resistance level for BTC.
The amount of new addresses created daily appears to be picking up momentum
Open Interest and realized volatility have remained relatively high and low respectively
The amount of realized losses occurring on-chain has diminished greatly since the initial drop to $20k.
Long term holders continue to act as buyers of last resort.
Multiple large overleveraged Bitcoin miners are in the process of defaulting on debt.
Now is the time for energy companies to acquire distressed bitcoin miners.
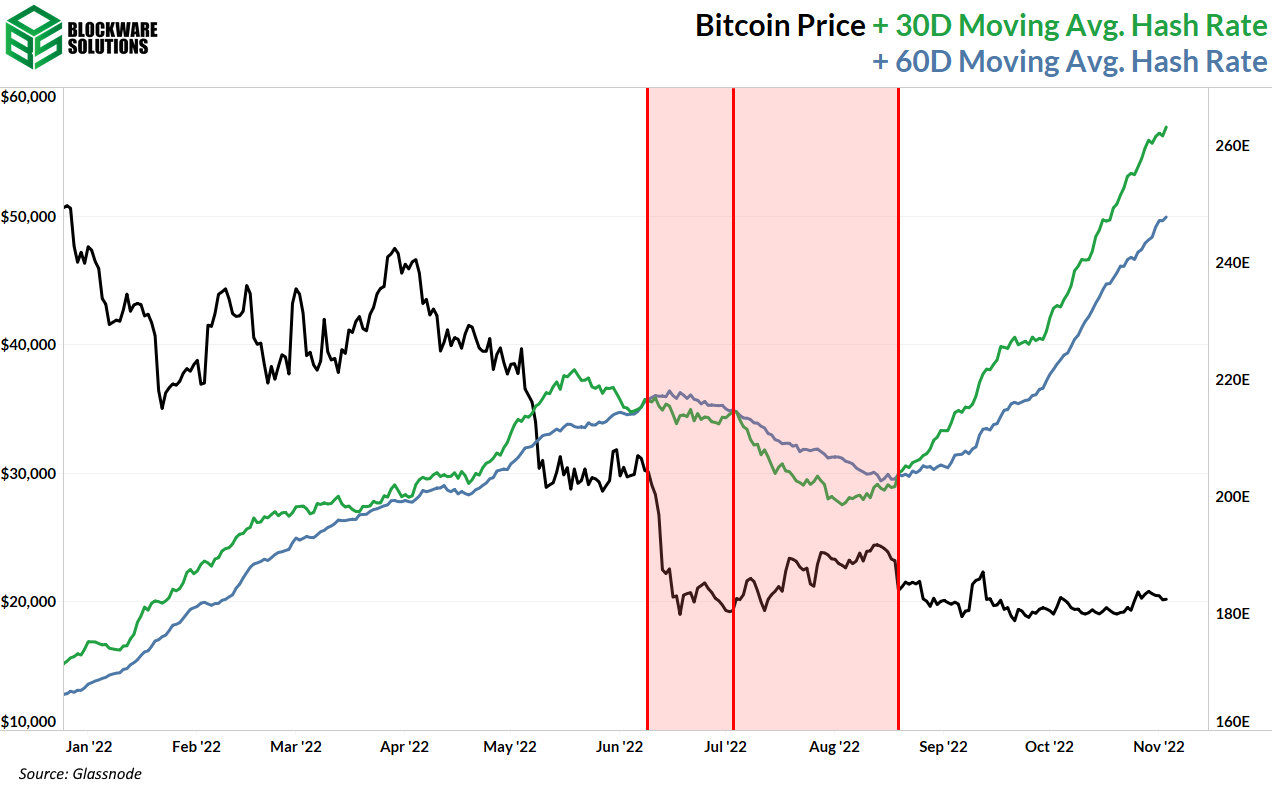
Despite many public miner equities drifting toward 0, total network hash rate continues to drift up.
General Market Update
With the FOMC meeting on Wednesday, it’s been quite the volatile week across the financial markets.
As you likely know, the Fed decided on their 4th consecutive 75bps hike to the Fed Funds Rate. This hike was in-line with market projections and now puts the FFR target range at 3.75 - 4.00%.
FFR Upper Limit (TradingEconomics)
An upper limit of 4% puts the market interest rate at a level not seen since 2008. As you may know, the markets tend to react more to the Fed Chair’s speech rather than the actual decision.
This is because markets are forward looking, and as of Tuesday, 75 bps was priced into the market. What wasn’t priced in was the tone and outlook that Powell would portray in his speech.
Powell took a more hawkish approach in this news conference, stating that they would rather over-tighten than under-tighten. In the Chair’s eyes, the potential liquidity crisis that could arise from an overly aggressive Fed is less of a threat to the American economy than the persistent inflation that would come from the Fed acting too timidly.
Whether you agree or not is up to you.
Chairman Powell did say that we’ll likely see a reduction in the size of the rate hikes in the next couple of meetings, but they also stated that previous terminal rate projections were likely too low.
The terminal rate is the level that the FFR is expected to reach before policy changes and interest rates are lowered again. While nobody knows for sure what the exact terminal rate will end up being, speculation amongst futures traders and Fed officials allows us to see what market participants are expecting.
With markets being forward looking, expectations of future short rates are hugely important.
In September, the median forecast for the terminal rate amongst Fed officials was 4.6%. After Powell’s talk on Wednesday, the futures market is now pointing towards us seeing rates above 5% in the next 6 months.
In summary, in the next 1-2 FOMC meetings, we can expect to see the Fed move to a strategy where rate hikes are decreased in size, but continue for a longer duration than originally expected.
This appears to be a strategy to manage risk for the Fed. The actions they’ve taken in 2022 are already extremely aggressive, historically. Therefore, FOMC now believes that they can ease off the gas to be a bit more surgical with their rate changes.
Contrary to what some might believe, a reduction in the size of rate hikes is not a Fed pivot. US monetary policy is still overwhelmingly contractionary, and as Powell has stated, will continue to be this way for quite some time.
It is possible, however, that a reduction in the magnitude of rate increases would signal to the market that the finish line is in sight for this tightening cycle. It’s possible that markets could bottom around this news, if they haven’t already.
Of course, this is solely speculation and is not investment advice.
The Fed Open Market Committee meets next on December 14th, with the following meeting on February 1st.
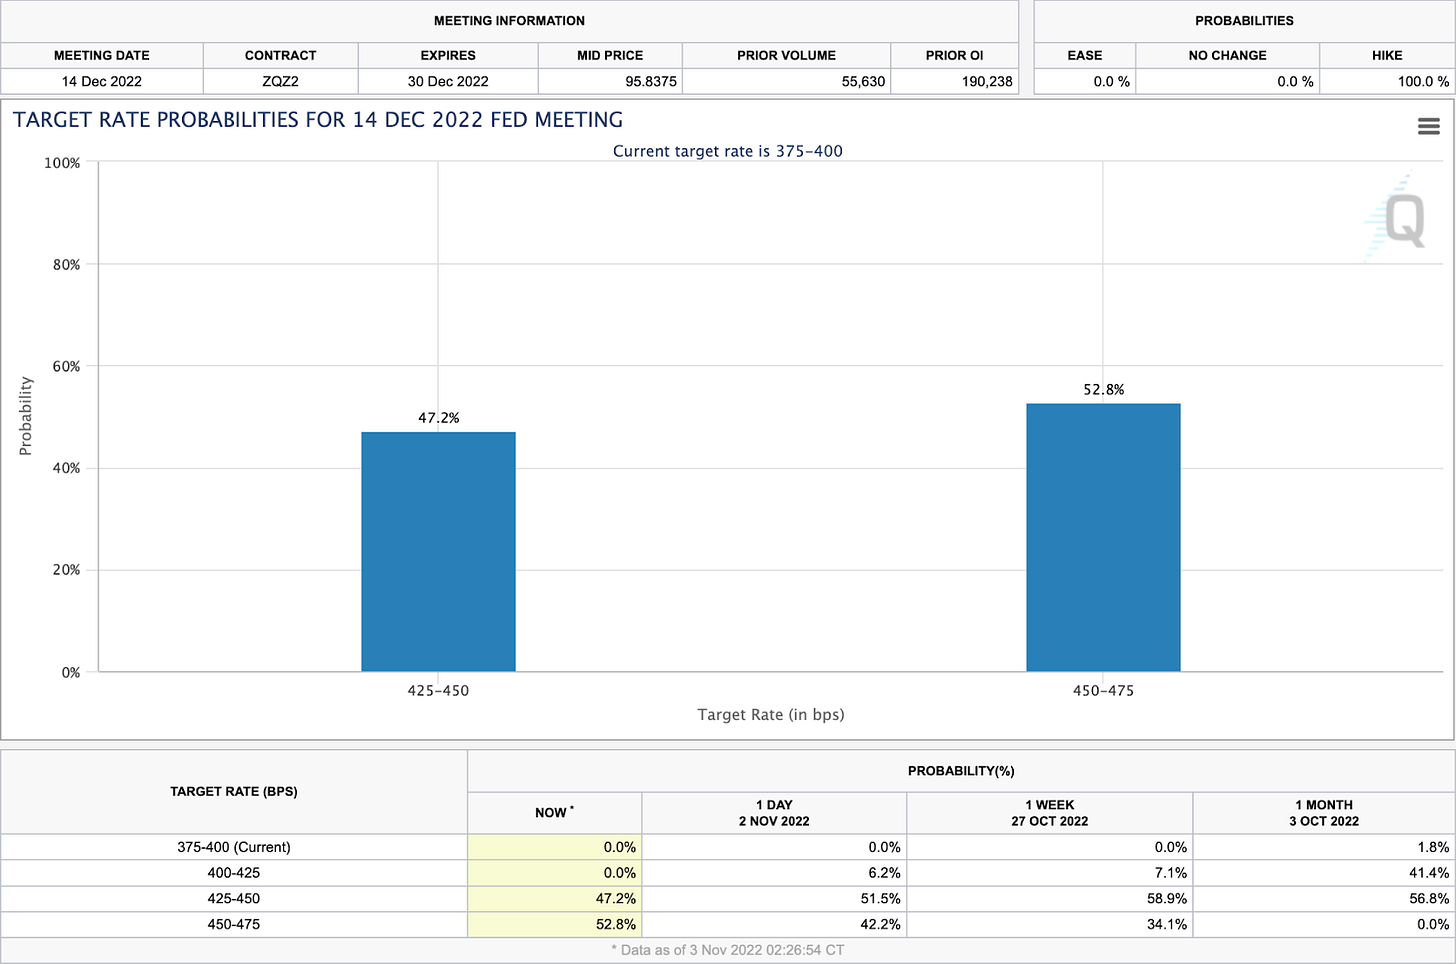
FedWatch Tool (CME Group)
At the moment, CME Group is projecting that, based on Fed futures data, there is roughly a 50/50 chance of seeing 50 vs. 75bps in December. This will likely change before December 14th.
As mentioned in the opening sentence of this newsletter, Powell’s speech unsurprisingly triggered massive volatility in the markets.
Chart Courtesy of @BespokeInvest on Twitter
The chart above illustrates just how hawkish Powell came across on Wednesday. In fact, according to this data aggregated by Bespoke Investment Group, Wednesday’s session was the worst final 90 minutes of a Fed day for the S&P 500 going back to 1994.
S&P 500 1D (Tradingview)
At the close on Wednesday, the index had fallen 2.50% on volume nearly 23% greater than its 50-day average. Thursday’s candle indicated a continuation of the selling.
% of S&P 500 Stocks Above 20-Day SMA 1D (Tradingview)
The chart above shows us the percentage of S&P stocks above their 20-day simple moving averages. The zone highlighted above shows us that once 80-95% of stocks are above their 20-days, the index is generally extended to the upside and due for a correction lower.
The turns lower after hitting this range are highlighted above with red circles. These occurrences have aligned well with legs lower for the price of the index.
It isn’t uncommon, however, to see a slight decline in breadth be enough to support a move higher, if buyers are aggressive enough.
At the moment, the Nasdaq has been the laggard index. In Q4, as of Thursday’s close, the Nasdaq Composite is down -2.20%, while the S&P is up 3.74% and the Dow is up 11.40%.
At the moment, the Nasdaq is only 2.46% above its Oct. 13th lows, that’s in comparison to 6.14% for the S&P, and 10.44% for the Dow.
Whether or not any of these indexes will breach their lows is anyone’s guess.
DXY 1D (Tradingview)
Expansionary monetary policy works to weaken the dollar by increasing the supply. As monetary policy becomes contractionary, we tend to see the growth rate of USD supply decline, or even become negative.
Due to the fact that Powell spoke about how there is much work left to be done in order to restore price stability, it’s unsurprising to see that the dollar has rallied this week.
Put simply, Powell said that we will continue to see a decline in the supply of USD in the near future. When you have less dollars competing for the same amount of goods (especially goods that have been affected by inflation), the purchasing power of $1 increases.
Furthermore, higher interest rates in the US increases demand for dollars as foreign investors gain access to higher yields on US debt.
US 10-Year Treasury Yield 1D (Tradingview)
With higher market interest rates comes higher yields on government debt. While yields are forward looking, in that a 75 bps hike was likely well priced in by Wednesday, Powell’s tone had an effect here as well.
This week we’re seeing higher yields for Treasuries across the board, excluding the shortest maturity T-bill, the 4-week.
Friday morning we received the Labor Department’s monthly jobs report, which has led to a nice rebound for equity, Treasury, and Bitcoin prices.
This data is showing a slight uptick in the unemployment rate, which now sits at 3.7% from 3.5% in September. Despite the 20bps uptick in unemployment, this data pointed to a larger than expected increase in non-farm payrolls, meaning that in the month of October more Americans joined the workforce than expected.
Nonfarm payrolls is a short-term look into the job market, while the unemployment rate shows us the longer-term trend. At the moment, we’re seeing a short-term uptick in Americans joining the workforce, but when viewing it from a broader time horizon, unemployment is beginning to increase.
Crypto-Exposed Equities
For crypto-exposed equities this week, we’ve seen last week’s strength roll over into a break lower. The dynamic that these stocks have between tracking the equity indexes vs. Bitcoin is complex, but interesting nonetheless.
Last week and the week prior, as Bitcoin showed early and outsized strength against the stock market, we saw crypto-equities bouncing alongside BTC. But early this week, as the indexes showed outsized weakness against BTC, crypto-equities are following the indexes lower.
As of Friday morning, we’re seeing a solid bounce in BTC over the stock indexes, and as expected, crypto-equities are joining the rally as well.
This week, we got more news of public miners having trouble upholding their debt obligations. Last week it was Core Scientific (CORZ), this week it was Iris Energy (IREN), and Argo Blockchain (ARBK).
This is typical bear market behavior for miners, although this cycle has been especially interesting for 2 reasons.
These companies were not publicly traded in previous cyclical bear markets.
Collateralising ASICs on bank notes, for the most part, wasn’t an option in the bull cycles that preceded previous cyclical bear markets.
As a result, we’re seeing defaults of interest payments result in the forced selling of ASICs on the public stage.
Most noteworthy, however, is that we’re still seeing hashrate rise, but more on this in the mining section below.
Above, as always, is the table comparing the Monday-Thursday price performance of several crypto-equities.
Bitcoin Technical Analysis
As we’ve previously alluded to, we’ve seen some weakness in BTC’s price action this week, albeit less than the equity indexes. As of Friday morning, BTC is rebounding nicely off support.
BTCUSD 1D (Tradingview)
On Thursday, BTC found support around its 21-day EMA at ~$20,015. Furthermore, BTC has found consistent buyers around the VWAP anchored off the June 18th low.
As you can see above, this AVWAP has been fairly significant for recent price action. Much of this trading around this AVWAP is likely algorithmic, and is a great example of why we look at key AVWAPs.
At the time of writing, price looks strong, but could see some resistance around $21.8k and $22.8k, if it makes it that high.
Bitcoin On-chain and Derivatives
The Price of BTC is approaching Realized Price, the average cost basis of all market participants, and Short Term Holder Realized Price, the average cost basis of Short Term Holders.
Both of these metrics represent key psychological levels that tend to serve as either support or resistance. We will see how the price reacts when it intersects with these metrics. Should price flip either/or into support, specifically STH RP, that would signal to the possibility that the bear market bottom is behind us. It does not guarantee such a fact, but it is evidence in favor of that idea.
Realized losses relative to market cap have diminished since the price initially dropped to the lower $20,000’s during the summer. What we have seen thus far appears to be similar to the 2018 bear market bottom: mass capitulation and realized losses following a sharp drop in price, followed by months of relatively sideways price action featuring diminishing realized losses during that time. This supports the idea we have discussed in previous newsletters that the most of the weak hands have already sold.
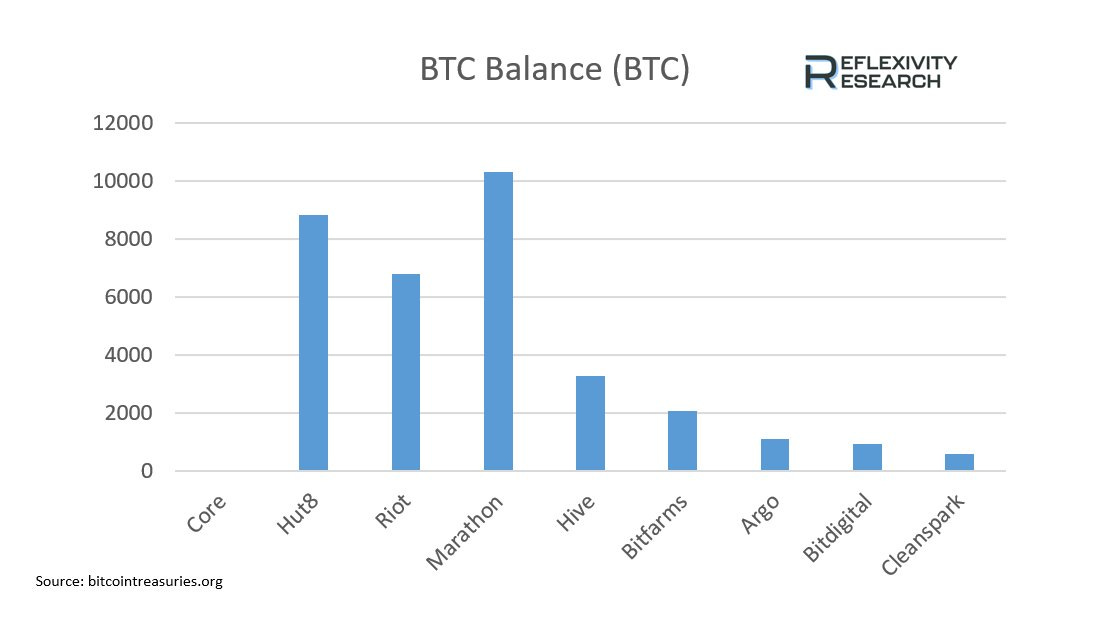
You will see in the mining section at the bottom of this newsletter that many of the biggest publicly traded miners in the space have very low Bitcoin treasuries. Couple that with the on-chain data showing that many of the entities left in the market are long term holders with strong hands and you can reasonably conclude that very little sell-side pressure remains and that Bitcoin is likely going to experience an upward move here shortly.
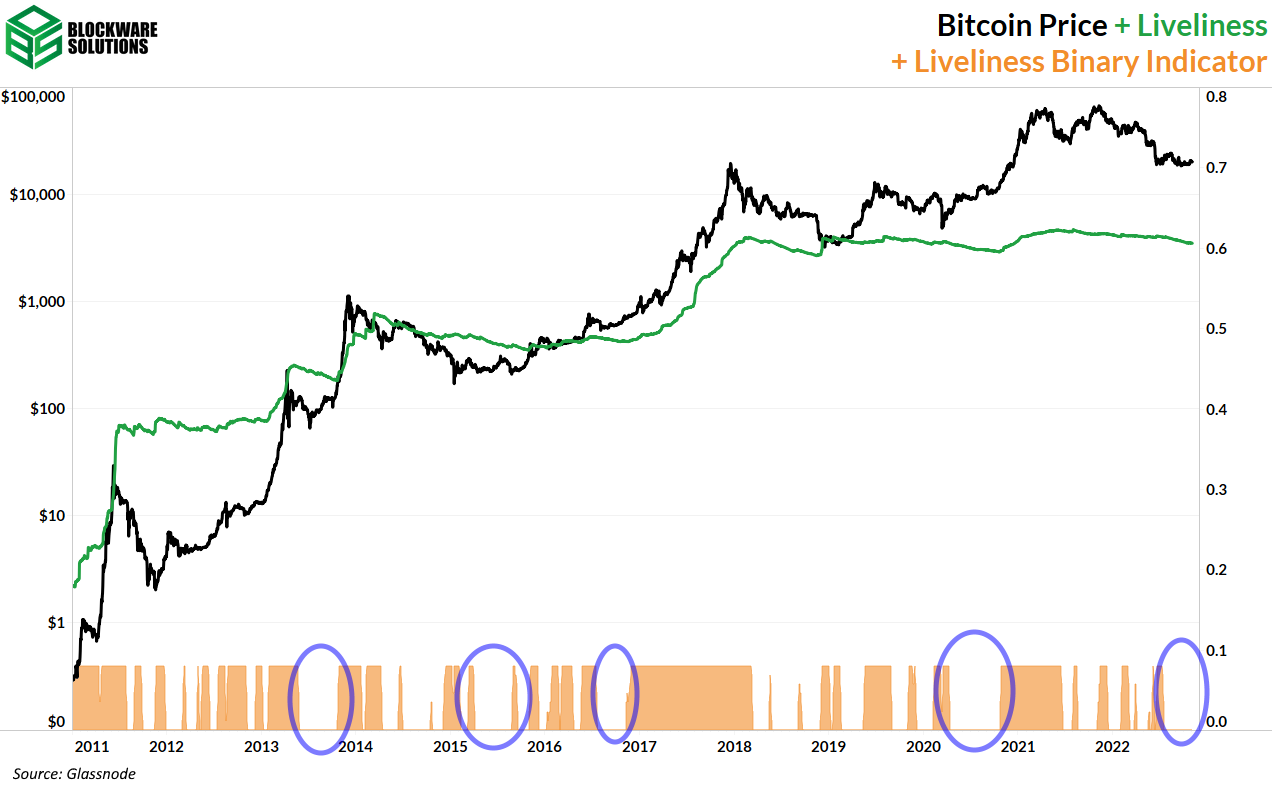
Long Term Holders have been accumulating the BTC of the capitulators. The new position change for long term holders has been ceaselessly positive for the past few months. As more sats continue to be acquired by this cohort it becomes increasingly likely that the bear market bottom has hit.
HODL Waves are showing the same behavior; accumulation by entities that are unlikely to sell their BTC. This is objectively bullish. The supply is limited and as a greater quantity of the supply is accumulated by entities unwilling to sell, the equilibrium between supply and demand will shift to a higher price.
The binary oscillator at the bottom indicates when Liveliness is below its 30 day moving average. As you can see, Liveliness has been in a prolonged period of decline. This further shows the accumulation by Long Term Holders. Prior periods of uninterrupted accumulation, similar in length to this one, have preceded positive price action.
Bitcoin Price is heavily influenced by network effects. By comparing the 30 day moving average of new addresses with the 365 day moving average of new addresses, we can gauge the amount of on-chain activity in the past month relative to the past year. Bull markets, of course, feature higher on-chain activity than bear markets. Ever since spring of 2021, which many people argue was the real bull market, not the fall ‘21 run to $69k, on-chain activity has been diminishing.
If the 30 day moving average of new addresses can surpass the 365 day moving average, that shows that on-chain activity is picking up steam and perhaps could be a positive catalyst for price action moving forward.
The build up of Perpetual Futures Open Interest has subsided slightly this week. However, there is still plenty of open interest able to be wiped out. The recent price action was not the major volatile move that we have been looking for.
Once again, we would like to look at Realized Volatility. This little volatility has historically preceded moves up in price, with the exception being the 50% drop to the 2018 bear market bottom. However, as we have noted with other on-chain metrics, it is highly likely that we have already experienced the biggest capitulatory moment.
Bitcoin Mining
Large Overleveraged Miners are Under High Stress
CORZ (Core Scientific), Northern Data, ARBK (Argo), and IREN (Iris Energy) are all either defaulting or on the verge of defaulting on their debt that was issued to purchase ASICs and mining infrastructure.
The mining bull market in 2021 enabled many Bitcoin miners to issue significant amounts of debt to really go “all in” on mining Bitcoin. Unfortunately, it hasn’t worked out as planned, and many of the once largest players have very little BTC left in their treasury. Will Clemente’s firm, Reflexivity Research put together the chart below.
Core Scientific controls the most hash rate out of all public Bitcoin companies, yet it has almost 0 remaining BTC in its treasury. This is quite fascinating since Core holds ~ 5% of the total network hash rate. This symbolically shows how tough this bear market has been for Bitcoin miners, as even the largest players in the mining industry can’t hold any BTC.
However, even with all of the debt default and capitulation talk, total network hash rate continues to climb higher. Most of the firms mentioned above are still running their rigs at full speed, and it likely will continue unless Bitcoin makes new lows.
Not all public miners are struggling. Clean Spark appears to be the miner acquiring many of the cheap rigs other mining companies are defaulting on. They signed a deal with Argo (ARBK) - $5.9M for 3,843 S19J Pros, and since the bear market started, they have purchased over 26,500 rigs.
The Energy Industry and Bitcoin Mining
The largest publicly traded company to adopt a Bitcoin standard has been Microstrategy (MSTR). Since that initial moment in 2020, there have been few companies to follow in Saylor’s footsteps. It is possible that we will soon see another large company take a leap of faith into the Bitcoin industry.
While this is currently highly speculative, large participants in the energy industry should be looking deeply into acquiring one (or many) distressed Bitcoin mining companies. Since March 2020, the energy industry has been one of the few sectors to maintain its steady climb throughout 2022. Much of this can be attributed to a lack of supply (low CapEx spending over the last 10 years) and geopolitics. Energy companies with strong balance sheets and steady cash flows are likely to consider getting exposure to the Bitcoin mining industry. Acquiring a Bitcoin mining company would enable them to always have an energy buyer of last resort (a hedge against lower energy prices), and it would enable them to capitalize on an upcoming Bitcoin bull run.
As Bitcoin matures and ASICs commoditize, the energy industry and Bitcoin mining industry are more and more likely to merge. Miners need the cheapest energy and energy producers usually have excess wasted energy during certain times of the day.
In summary, Bitcoin miners are cheap, and it’s very logical for an energy company to get exposure.
All content is for informational purposes only. This Blockware Intelligence Newsletter is of general nature and does consider or address any individual circumstances and is not investment advice, nor should it be construed in any way as tax, accounting, legal, business, financial or regulatory advice. You should seek independent legal and financial advice, including advice as to tax consequences, before making any investment decision.


Thank You!
So many good insights! Thank you for this newsletter. Really learning from it.