Blockware Intelligence Newsletter: Week 10
On the edge of glory
Dear readers,
Hope all is well and you had an awesome week. Bitcoin has had yet another strong week, testing just shy of $60K overnight. Let’s dive into some trends that are probably worth paying attention to.
First of all, Bitcoin sits now sits at the very edge of realized price distribution. This shows the amount of BTC last moved at each denomiated price level. There is now just 0.68% of Bitcoin’s supply last moved above us. This means there is very little resistance or overhead supply to the upside.
Nothing has changed with SOPR, still seeing continued upside after this recent textbook bounce that confirmed we are in a bullish trend.
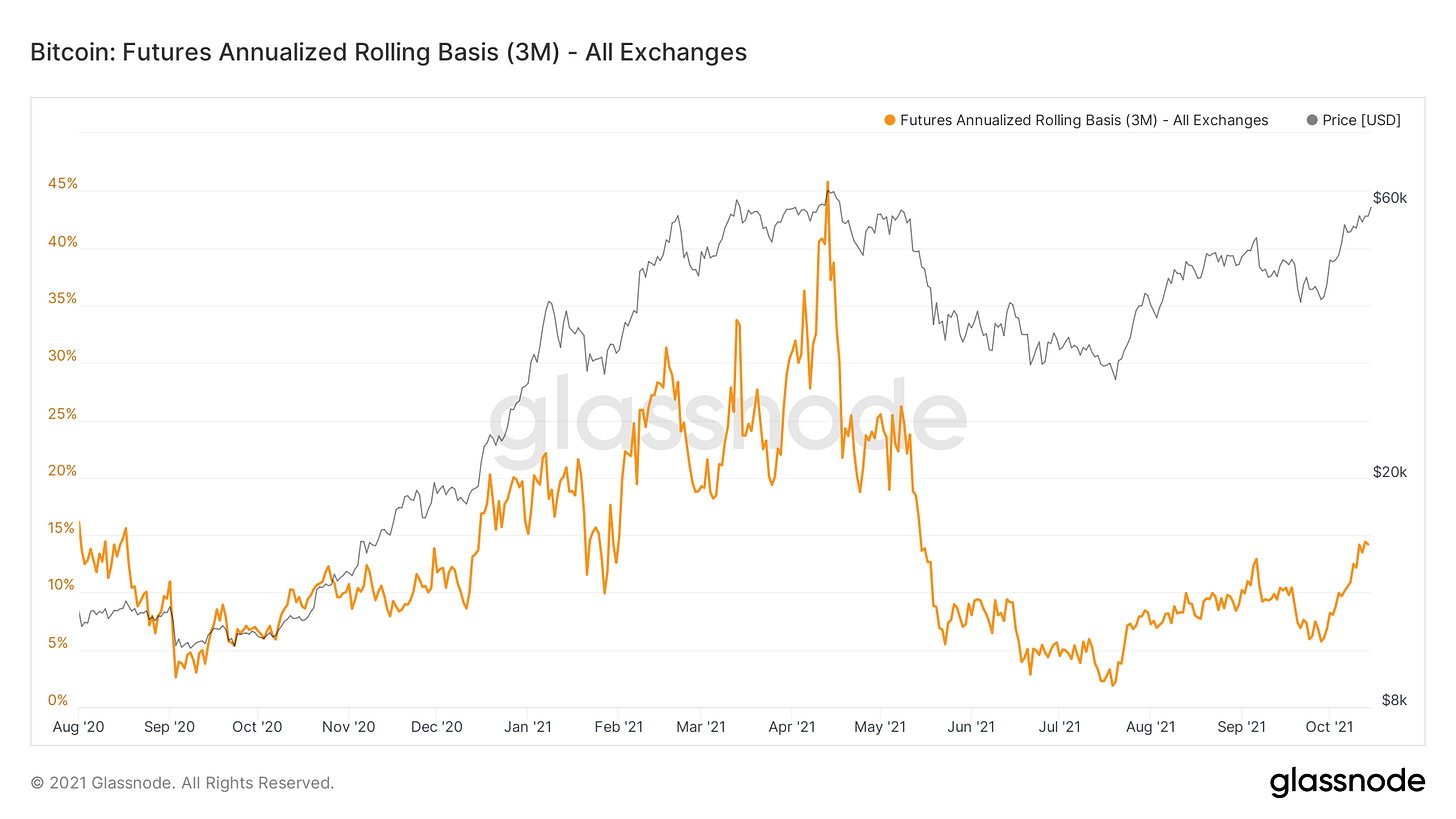
Aside from Huobi, Bitcoin’s futures curve is in contango. This means that the curve slopes positively and contracts further out on the term structure are higher than the previous. But why is this important?
Futures being in contango creates an opportunity for active mangers to take a non-directional position in the Bitcoin market to arbitrage the spread between spot and futures. This is done by buying spot and selling futures, also called cash & carry. The annualized 3M futures basis is now at 14.18%, still far from earlier this year, but something to definitely keep an eye on.
If the vehicle gets significant volume/adoption, a futures ETF would likely bid the CME futures curve rather aggressively. This would open up the opportunity to US based funds to capture the futures basis. Earlier this year CME’s basis lagged behind overseas exchanges such as Deribit, FTX, Huobi, Binance, OkeX, Bybit, etc. because CME doesn’t have access to massive leverage and is cash-settled. This meant due to regulatory restrictions US funds were widely left out of the cash/carry tade although many took part in the Grayscale arbitrage.
Another interesting trend in the derivatives market is the decrease of crypto margined futures. This means less convexity to the downside and shorts are more likely to be squeezed as they no longer have an inadvertent hedge via their collateral. I suspect that this will reverse once breaking all time highs but we’ll keep an eye on it.
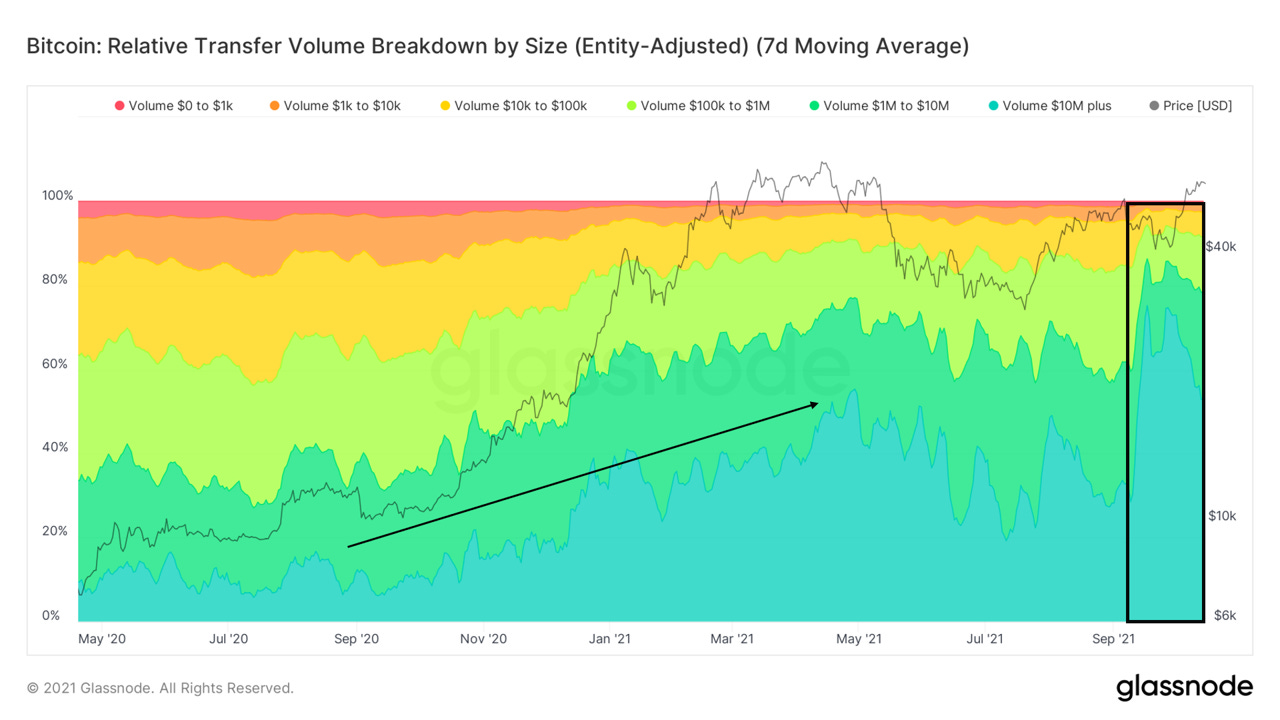
Over the last month we’ve seen a large increase in overall volume from $10M+ transactions, reaching as high as 84% of overall volume. This is probably partially due to exchange batching but primarily large OTC transactions. (whales are active in the market)
This is also reflected in our entity data. We’ve been talking about whales since July. Although they started to trim their holdings a bit over the last month, we’ve actually seen the 100-1K cohort offset their selling by over 1,000 BTC in that time period. Overall, conclusion is that large buyers have indeed been active in the market.
We’re starting to see transactional activity pick up again, back up to levels not seen since May. To me this reflects that we really haven’t seen full blown speculation enter back into the market and paired with large TXs dominating volume suggests retail still hasn’t entered the market. (also shown by google search trends and Coinbase app downloads)
Macro still highly bullish. Long term holder supply shock has soared to unquestionable new all time highs.
Remember: At some point we will start to see LTHs begin distributing, which is normal. Long term holders (and whales) buy weakness and sell strength. (see 2017 & 2020)
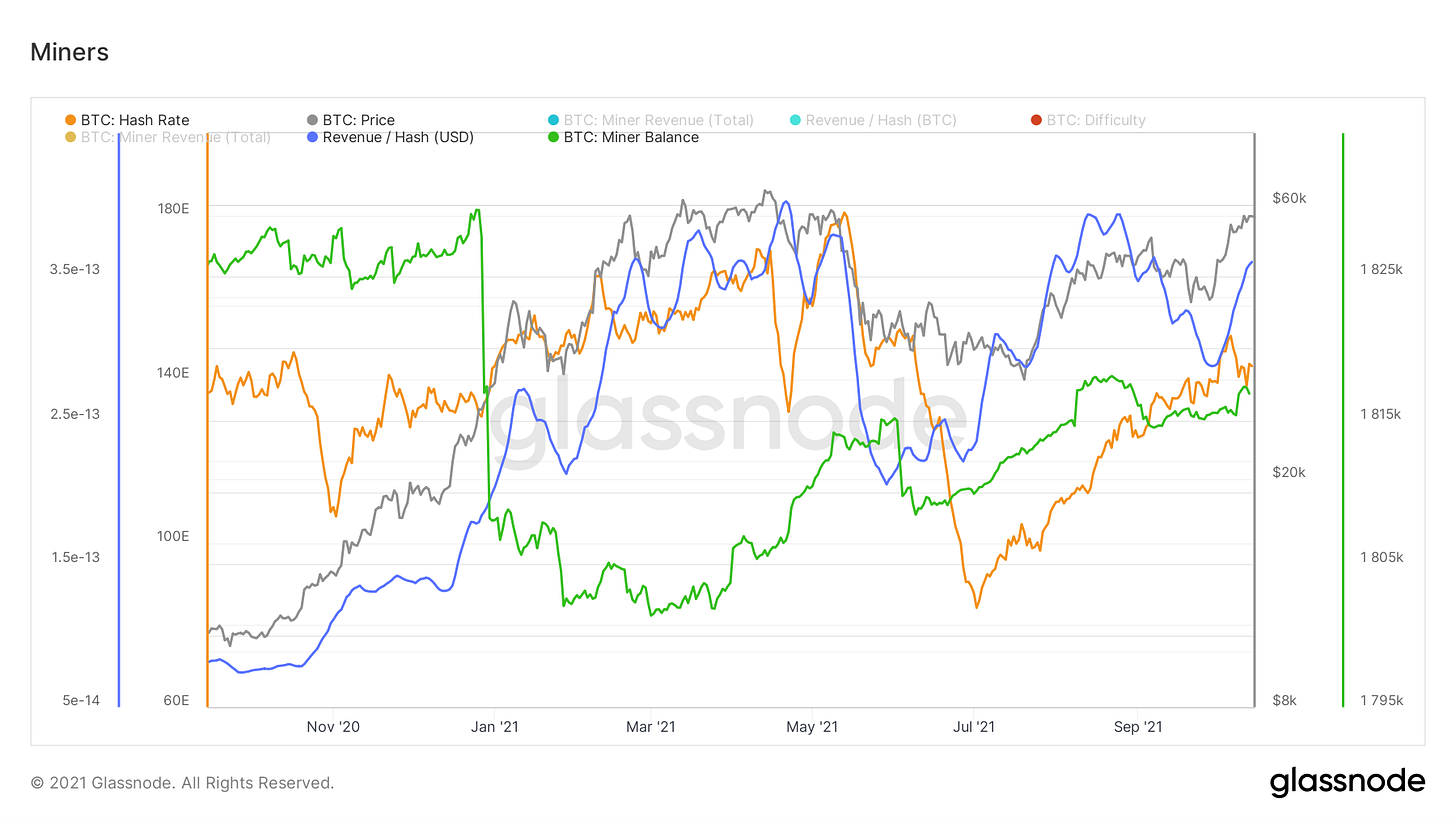
Lastly, we take a peek at miner related data. Slight drawdown in hash this week, although not surprising to see with it having been up only since July. Despite this increase in hash and 6 consecutive difficulty adjustments, Revenue/Hash in USD terms is higher than where it was after the miner exodus. (thanks to higher Bitcoin prices) Also got a nice little uptick in miner’s balances this week.
Bitcoin-related Equities (by Blake Davis)
Overall, it’s been a relatively quiet week on the front of crypto-exposed equities. While a fair amount of names look to be forming bottoms or shaping up to make new highs, there are plenty of crypto names that haven’t done much. This is pretty surprising to me as Bitcoin has had a nice week, up over 5% at the time of writing. A great piece of advice I got a while back is that: “Every day or week isn’t of equal importance in the stock market.”. In my opinion, all price action is important to an investor to a certain extent, but weeks like this where many crypto names are consolidating gains or building bases, there wasn’t too much to miss. Knowing this, let’s take a look at the market indexes.
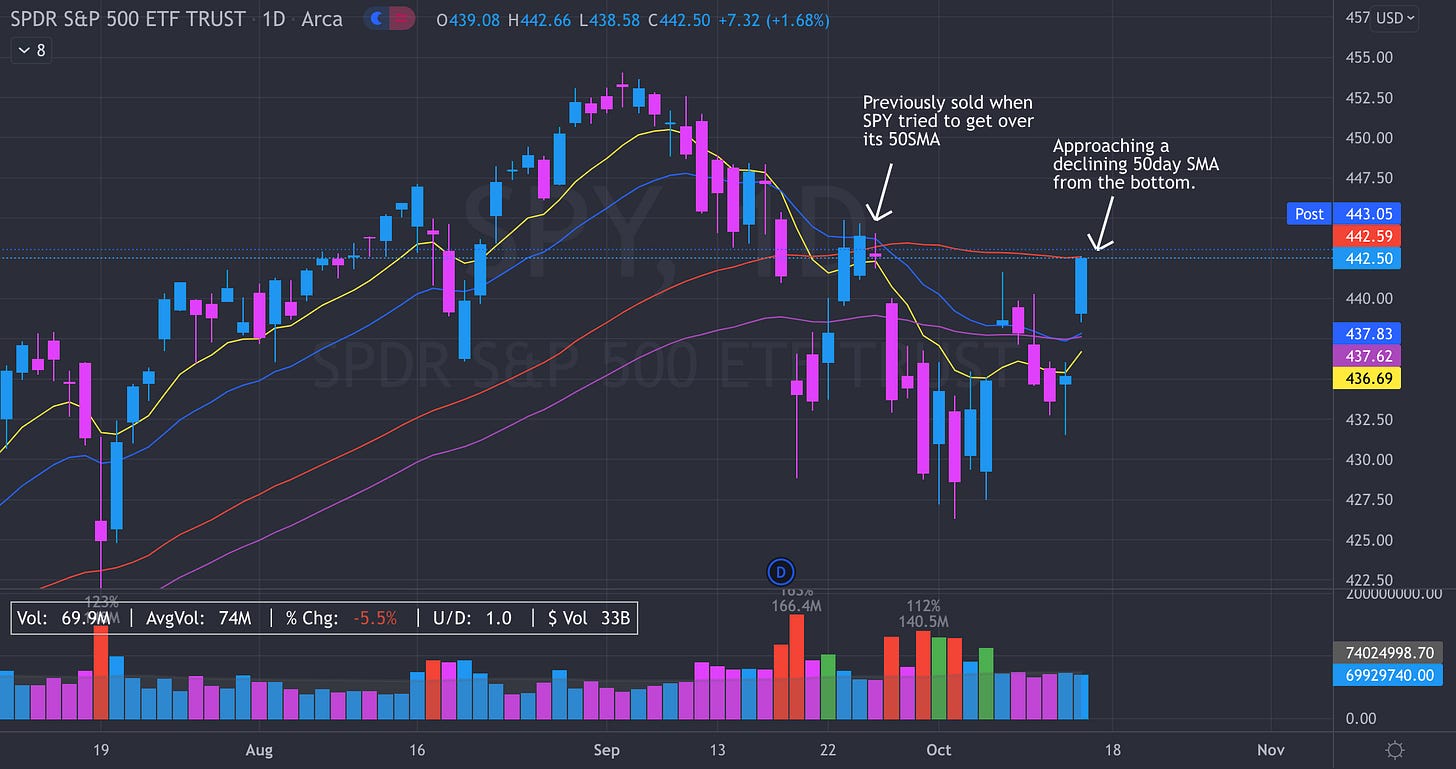
Both the Nasdaq and S&P had big days on Thursday, clearing over some longer-term moving averages to the upside. But one thing we need to keep an eye on is the declining 50 day simple moving average on both of these indexes. As I discussed last week, running into a declining moving average from the underside is often a place where supply enters the market. Investors who are underwater on their buys, or even bought off the bottom, often take profits at the average price over “x” amount of days. It can take multiple attempts to get over an area of strong resistance. I’m not one to try to predict what will happen, so this situation is absolutely something investors should be prepared for. On the chart of SPY below, the 50 day SMA is the red line, the Nasdaq has a similar look. Using the style of growth investment that I prefer, many refuse to buy stocks when the indexes are below their 50 day moving averages. People often say: “Nothing good happens below the 50 day”. This means that until the indexes prove themselves to be in an uptrend by clearing the 50 day, it is usually safer to stay on the sidelines. However, it’s my opinion that in an environment where growth stocks are ripping higher without the indexes, we can still be buying quality stocks but with not nearly the same position sizes as we would if the indexes looked great.
This week I’d like to break down a chart of the Canadian Bitcoin miner, Hut 8 (HUT), who is forming one the most classic of price patterns in history. The cup and handle is the most famous work of my personal favorite investor, William O’Neil. It is identified by a drawdown and then a return up towards highs forming a semi-circle, or cup, shape. Then, before reaching new highs, price will pull back slightly before fully breaking out into new all-time highs. We need to keep in mind that although stocks usually break out from an identifiable pattern, they aren’t a sure way of knowing you’re looking at a winner. The success of a pattern depends on a ton of different things, the most important being support from the market, or in this case BTC, moving up with it and providing fuel for the fire. This is why we wait for stocks to prove themselves to us before buying them. Something that looks great this week might run into trouble next week if the market doesn’t let it run.
There are two clear pivot points (ideal buy prices) on this chart. The first of which is around $11.30, this is the area where price would be at the start of the handle formation. The next, and safest, pivot would be at new all-time highs at $13.00. Another thing that stands out to me is on the weekly chart included below. Most of history’s big winners ride their 10 week simple moving averages for months at a time when reaching new highs. On HUT’s previous run (Dec ‘20-Feb ‘21), it held this moving average the entire time, only breaking it to form this current base. When HUT went to make its handle, it was supported at its 10wk MA (yellow line). I’d like to see the 10wk continue to provide support for the massive volume we’ve seen pouring into HUT the last couple months.
I also should note that I do currently have a position in HUT. I cheated to enter a little earlier, buying a short-term downtrend line break last week.


