

Blockware Intelligence Newsletter: Week 214
Bitcoin on-chain analysis, mining analysis, macro analysis; overview of 6/8/26 - 6/12/26

SUMMARY
Short-term holders dumped coins at a loss at their cost basis, the same behavior we flagged two weeks ago through SOPR. ETF allocators sold ~$4.3 billion over 13 straight days. Now miners, the most economically rational participants in the entire ecosystem, are unplugging machines at a pace seen only a handful of times in Bitcoin’s history. Meanwhile long-term holders sit on a record 15 million BTC and old coins are not moving. Forced selling always ends before the price recovers, and every data set we track says we are deep into the final innings of it. The bottom is a process, not a moment. This is what the process looks like.
Key Takeaways
Bitcoin trades near $63,000, down roughly 22% from the May rejection at the short-term holder cost basis and about 50% below the October 2025 high of $125,000.
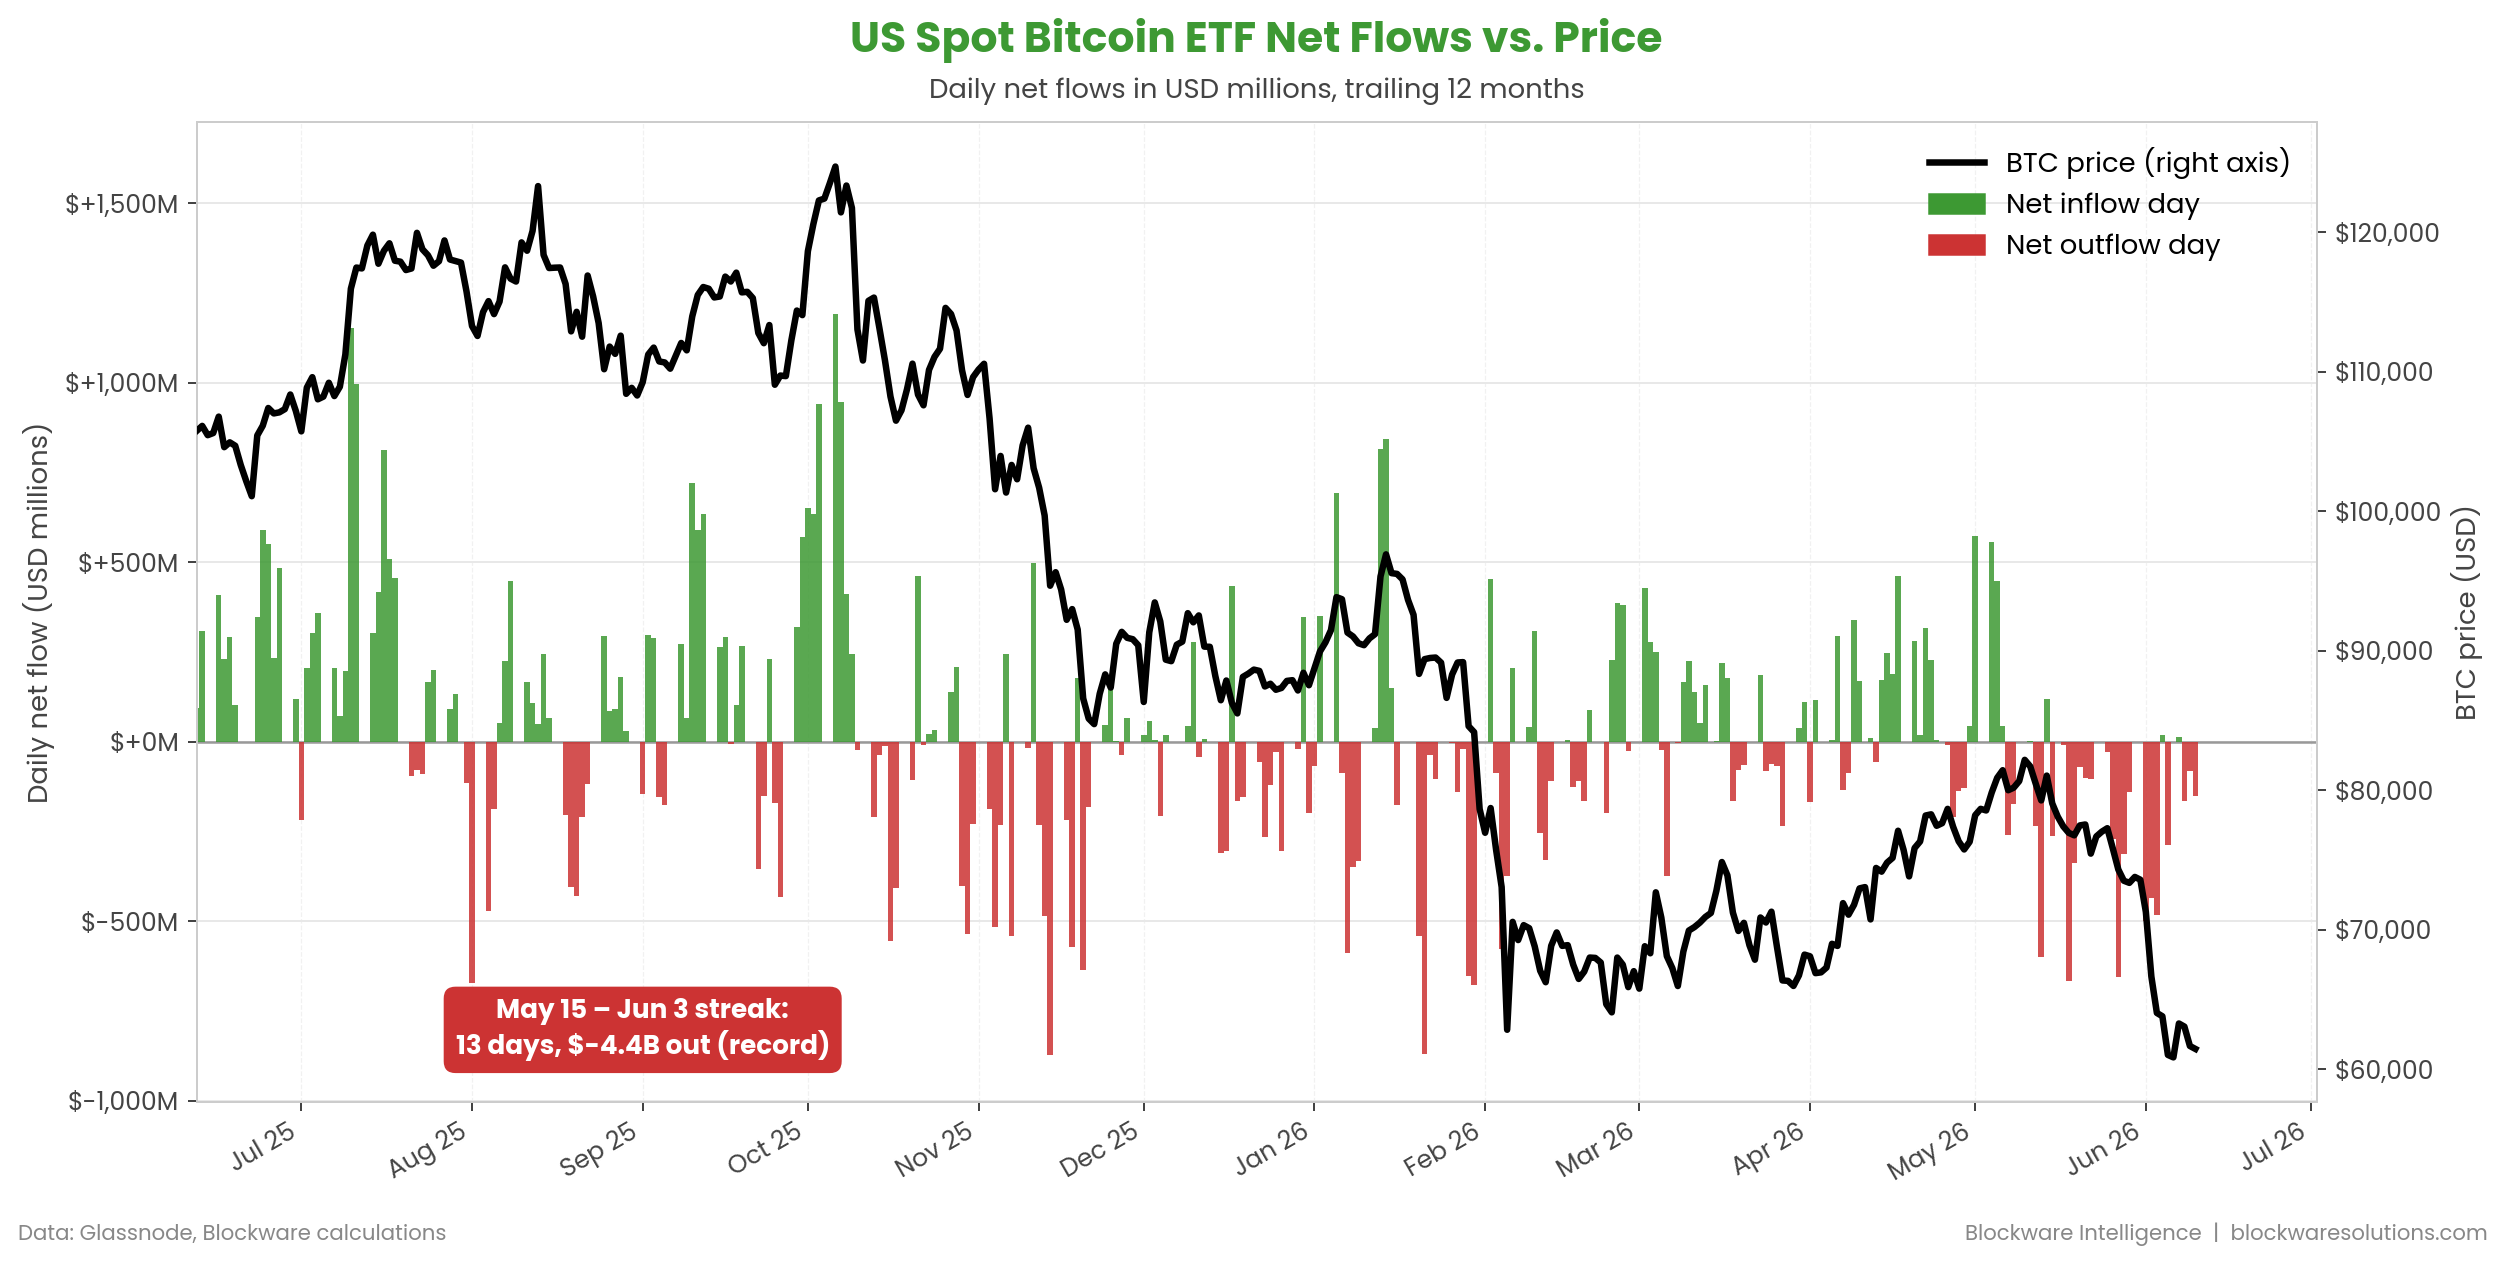
Spot Bitcoin ETFs posted their longest outflow streak ever: 13 straight trading days and $4.3 billion in redemptions from May 15 through June 3. That streak has now broken.
Mining difficulty is set to drop roughly 10.3% this weekend, the 11th largest downward adjustment in Bitcoin’s history and the second double-digit drop of 2026.
Hash Ribbons have flipped into miner capitulation. Every major Bitcoin bottom of the past decade featured this exact signal.
May CPI came in at 4.2%, the first reading above 4% in three years. Nearly all of it was energy. Core inflation was 2.9% and core goods prices actually fell.
The 10-year Treasury yield held near 4.5% even after the hottest inflation print since 2023. The Fed meets June 17 and is expected to hold.
Equities had a whiplash week: the worst Nasdaq day since April 2025, followed by a broad rally as the US and Iran moved toward a peace deal that could reportedly be signed within days.
Two trades account for the entire S&P 500 gain in 2026: AI-driven technology and war-driven energy. The other nine sectors are a net drag on the index, and financials and staples sit at the bottom.
The sellers are running out. Short-term holders capitulated at their cost basis, ETF outflows hit records, and now miners are unplugging machines. These are all signs that point towards a bottom formation.
SpaceX reaches a $2T+ Market Cap on IPO Day. With ~18,000 BTC on their balance sheet, they are the largest company on earth to hold a Bitcoin position.
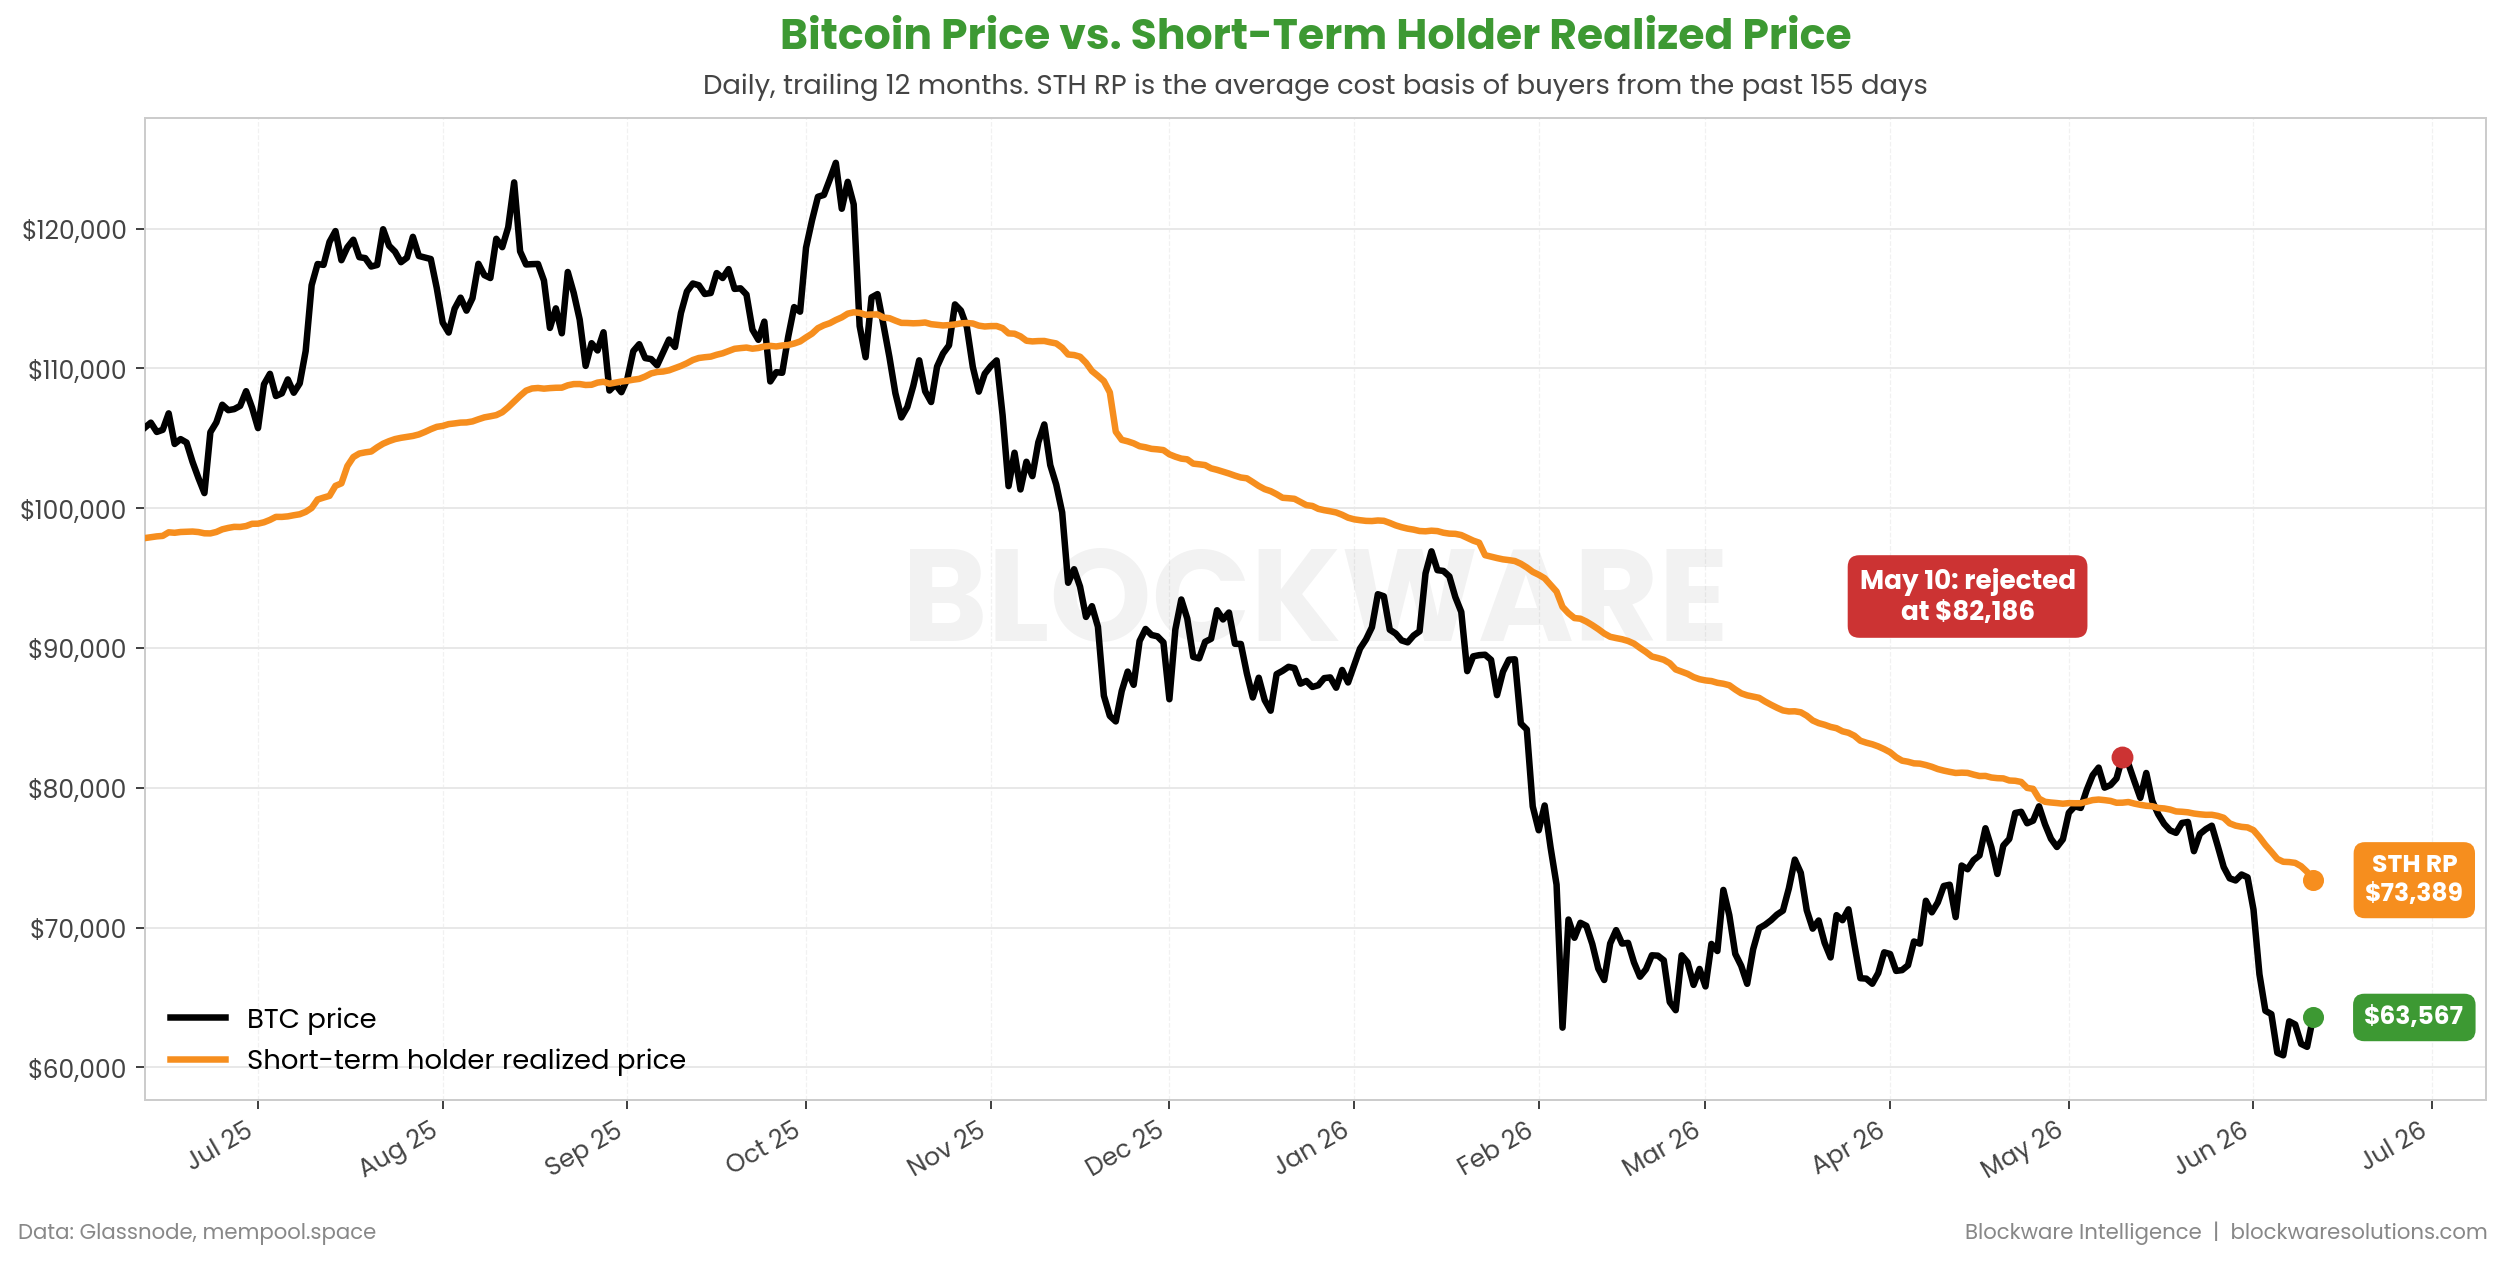
Two weeks ago we wrote that Bitcoin had been rejected at the short-term holder cost basis for the fourth time in four years, and that history pointed to roughly two months of consolidation before the next leg higher. The market chose a faster and more painful route. Instead of going sideways, BTC flushed from the rejection near $82,000 down to lows around $61,000, a 25% decline in under a month. The psychology is the same one we described then: short-term holders bought the rally, got turned away at their break-even level, and sold. They just did it with urgency instead of patience.
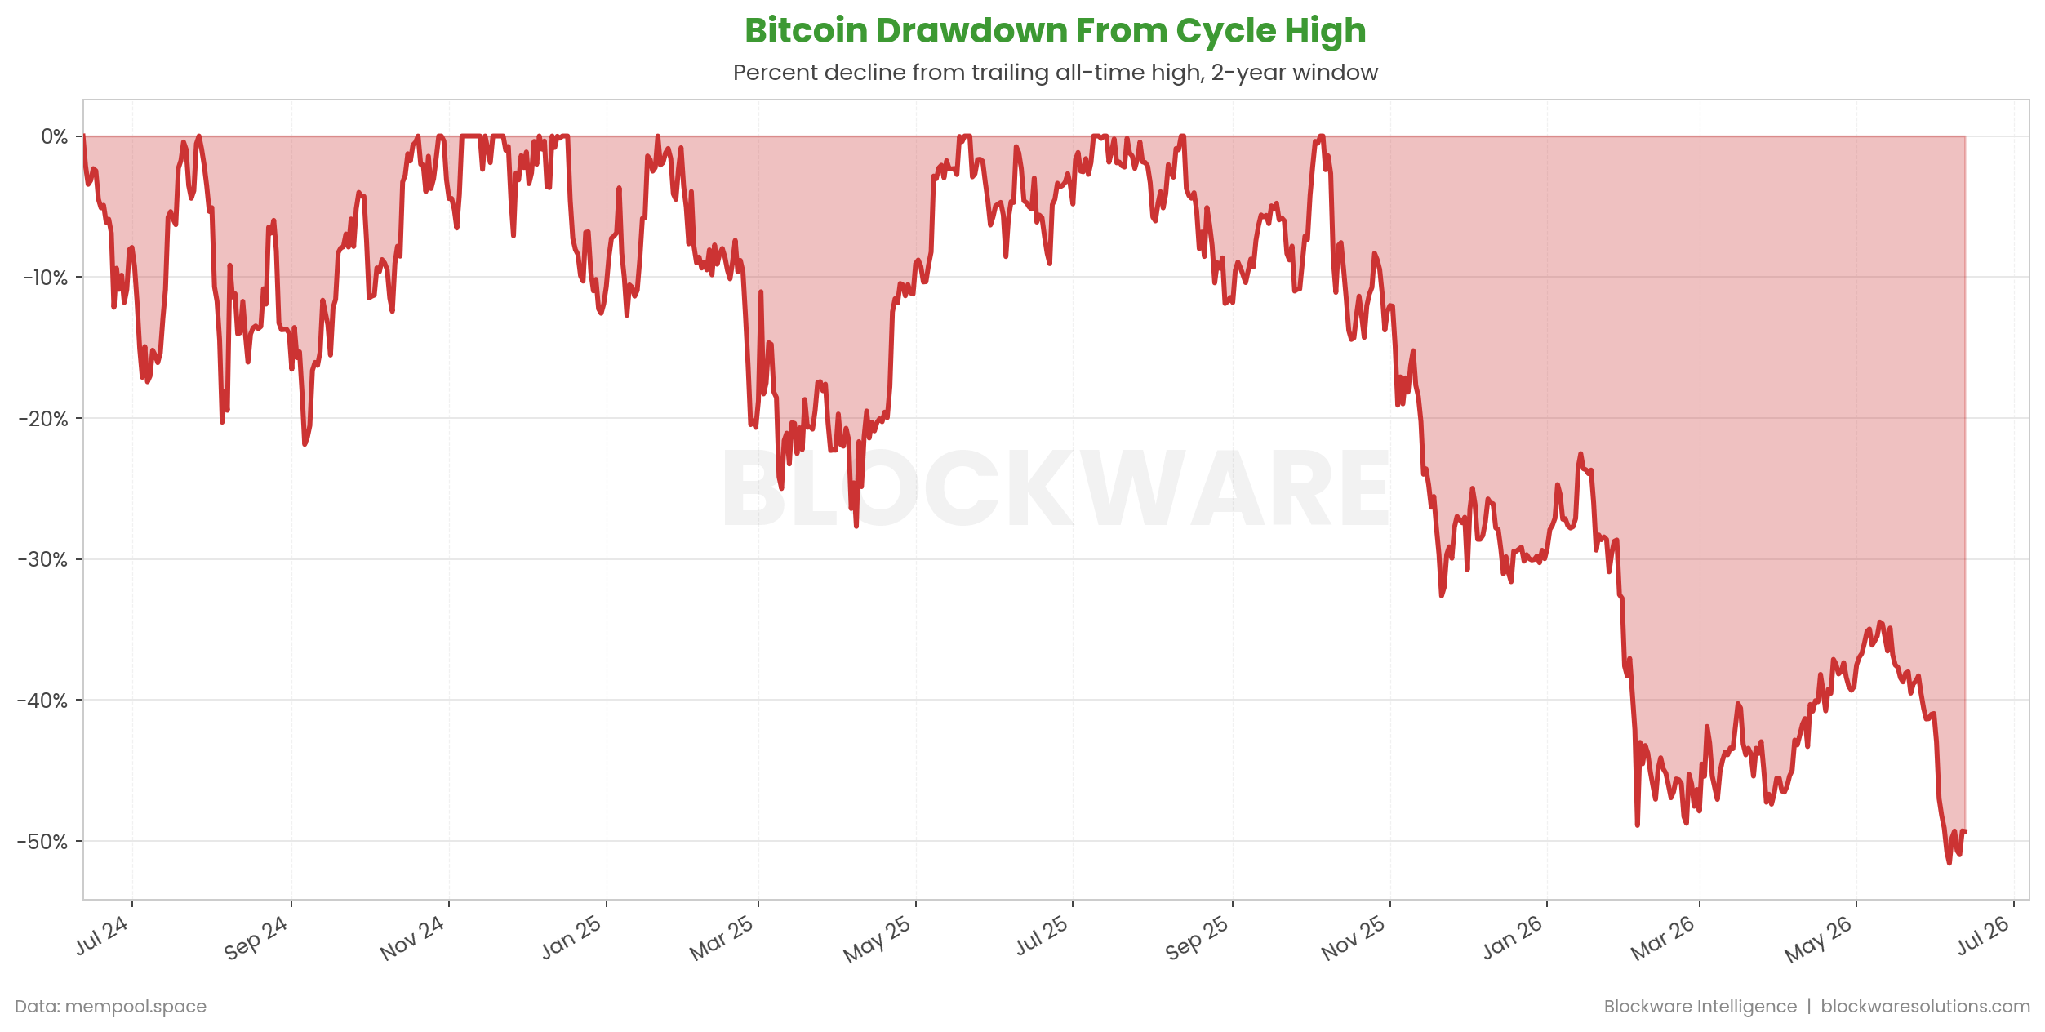
At the lows, Bitcoin was down 51% from the October 2025 peak of $125,000, the deepest drawdown of this era. The Crypto Fear & Greed Index touched 8 on June 8, its lowest reading since April 1 and deep in extreme fear. For context, the 2022 bear market bottomed at a 77% drawdown and 2018 bottomed at 84%. This decline has been driven entirely by recent buyers and ETF redemptions, while the on-chain structure underneath has not broken. Long-term holders still sit on a record supply of roughly 15 million BTC, and old coins are still not moving.
The ETF data tells you exactly who was selling. US spot Bitcoin ETFs recorded 13 consecutive trading days of net outflows from May 15 through June 3, the longest streak since the products launched in January 2024, shedding $4.33 billion and 59,351 BTC according to Galaxy Research. Total ETF holdings fell about 7% from their October peak to 1.28 million BTC. These funds were the marginal buyer on the way up, and for three weeks they were the marginal seller on the way down. The streak broke on June 4 with a small net inflow, and flows have stabilized since.
Short-term holders capitulate & ETF allocators capitulate first. Miners capitulate last, because turning off a machine is a business decision, not an emotional one. A miner only unplugs when the Bitcoin coming out of the machine is worth less than the electricity going in. That is happening right now, and the slower block confirmation times makes it impossible to hide.
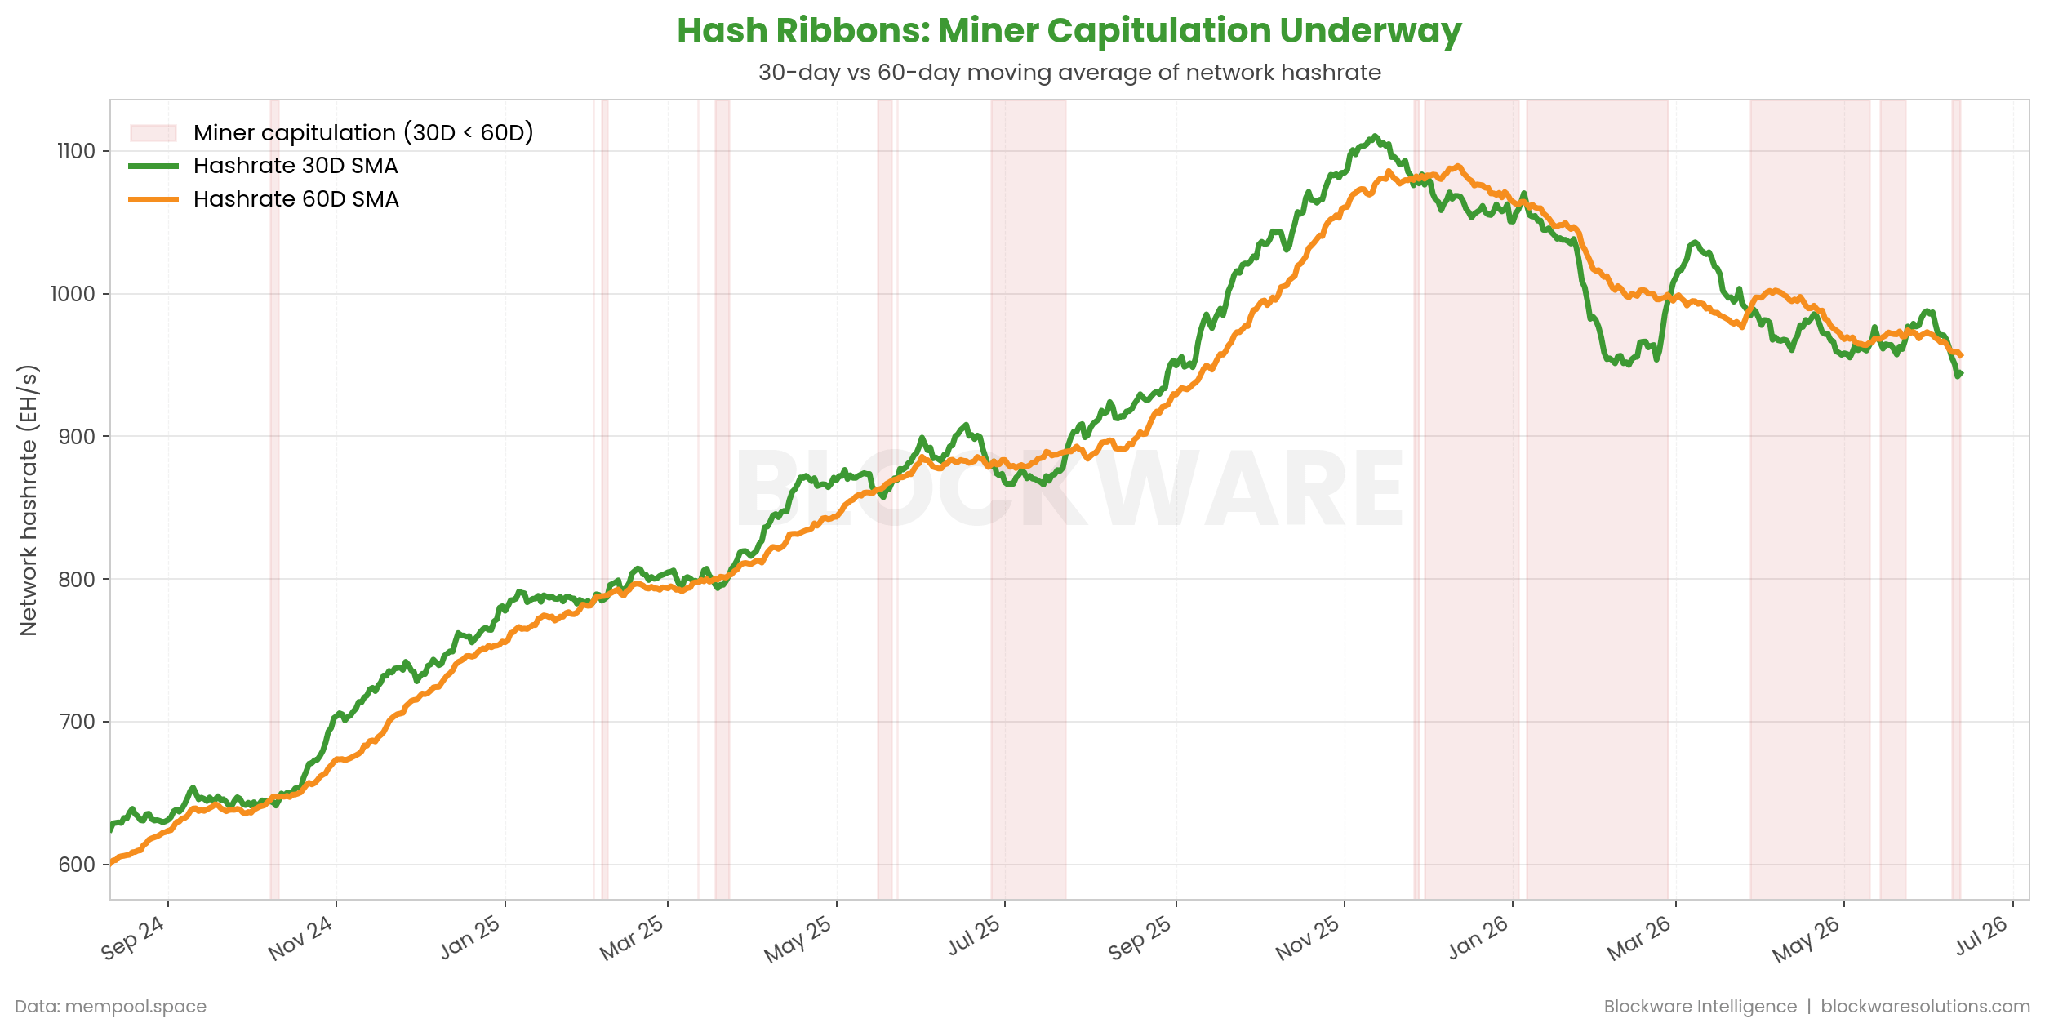
Hash Ribbons compare the 30-day average of network hashrate to the 60-day average. When the 30-day crosses below the 60-day, machines are coming offline faster than new ones are being deployed. That is miner capitulation, and the ribbons have just inverted again. This signal flashed at the $60,000 low in Q1 of this year, and before that it marked the December 2018 bottom, the March 2020 COVID crash, the 2021 China mining ban, and the 2022 bear market low. It does not fire often. When it does, it has historically been one of the best accumulation signals Bitcoin has (aside from weather-induced curtailments).
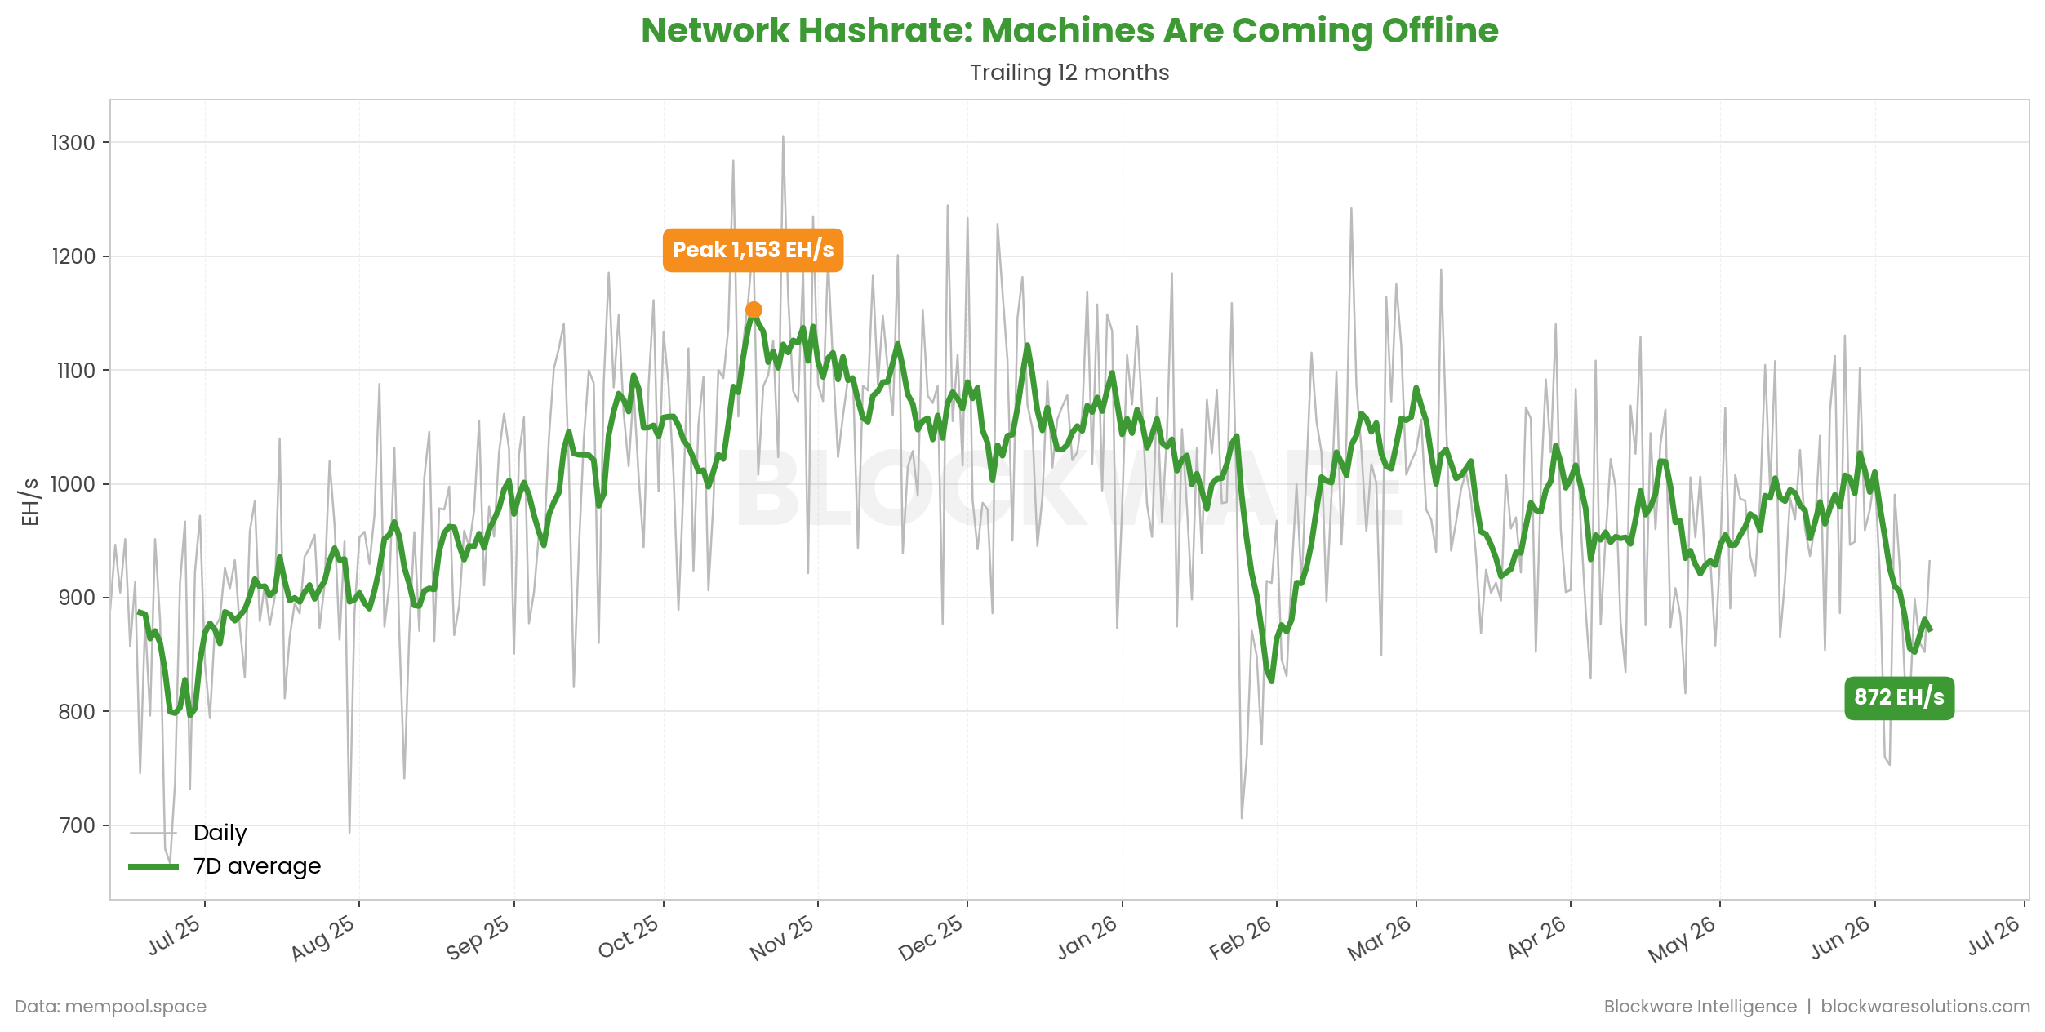
Network hashrate peaked above 1,100 EH/s in late 2025 and daily readings are now under 900 EH/s. Two forces are at work. The first is pure economics: older machines and operations paying high power rates simply do not make sense economically with BTC at $62,000, so they go dark. The second is structural: several large public miners are redirecting power and data center capacity toward AI and high-performance computing, permanently removing hashrate from the network. Both forces shrink the competition for everyone who stays plugged in.
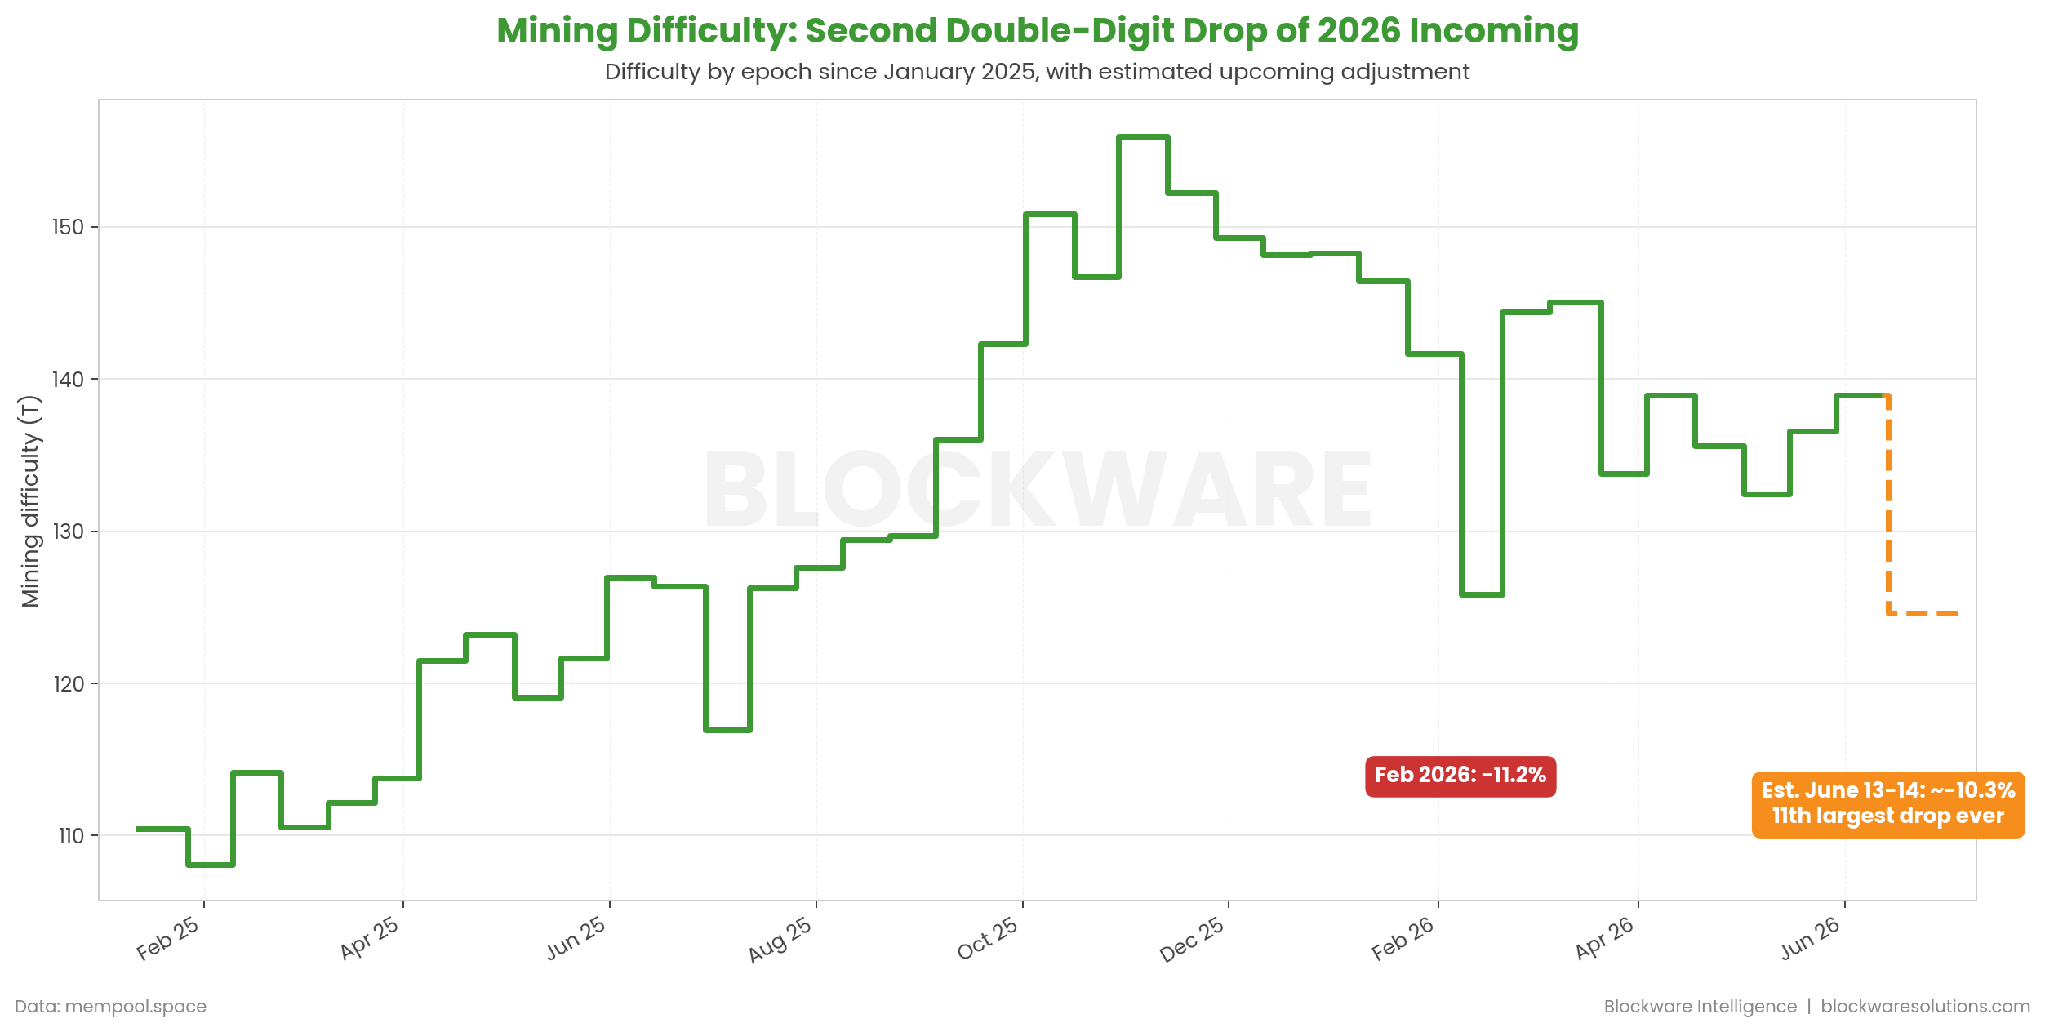
Bitcoin recalibrates mining difficulty every 2,016 blocks, roughly every two weeks, so that blocks keep arriving every 10 minutes on average regardless of how many machines are running. With hashrate bleeding off, the next adjustment lands this weekend at block height 953,568, and it is projected to cut difficulty by roughly 10.3%, from about 139 trillion down to about 125 trillion. It follows the 11.2% drop in February and would be the second double-digit decline of 2026. For every miner who stayed online, this is an immediate raise: the same machine earns roughly 11% more BTC overnight.
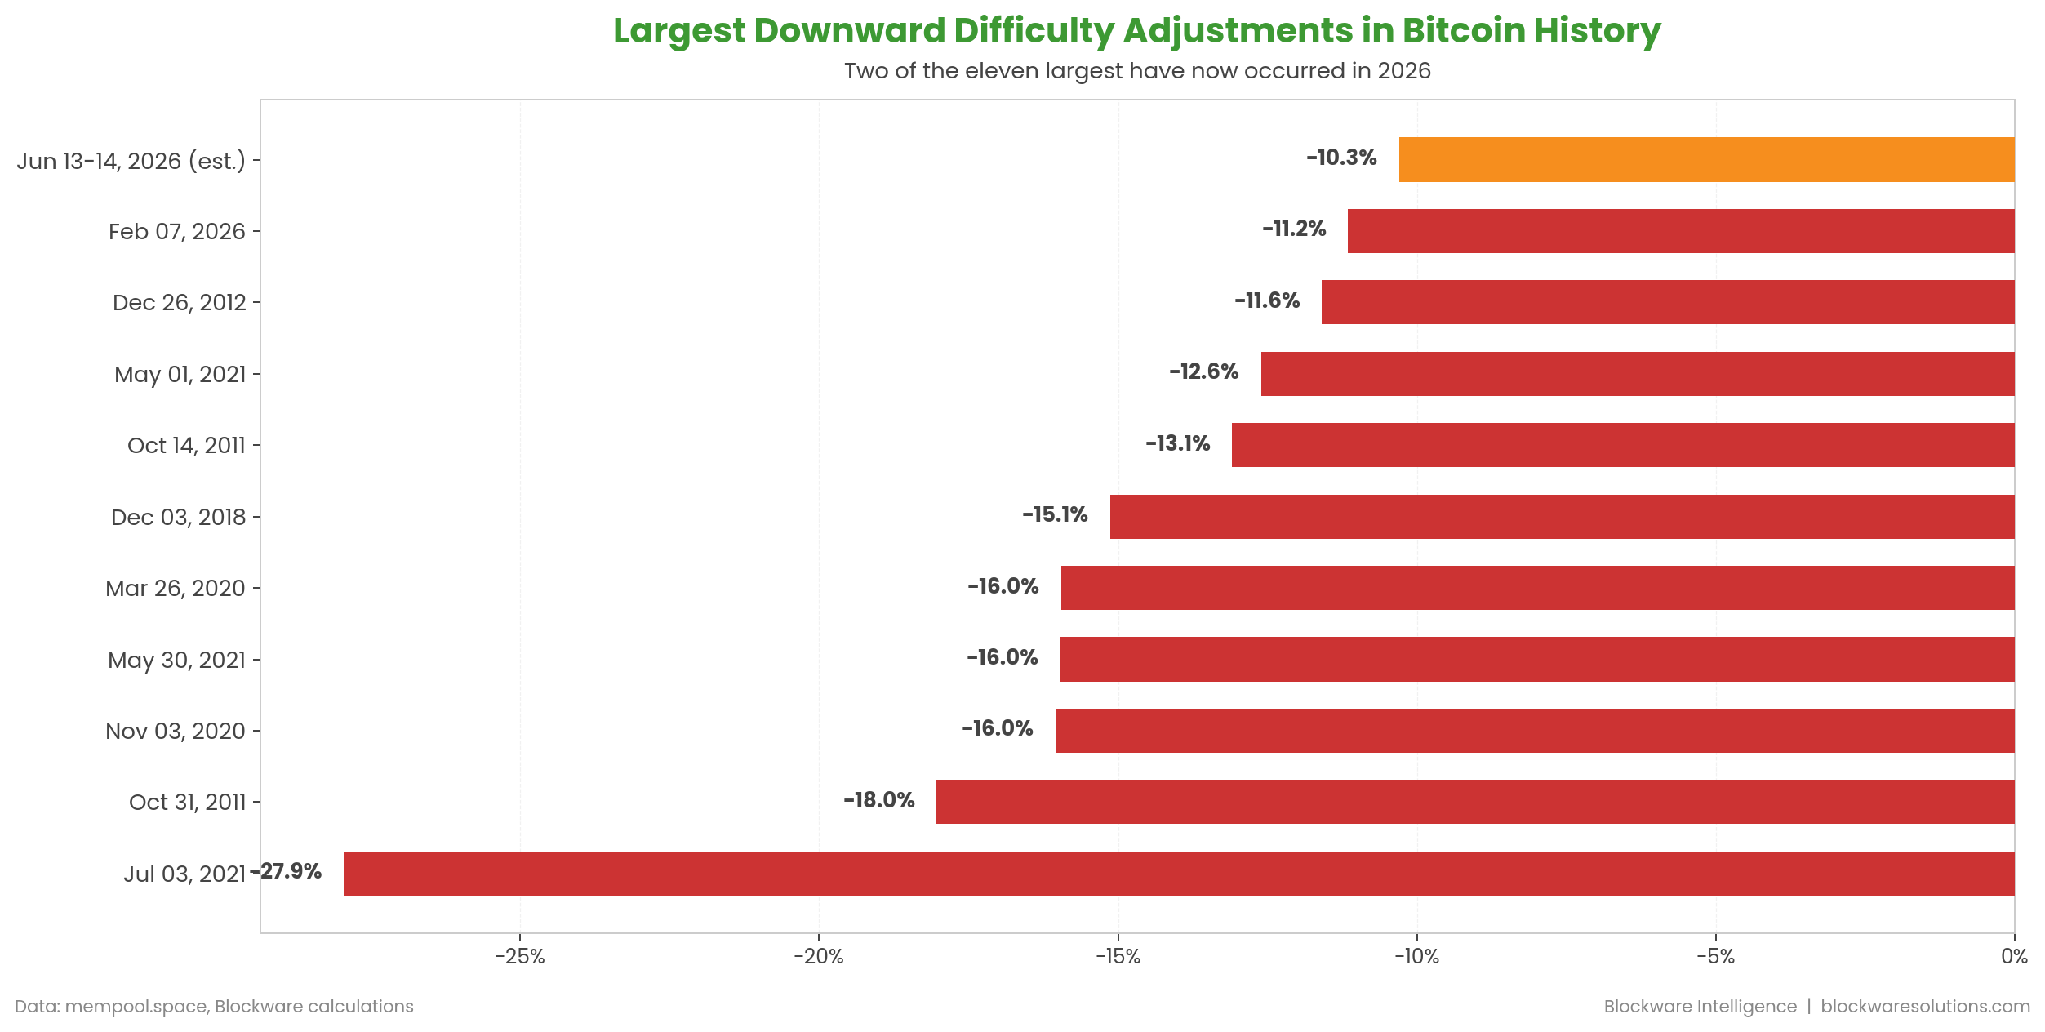
If the estimate holds, this will be the 11th largest downward difficulty adjustment in Bitcoin’s history. Look at the company on this list: the July 2021 China mining ban, the March 2020 COVID crash, the December 2018 bear market bottom, the November 2020 China rainy season migration. These adjustments cluster at moments of maximum stress, and every single one preceded a major recovery. The only year with multiple top-eleven drops was 2021, and that required a government banning mining across an entire country. This one is happening on economics alone.
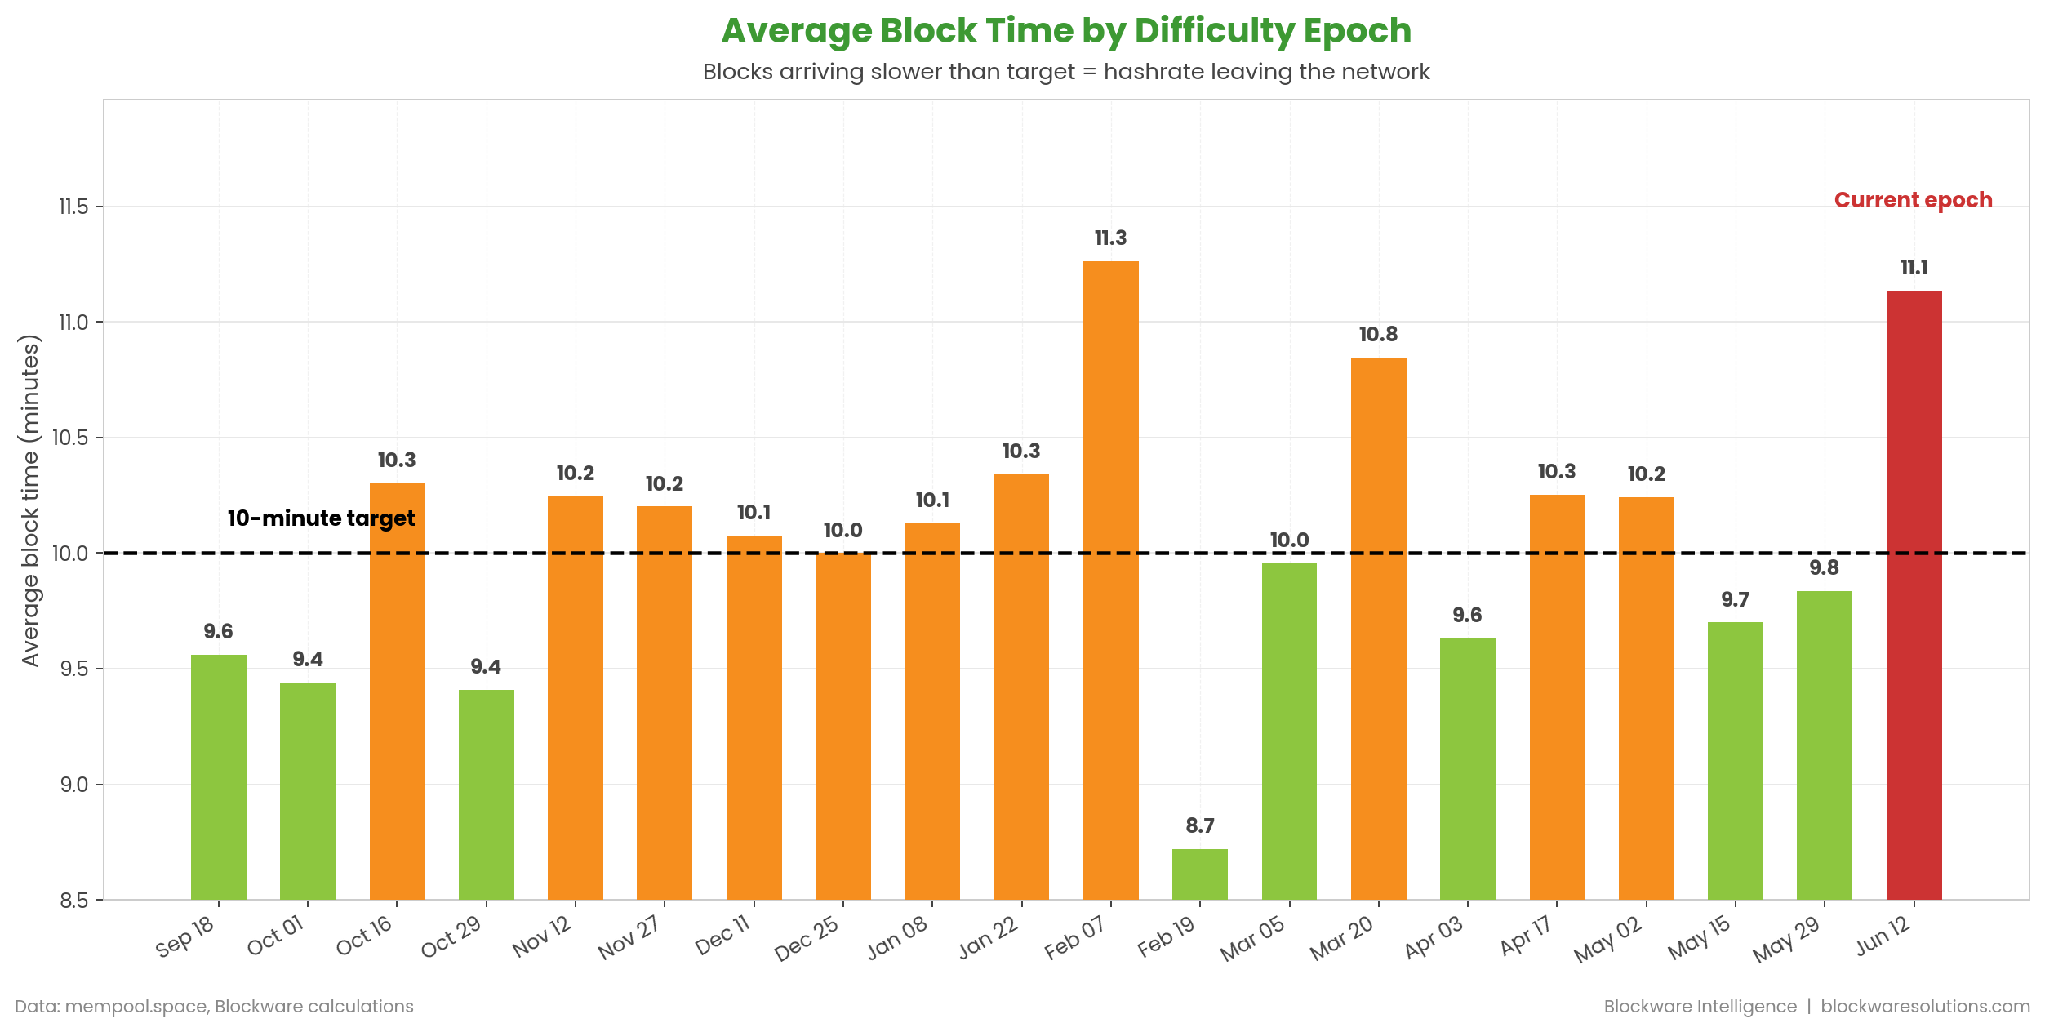
Block times are the receipts. The network targets one block every 10 minutes, and the current epoch is averaging 11.1 minutes per block. Every slow block is direct, verifiable evidence that machines went dark, because fewer machines means fewer lottery tickets per second. You can also see the cycle play out across recent epochs: blocks slowed into the February drop, snapped back to 8.7 minutes once difficulty fell and hashrate plugged back in, and have now slowed again. The protocol is doing what it was designed to do, which is protect the miners who survive.
Difficulty drops are when mining economics reset in favor of the survivors. Machines that are unprofitable for an over-leveraged operator at $0.08/kWh are very profitable at Blockware’s hosting rates, especially with the 100% bonus depreciation tax benefits layered on top. If you want to see exactly what this weekend’s adjustment does to machine-level ROI, sign up for a free consultation with the Blockware team: https://www.blockwaresolutions.com/info/
Macro: The First 4-Handle CPI in Three Years
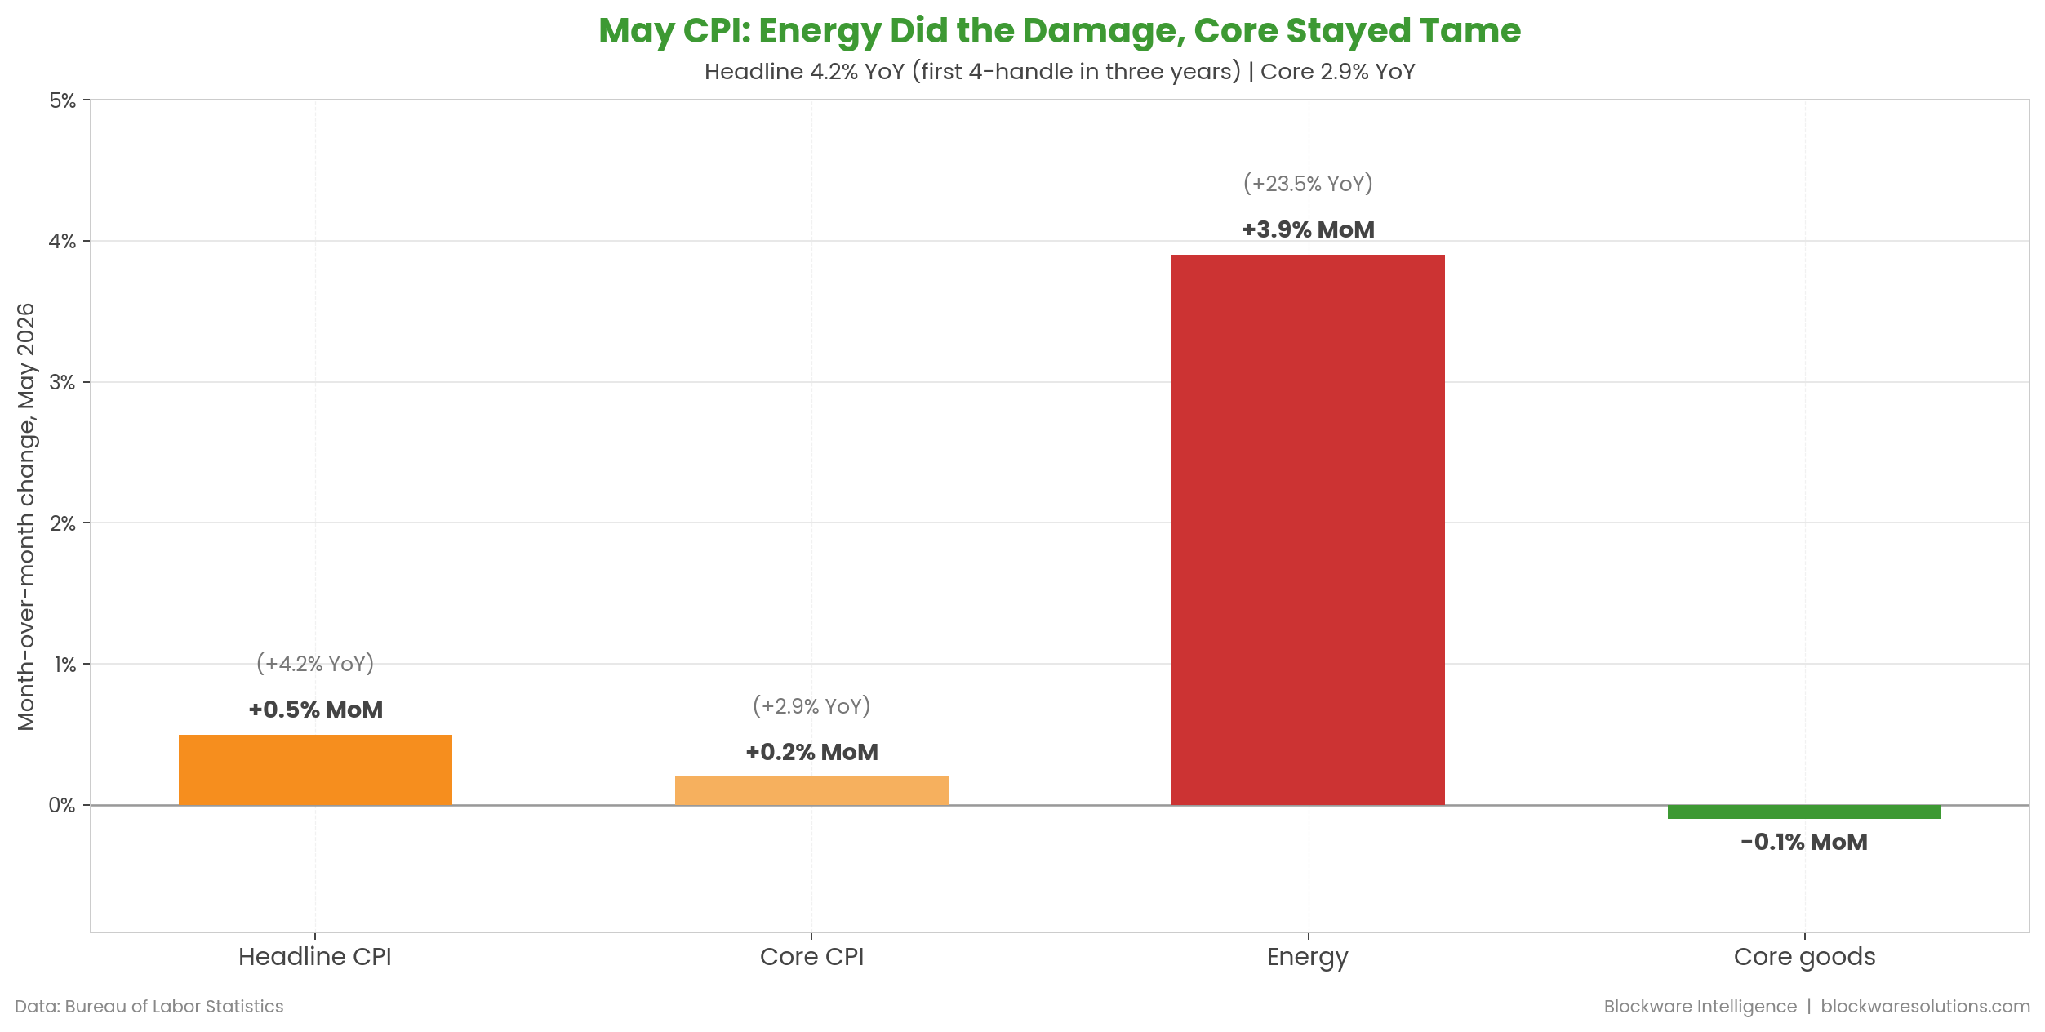
Wednesday’s May CPI print came in at 4.2% year-over-year, the first reading above 4% since 2023, with prices rising 0.5% on the month. Both numbers matched expectations, and the composition matters far more than the headline. Energy jumped 3.9% in a single month and is now up 23.5% over the past year, a direct result of the conflict with Iran and the disruption around the Strait of Hormuz. Core inflation was just 2.9% annually, the monthly core reading of 0.2% actually came in below estimates, and core goods prices fell outright. This is a supply shock from a war, not an overheating economy. If/when the conflict de-escalates, headline CPI likely follows, and dovish policy gets priced in.
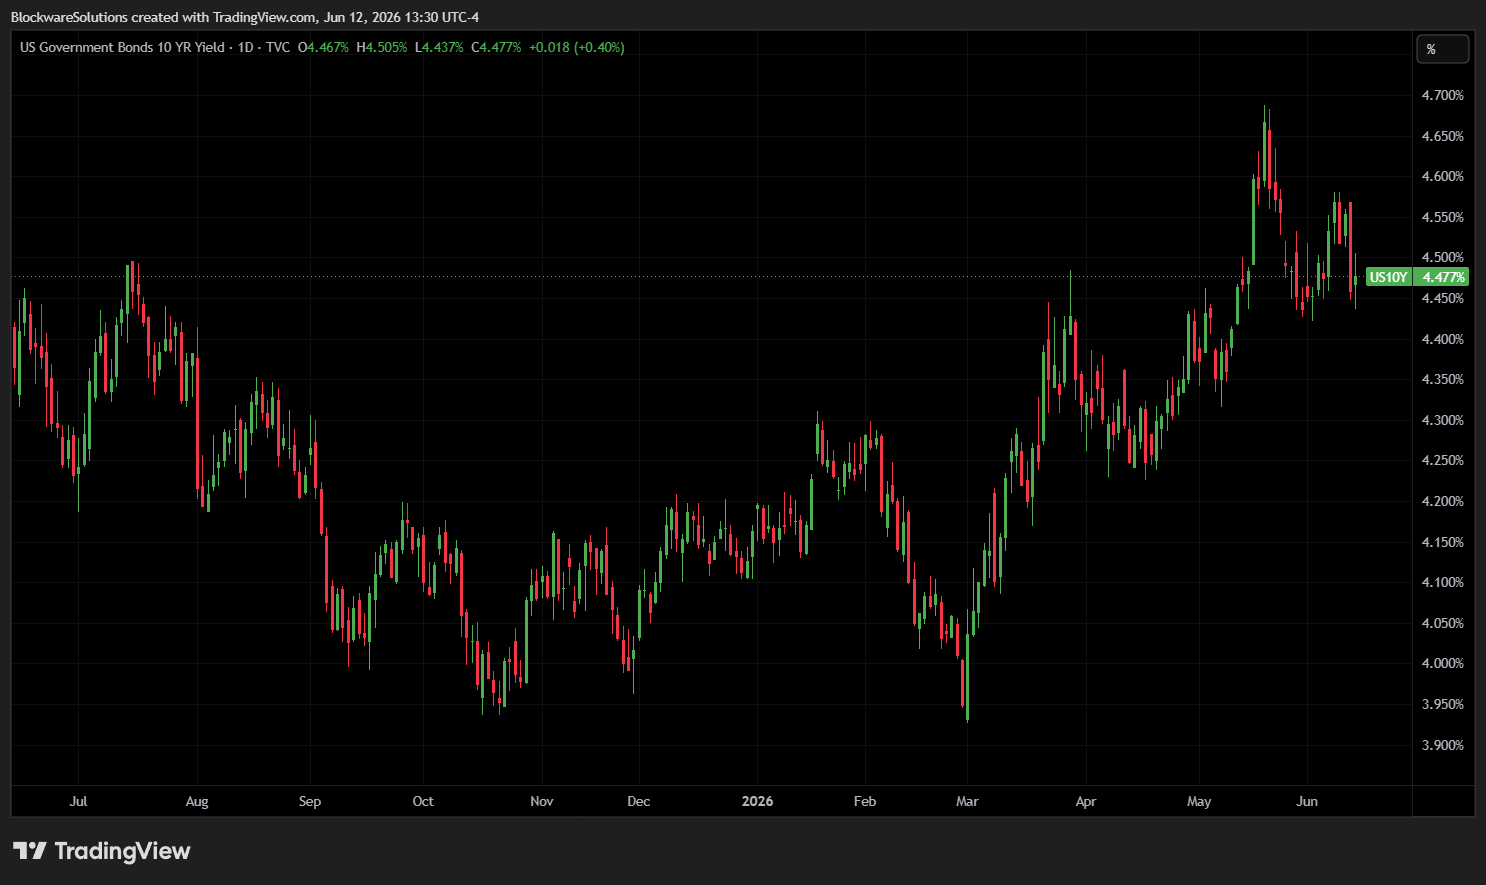
The bond market said the same thing. The 10-year Treasury yield was essentially flat after the print and sits near 4.53%, even though Thursday’s PPI came in at 6.5% year-over-year, the hottest producer inflation since November 2022. Traders have flipped from pricing rate cuts to pricing a hike, with a quarter-point increase fully priced by December, and the Fed is expected to hold at its June 17 meeting. Sit with that combination for a second. Inflation is above 4%, the government is running massive deficits, a war is adding to the bill, and the 2-year Treasury now yields less than the inflation rate. Holders of short-term government debt are losing purchasing power, which is precisely the environment Bitcoin was built for. The long-term fiscal math has not changed: at some point the interest expense forces the Fed to step in, and that resolution favors hard assets.
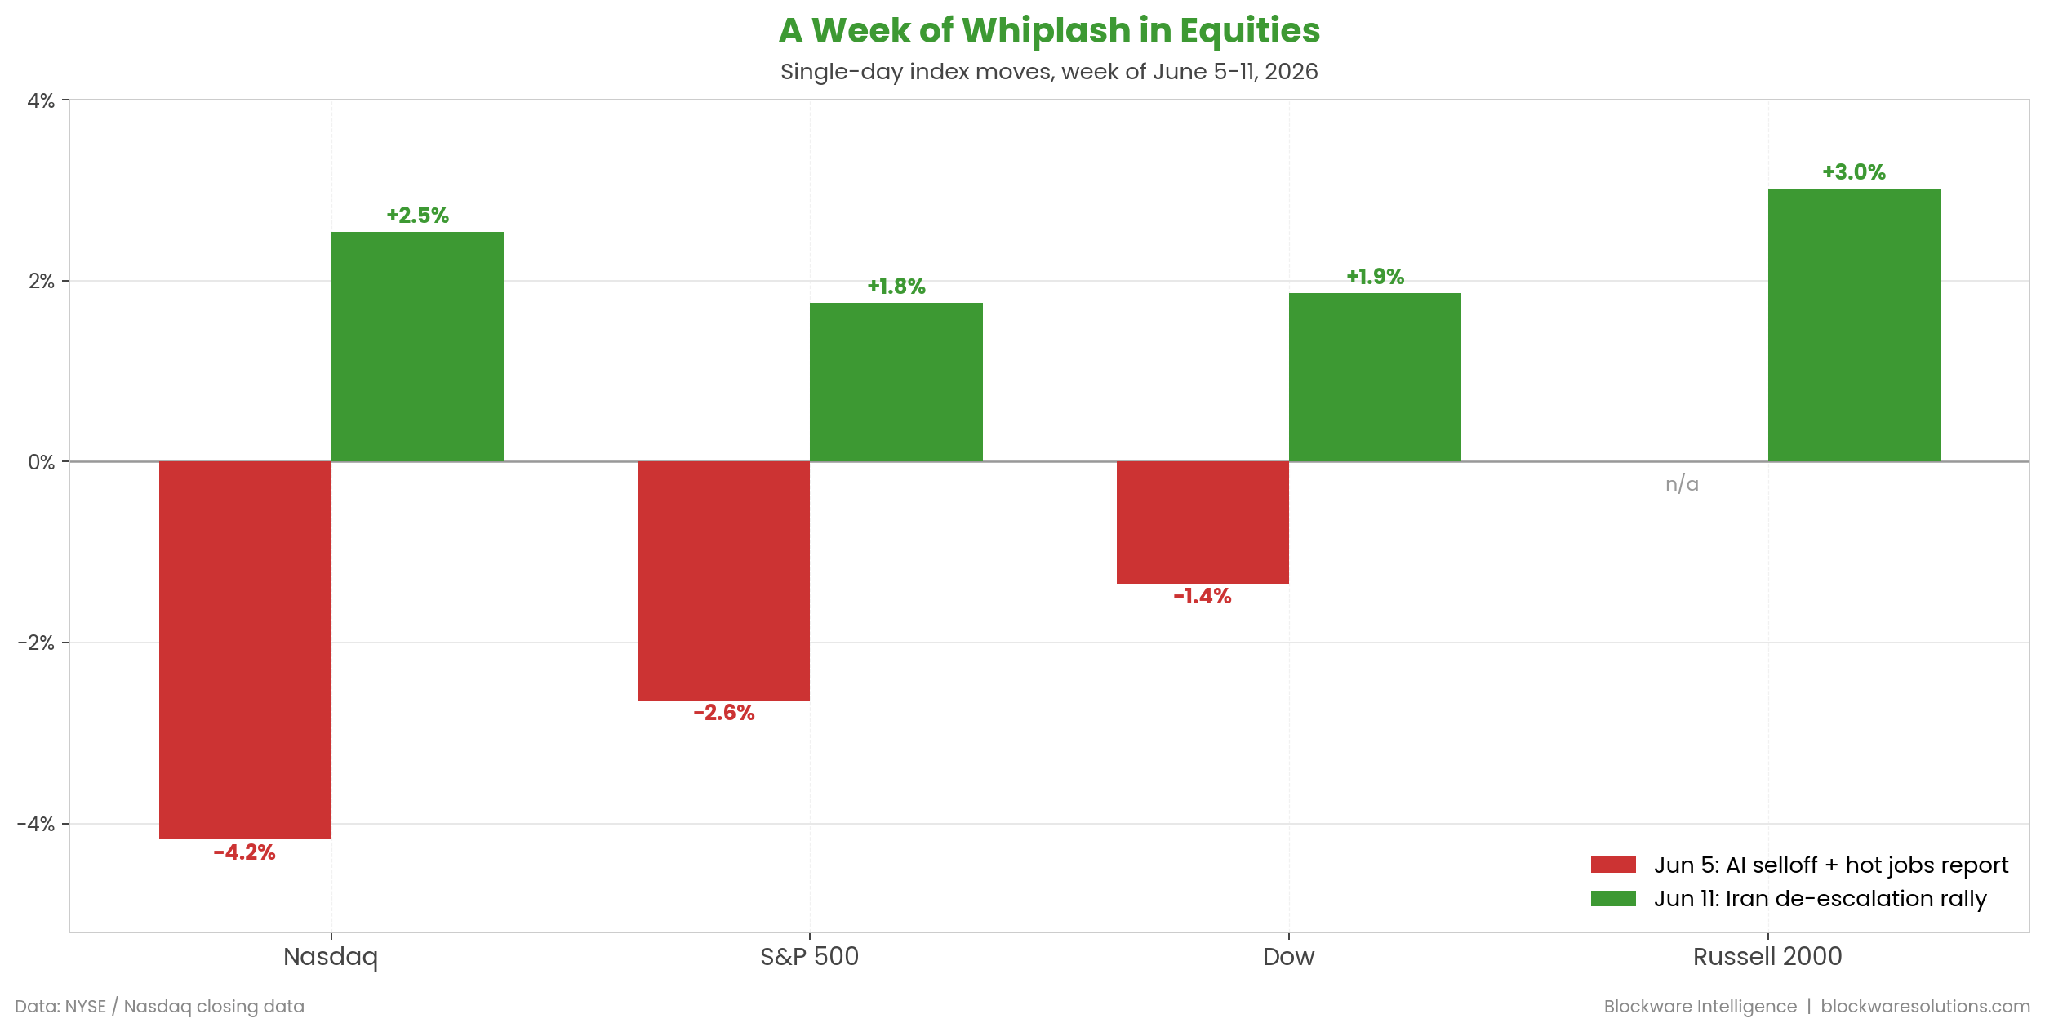
Equities packed a full cycle into seven trading days. The S&P 500 closed above 7,600 for the first time on June 2, then the Nasdaq dropped 4.18% on June 5, its worst day since April 2025, as a crowded chip trade unwound on Broadcom’s AI outlook and a much hotter-than-expected jobs report (172,000 jobs versus 80,000 expected) spiked yields. Iran escalation knocked the Dow down 900 points on June 10. Then everything reversed on June 11, with the Nasdaq up 2.5% and the Russell 2000 up 3%, as the US and Iran signaled a deal was close. Reports now suggest an agreement could be signed as soon as Sunday, including reopening the Strait of Hormuz within 30 days, and oil has already pulled back to around $84.
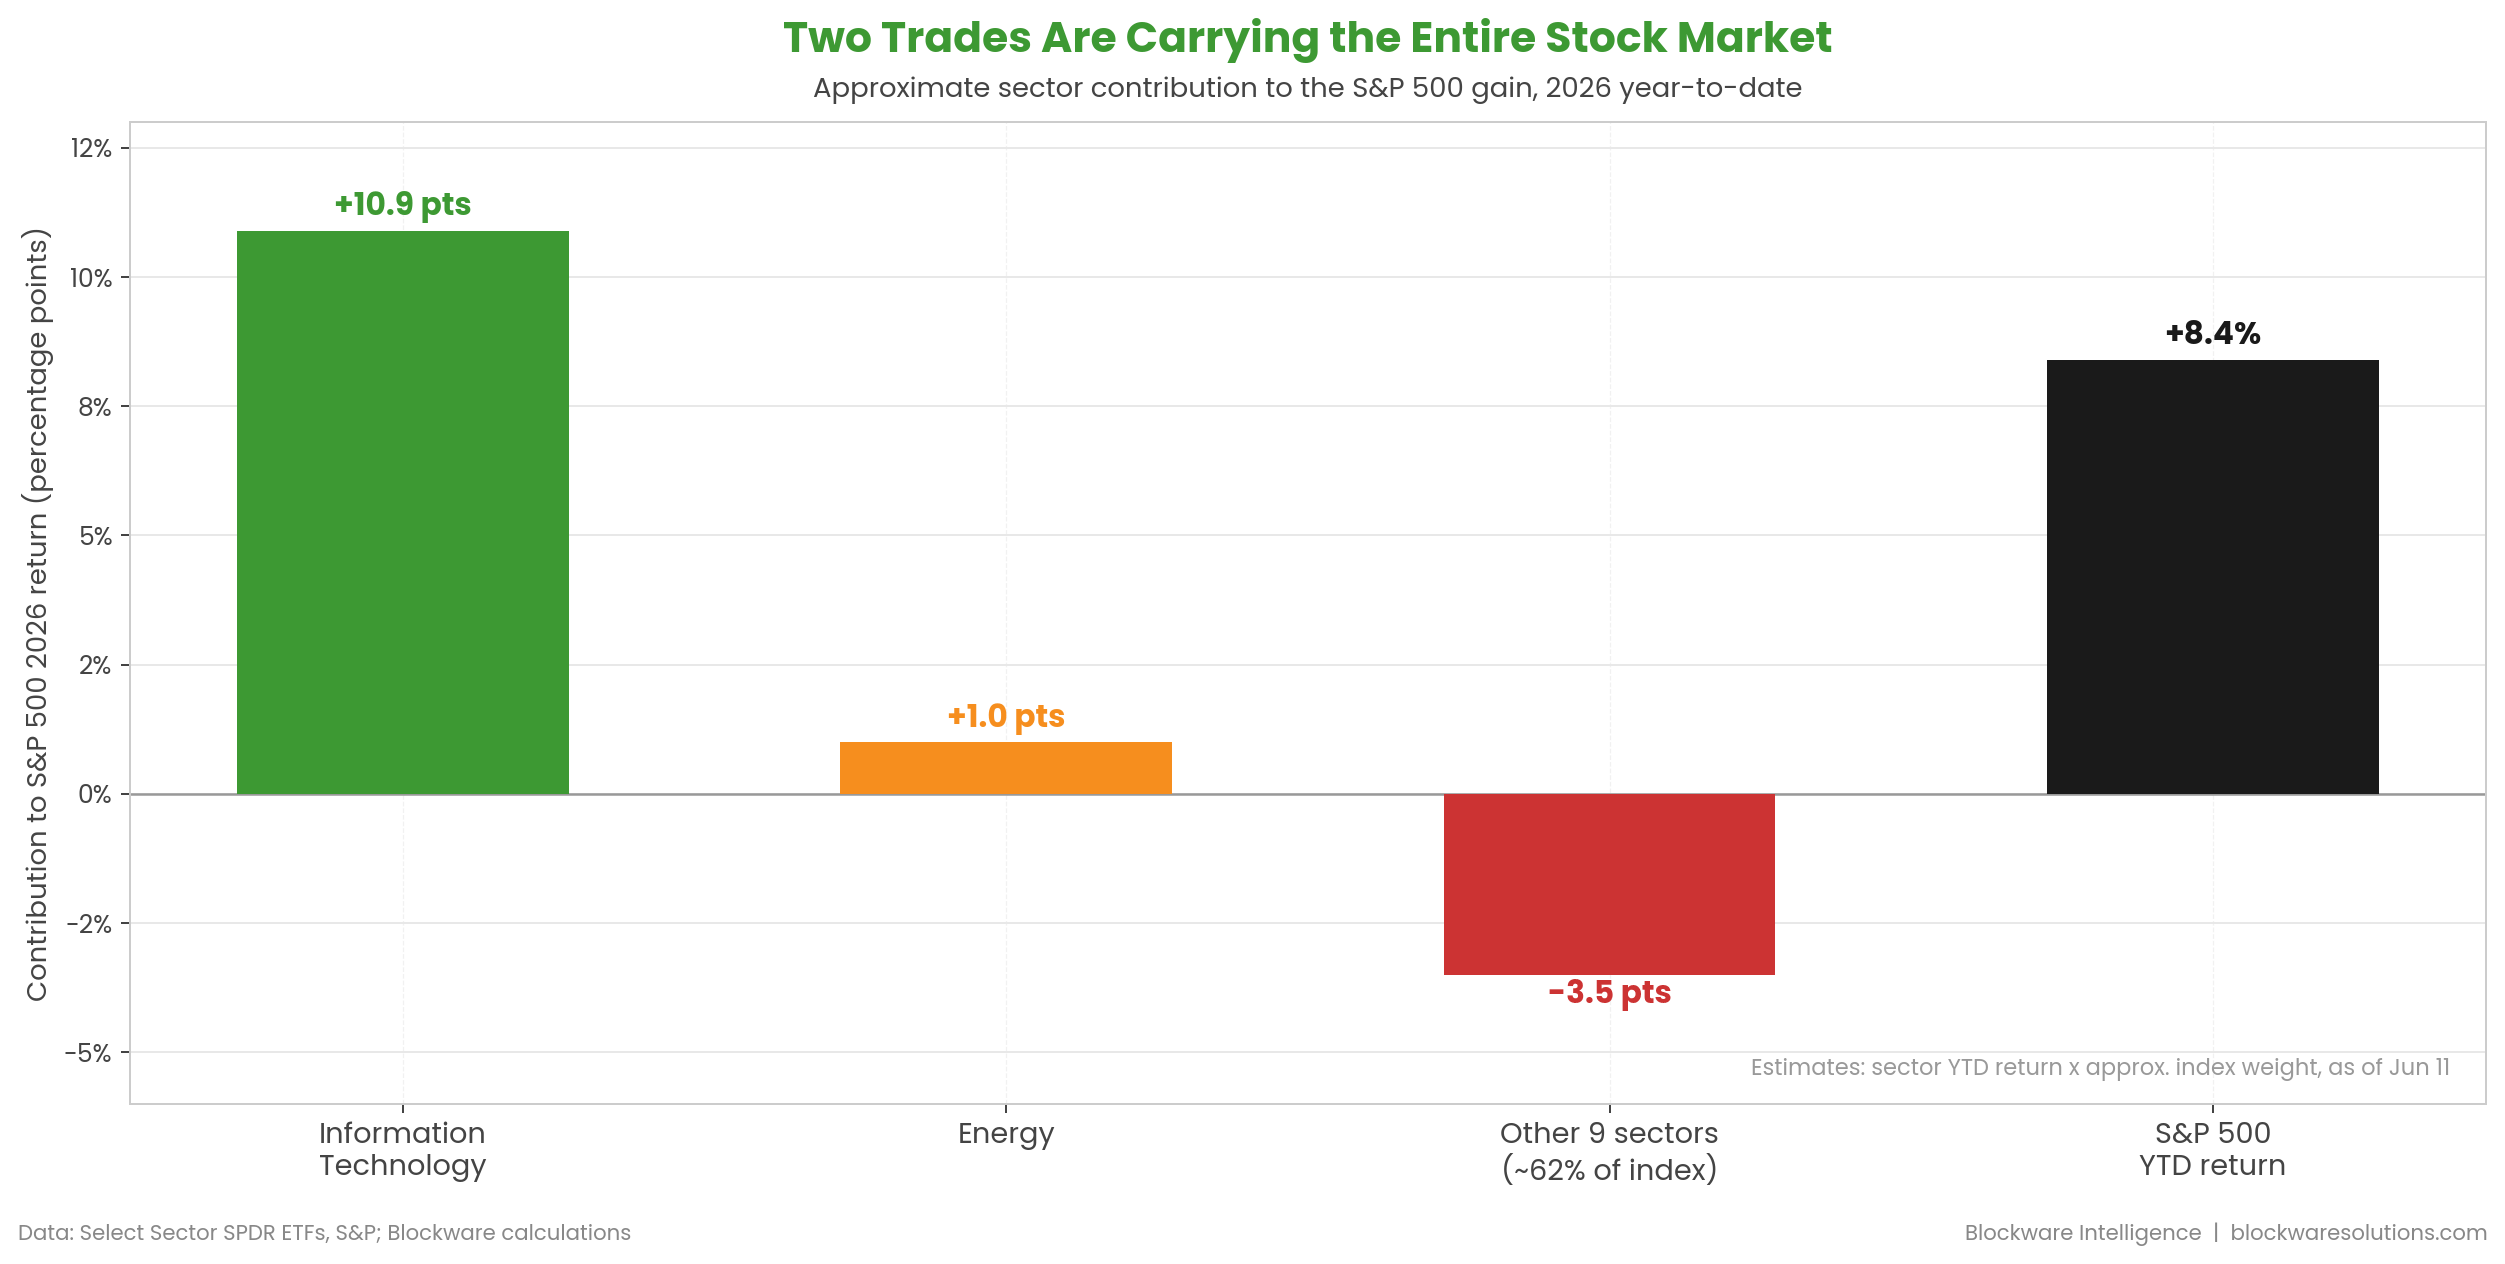
Underneath the index level, the gains are remarkably narrow. Technology is up roughly 32% in 2026, and at about a third of the index weight it has contributed nearly 11 percentage points to the S&P 500’s return, while energy added another point on war-driven oil prices. The index itself is up only 8.4% on the year, which means the other nine sectors, roughly 62% of the market, have been a net drag. Financials and consumer staples are the two worst-performing sectors of 2026. Strip out the AI trade and the war trade, and the average stock is down this year.
That concentration tells you what this market actually is: a bet on the AI capital expenditure cycle. It also explains the fragility on June 5, when one soft outlook from Broadcom dragged the entire index down 2.6%, because there is little else holding it up. For now the cycle keeps delivering. Adobe posted record revenue of $6.62 billion this week on AI-driven demand, Citi laid out a case for AMD becoming Meta’s second GPU source with a $575 price target, and Marvell surged 25% after Jensen Huang called it the next trillion-dollar company. This is the same buildout we have covered from the mining side, where power is the binding constraint and Bitcoin miners hold some of the most valuable energized capacity in the country.
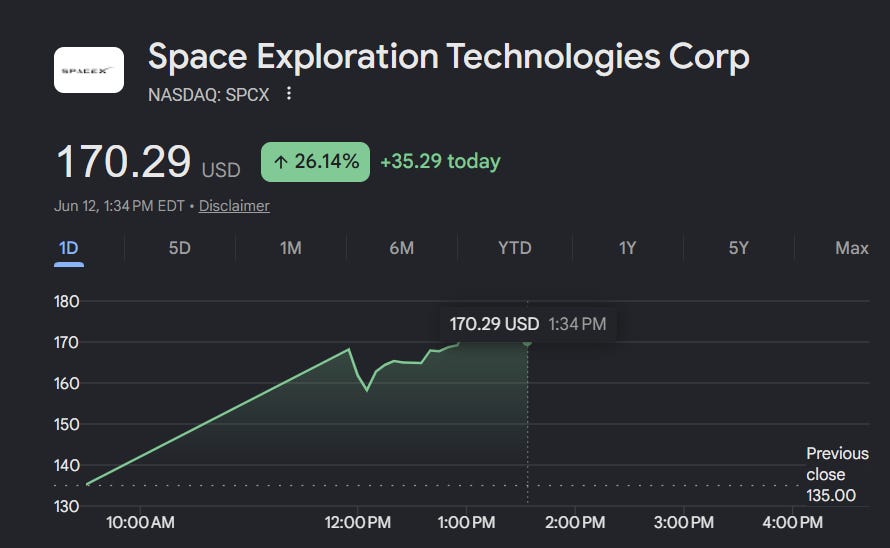
The week’s exclamation point is SpaceX, which began trading on the Nasdaq today under the ticker SPCX after the largest IPO in financial history. The company priced 555.6 million shares at $135 each, raising $75 billion at a valuation just under $1.8 trillion, which puts it among the ten largest companies in the world on day one and makes the deal nearly three times the size of Saudi Aramco’s 2019 record. Roughly 30% of the offering was allocated to retail investors, about triple the industry norm, and Musk retains over 82% voting control. Fifteen days after listing, SpaceX enters the Nasdaq-100, expected to trigger an estimated $22 to $27 billion of mechanical index buying in early July. A $75 billion raise getting absorbed in a single week tells you liquidity in this system is abundant. The bid is simply concentrated in AI, space, and hard assets.
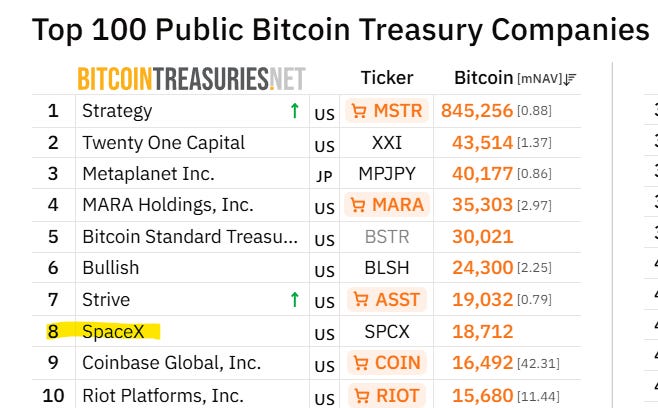
The more interesting story around SpaceX is that they immediately jumped to the number 8 spot in public Bitcoin treasuries; with more than 18,700 BTC on their balance sheet. However, in terms of Market Capitalization, Space X is the largest publicly traded holder of Bitcoin, surpassing Musk’s other company, Tesla.