Blockware Intelligence Newsletter: Week 40
Bitcoin market overview of 5/27/22-6/3/22
Blockware Intelligence Sponsors
If you are interested in sponsoring Blockware Intelligence email: sponsor@blockwaresolutions.com.
FTX US - Buy Bitcoin, crypto, and now US stocks with lower fees on FTX. Use our referral code (Blockware1) and get 5% off trading fees.
Blockware Solutions (Mining) - Buy and host Bitcoin mining rigs to passively earn BTC by securing the network. Your mining rigs, your keys, your Bitcoin.
Blockware Solutions (Staking) - Ethereum 2.0 is almost here, now is the time to stake your ETH with Blockware Solutions Staking as a Service to take advantage of 10-15% APR when the Ethereum network switches over to Proof of Stake.
Summary
The Fed began quantitative tightening this week for the first time since the nearly disastrous QT period of 2018-19.
We examine the relationship between the expected Fed Funds Rate by year-end and the issues this could create in a modern monetary system that is historically over-leveraged on credit.
The equity market is behaving as though QT and rising interest rates have been priced in, but only time will tell if the true bottom is in.
The White House is looking to address Bitcoin Mining energy usage and New York is pushing forward a Bitcoin Mining ban. However, bitcoin ASICs emit 0 greenhouse gases. Miners are electric accountants (moving money) just like Tesla's are electric vehicles (moving people).
Hash Ribbon metric is close to crossing. It would signal the initial phase of a miner capitulation if it does.
Some miners (RIOT and CBTTF) are selling Bitcoin revealing miners are on the verge of capitulation.
General Market Update
What a wild week it’s been, even if it is only a short one.
The biggest news of the week was that Wednesday was officially the first day of the Federal Reserve beginning quantitative tightening (QT). The final quantitative easing (QE) purchase came in early March, and this week we saw the first balance sheet runoff.
For those who aren’t aware, QE and QT are two of the methods used by the Fed to either add liquidity into the markets, or remove it, thus helping to speed up or slow down the economy.
Quantitative easing involves the Fed expanding their balance sheet, and the nation’s money supply, by purchasing Treasury bonds and other types of securities on the open market using newly “printed” currency. This can help stimulate the economy.
QT is the opposite, where the Fed either allows these securities to mature and doesn’t reinvest the principal, or just sells the securities outright. This shrinks the amount of bonds the Fed holds (the size of their balance sheet) and removes debt from the system, thus lowering the money supply and slowing the economy.
The last time the Fed underwent QT was for a period from 2018-2019. The result was that the Fed overshot their tightening goal, which spiked yields and nearly caused a bear market and recession. As you can see above, CPI rose during a period that was supposed to compress the monetary base and be disinflationary.
Today, the Fed has discussed an even more aggressive QT period than before, likely meaning we will see open market selling of their securities and not just runoff. This doesn’t necessarily mean we’ll see yield spikes and stocks plummeting further, but it will depend on the liquidity of the bond market and the speed at which the Fed tightens.
Quantitative tightening comes alongside rising interest rates which work together to try to lower prices.
It’s important to remember that our monetary and economic system has been built by credit creation ever since Nixon severed USD claims on physical gold in 1971. This ended the era of the gold standard and ushered in the current fiat standard.
Today, most American’s wealth isn’t in the form of physical currency, real estate, gold, stocks or Bitcoin, it’s in credit. We live in a fiat system that rewards taking on debt and turning it into hard assets.
Think about it, most people’s ideal life goes something like this: you take out a loan to go to college, then use that degree to get a job so that you can earn money to then take out loans to buy a car and a house. If you can increase your productivity over time you can get a raise, this allows you to take out bigger loans for an even bigger house and an even nicer car. This process repeats over and over, as we exchange credit for assets throughout our lives.
The richest companies and humans in the world are able to grow so large by building up huge amounts of debt and over time, receiving access to more attractive interest rates.
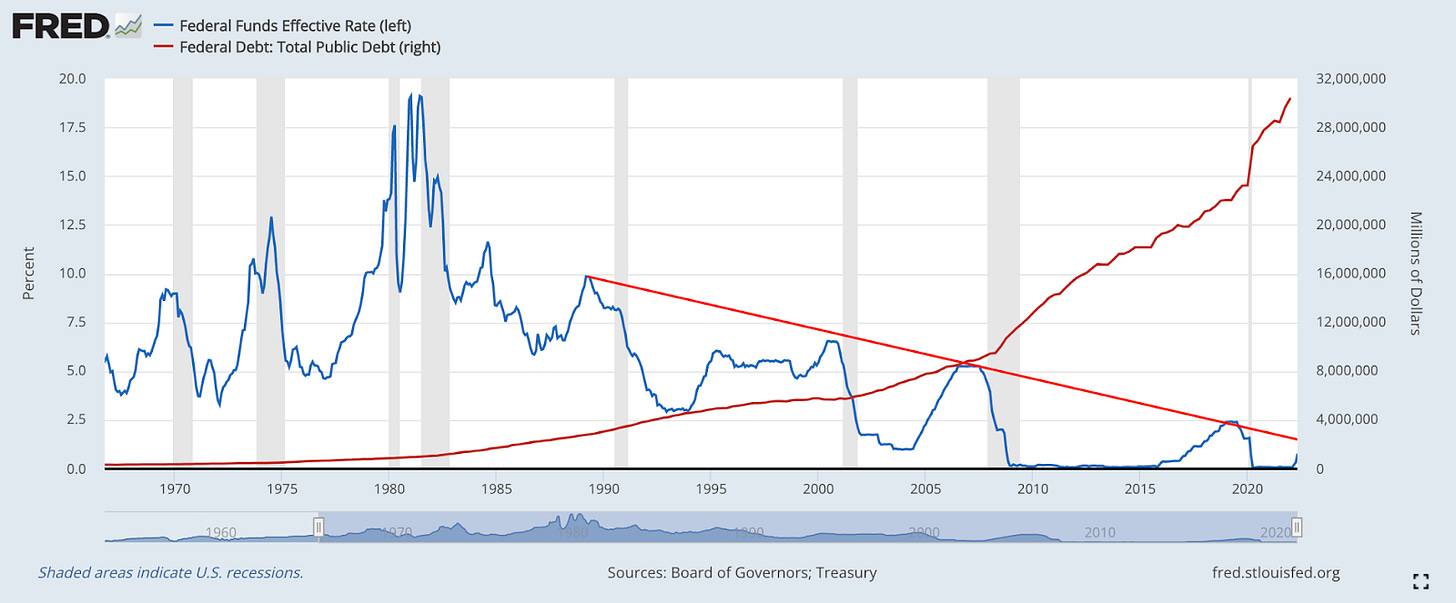
Since the 1970’s, the trend of total outstanding public debt has been in one direction, up and to the right.
This expanding public debt burden has been fostered by interest rates that have been moving towards 0 since the 1980’s. With lower and lower financing costs, alongside the supply of US dollars expanding and thus, purchasing power declining, the benefits of saving for the future are diminished.
Because the expectation is always that dollars in the future will buy less than dollars today, many people elect not to hold their wealth by saving in USD. Instead, we see people taking on debt to buy cash-flow generating assets.
With the effects of monetary base expansion and falling purchasing power now catching up with us, the current plan for the Fed is to continue to hike interest rates at 50bps for the 5 remaining FOMC meetings of 2022. This would bring the Fed Funds Rate to 3-3.5% by the end of the year.
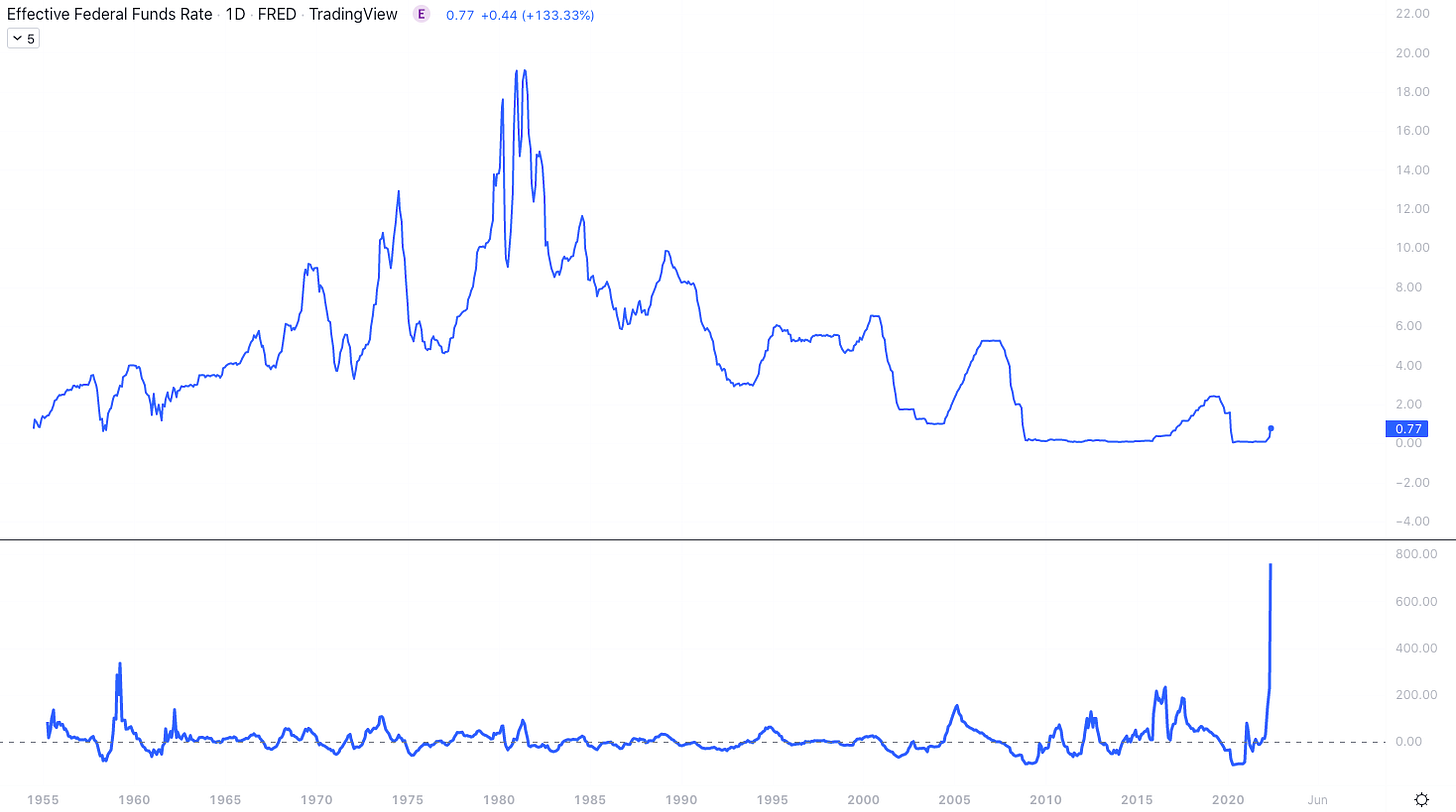
FFR w/ Rate of Change (Tradingview)
Taking rates from 0 to 0.75 (lower bound target rate) in only two meetings is quite aggressive, and the chart above shows that. The bottom pane is the rate of change for the Effective Federal Funds Rate which is currently showing us just how rapidly the FFR is increasing.
Furthermore, the FFR hasn’t seen a 50bps rate hike since 2000.
As previously mentioned, interest rates have been in a downward trajectory for over 40 years. But by following this plan to 3-3.5% FFR by year-end, it would put rates well above the bright red decreasing trendline you can see above.
The shaded vertical sections above signal recessions. As you can see, every time the FFR has come close to this line, we have seen a recession. The Fed was then forced to reverse course by dropping rates in order to save the economy, this encourages even more credit creation.
This just pushed the economic issues aside to be dealt with in the future, known as “kicking the can”. Eventually we would reach a point where there would be a recession but the FFR was already at 0 and unable to be dropped further.
There is an extremely strong argument to be made that this is where we are today.
The amount of public debt in proportion to our nation’s economic output is at an all-time high. Increasing interest rates to 15 year highs for a populous that is highly insolvent could have severely negative implications.
This leads many to believe that the Fed will not actually end up hiking rates to 3.5% and that instead, they are just saying this to get investors to price in higher rates so they don’t actually have to raise them (known as “jawboning”).
Only time will tell how this will play out.
In the stock market, we’re seeing a counter-trend rally underway. We can chalk some of this move up to shorts covering their positions, and traders looking to squeeze out some P&L, but there is an argument to be made that this is the “Sell the rumor, buy the news” rally we discussed last week.
It has been no secret that the Fed would begin tightening their balance sheet, and now that the market has had months to price this in, we could be rallying on the news that it has officially begun.
But for investors, the reasons why prices are moving higher does not matter as much as the fact that prices are moving higher. Price pays, news stories do not.
If you are a growth or tech investor you may want to keep an eye on the Russell 2000 index to track the performance of small-cap equities. Currently this index is at a key level in its attempt to break higher.
IWM 1D (Tradingview)
This support, now turned resistance, at around $188 for the Russell ETF IWM is an important spot to monitor. As of Thursday’s close, IWM managed to close above this level, signaling a fairly strong rally underway, but do note the light volume on Thursday.
This looks like an inverse head-and-shoulders pattern to me, but whether this is the true bottom in this corrective period is anyone’s guess. IWM also needs to at least retake its 50-day SMA (red) before we are too confident, likely something we’ll see it attempt today.
S&P 500 Index 1D (Tradingview)
The S&P also managed to close above resistance, albeit also on light volume. Once again, the declining 50-day SMA would be a logical place to see prices reverse so keep an eye on it if that test comes.
The Nasdaq is also nearing a test of resistance around $12,600.
US 10Y Yield 1D (Tradingview)
The bond market has continued its sell-off this week, despite rallying for the last 3 weeks.
The 10-year’s yields are up nearly 0.2% on the week. 3M yields are up 0.06%, 2Y yields are up 0.15% and 30Y yields are up 0.11%.
Rising yields does tend to put selling pressure on equities but so far, the indexes appear to be ignoring this news.
Crypto-Exposed Equities
Crypto-equities have seen some funky price action alongside Bitcoin this week.
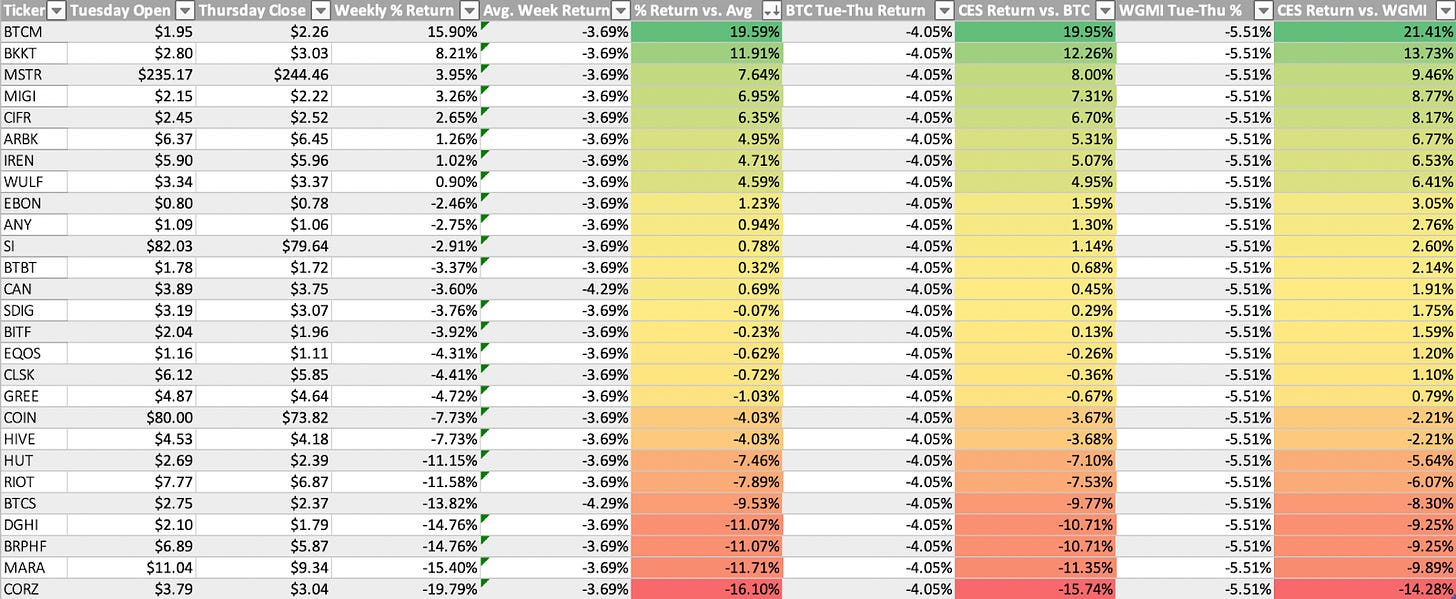
Standouts from a price structure standpoint to me are: CIFR, BTCM, BKKT, MOGO, CAN, SDIG and MSTR.
Several of these names are showing signs of accumulation greater than BTC itself. As of recently, we’ve seen what I believe to be institutional front-running. For example, MSTR flashed strong signs of institutional accumulation on 5/26 (discussed here last week), and then 4 days later BTC did the same thing.
To me this looks like funds building equity positions before they make their Bitcoin purchases in order to double-profit. This makes monitoring the prices of crypto-equities even more important as it can potentially provide insights into institutional BTC buying behavior.
Above, as always, is the excel sheet comparing the weekly performance of several crypto-exposed equities in comparison to their average, Bitcoin and the mining ETF WGMI.
Bitcoin Price Action, On-Chain Analysis, Derivatives
BTC attempting a 10th red weekly candle, which would continue its record downstreak.
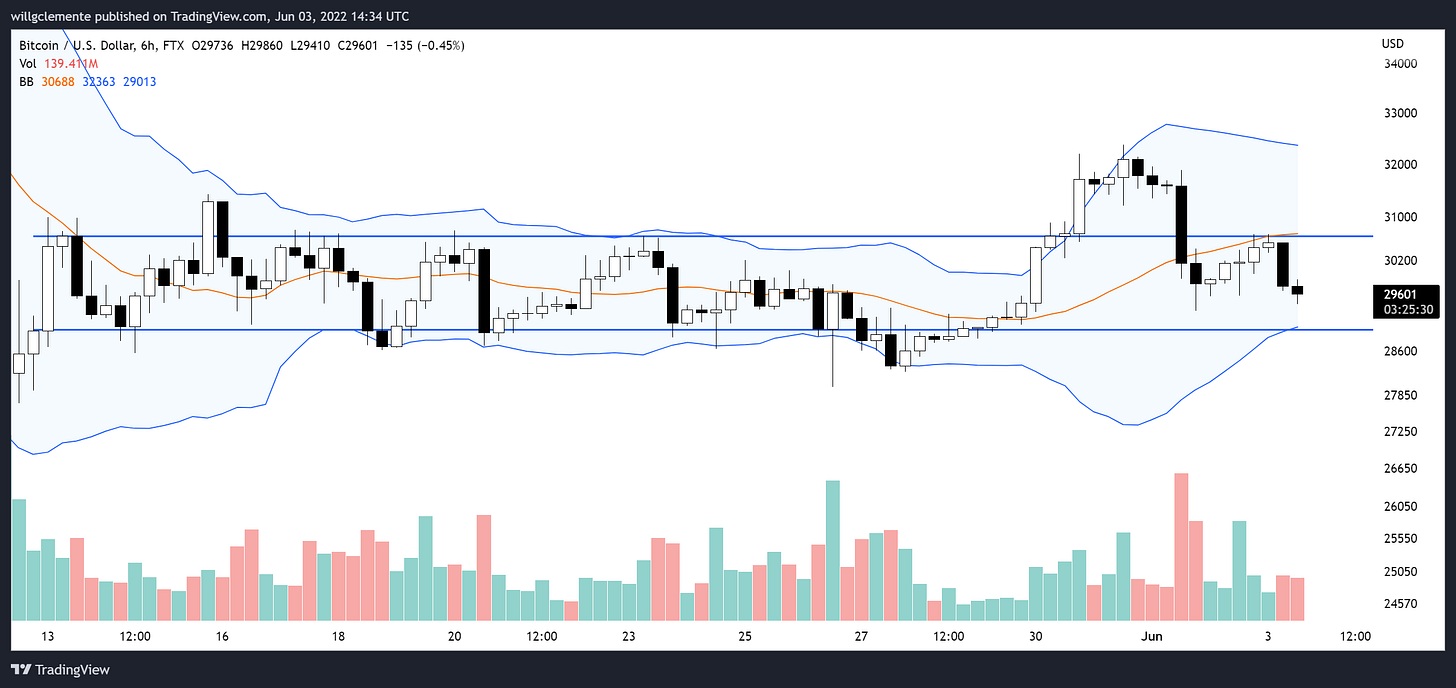
On the lower time frames Bitcoin continues to be rangebound, taking liquidity from breakout traders on both sides. Pretty horrendous choppy price action.
This week we did see a brief “decoupling” from the Nasdaq on the 1D timeframe, although in the opposite direction of what many BTC advocates would have liked to have seen. This comes after reaching historical prolonged levels of correlation between the two asset classes.
Bitcoin dominance has continued its rise, now up 19% off its lows. This means Bitcoin is now taking up 47% of the overall crypto market cap share. This indicates a liquidity flow back to BTC from alts after aggressive dispersion throughout 2021. This is a healthy dynamic that also took place towards the latter half of the 2018 bear market. Liquidity flowing into majors allows for a solid foundation for the next bull run until liquidity disperses again, the market dilutes as the number of new products outpaces the amount of capital inflows able to support all of the dispersion, and the cycle starts all over again.
Despite the uncertainty, the Canadian Purpose Bitcoin spot ETF has seen sustained inflows over the last month, adding 11,349 BTC to its fund in the last 30 days. This is the most aggressive 30-day increase in its existence.
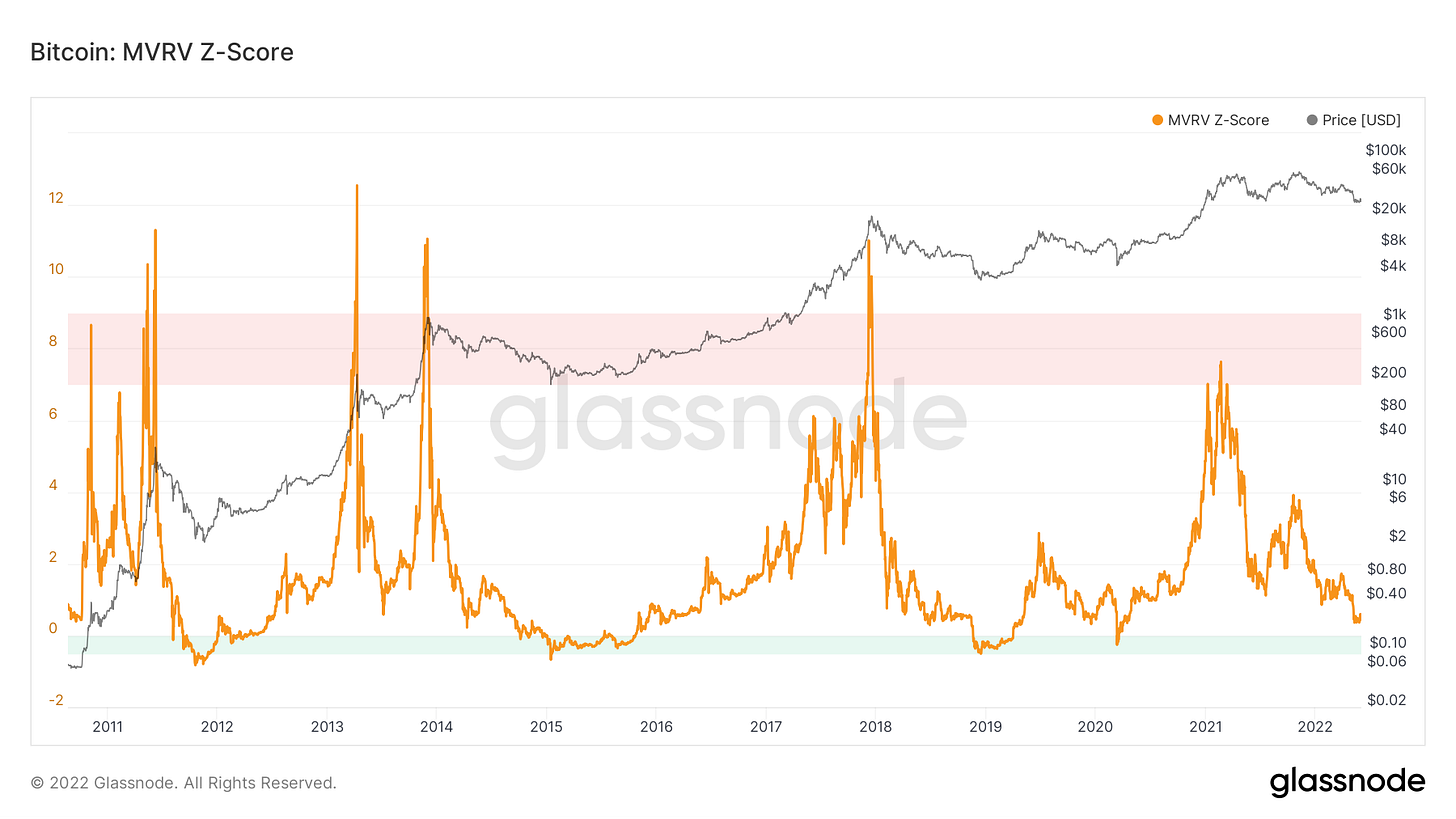
Last week we looked at a lot of the metrics and indicators from both a technical and on-chain standpoint to gauge where a potential cyclical bottom may be. Think it should be stated that for long-term oriented market participants, DCAing is a great strategy with all of those metrics near full reset and in the lower 10th percentile of historical values. If you’re not greedy like me, you don’t need to try to time the bottom. With that in mind, here are the two I think it really boils down to for me:
Firstly the on-chain cost basis ratio. This compares the short term and long term holder cost basis’ (shown below). The ratio of the two is the dark blue line. Whenever long-term holders’ cost basis crosses above short-term holders’, Bitcoin has reached an area of generational buying opportunity. We are getting close, but not quite there yet. STH cost basis is currently at 36,600 and LTH cost basis at 22,300.
Next up we have the volatility-adjusted version of the market value to realized value ratio. Watching for that green zone below.
Aside from price-oriented metrics, here we look at active addresses as a proxy for base chain network activity. This has continued its decline since November of last year and has failed to come close to its highs in May of last year. Typical bear market cool down behavior.
However, when we look at the lightning network, capacity continues to grow. Although the lightning network is still small and in its infancy, the rate of change especially in the context of market conditions has been inspiring. The growth of Bitcoin’s L2 represents its growing use case as a medium of exchange in addition to being the best store of value across space and time.
Lastly, wanted to end by looking at the Asian trading hour premium we’ve been tracking for the last few weeks. This is interesting to me because based on this chart it appears that Asia-based market participants have dominated the Bitcoin market for the last 2 years. In particular, looking at orderbooks myself and other traders I speak with have noted a large Bitcoin bidder in Binance’s orderbook.
Bitcoin Mining
New York Bitcoin Mining Crack Down
Early Friday morning, New York lawmakers passed a bill that would ban any future Bitcoin mining operations not using 100% renewable energy. As of now, the bill is moving to the desk of the governor who can sign it or veto it.
In hindsight, it won’t matter if the bill gets vetoed. Nobody is going to set up a facility there after legislation like this almost gets passed.
This now places New York and China in the same tyrannical jurisdiction bucket. Embarrassing.
White House Drafting Bitcoin Mining Policy to Address Energy Consumption and Emissions
As reported by Bloomberg Law, The White House is “teeing up policy recommendations to lower cryptocurrency mining’s energy consumption and emissions footprint, marking its first major foray into a poorly understood industry that critics say threatens U.S. climate goals and strains the power grid.”
While there isn’t much direction on whether the legislation is going to involve the “carrot or stick”, it is disappointing to see regulations potentially looking to limit energy use. Bitcoin ASICs themselves emit zero greenhouse gases. Miners are the electric accountants of Bitcoin. They use proof of work to order transactions and bootstrap the world’s first trustless scarce accounting ledger. In comparison, Tesla’s are electric vehicles using the same form of energy not to bootstrap a trustless monetary ledger, but to transport humans. Is there regulation limiting how often you can charge your Tesla? Is there legislation being drafted to limit the number of sales Tesla is allowed to make?
Let’s not treat trustless electric money differently than electric vehicles.
It’s not as if Bitcoin miners don’t provide a valuable service, just like electric vehicles do. Miners are collecting and bootstrapping the world’s first trustless immutable perfectly scarce monetary good (worth nearly $600,000,000,000), balancing and increasing the resiliency of energy grids as demonstrated last month in Texas, incentivizing the build-out of more renewable energy, and capturing energy that would otherwise be wasted. Trying to restrict Bitcoin miners will only incentivize them to build operations elsewhere. It is vital that the US drafts regulation that incentivizes the build-out of more mines and in turn results in more energy for all of humanity.
Hash Ribbons
Above you can see we have had four miner capitulations since the beginning of 2020. Hash Ribbons compare the 30-day and 60-day hash rate moving averages. When the 30-day moving average drops below the 60-day, that indicates that miners are turning rigs off. This can occur due to halvings when the block subsidy gets cut in half, significant price declines making mining unprofitable for old gen rigs, natural weather events like the rainy season in China, and geopolitical events like the China mining ban.
The last miner capitulation was the China mining ban, but the recent downward difficulty adjustment and falling hash rate appear to be weighing on the hash ribbon metric. The moving averages haven’t crossed yet, but another sharp price decline would potentially force a significant number of old generation ASICs off the network.
Miners Selling BTC?
Even if public miners are still planning on significantly growing their hash rate, it hasn’t stopped a few of them from selling BTC. Riot has sold 450 BTC in both March and May (CoinDesk), and Cathedra Bitcoin sold 235 BTC as part of their balance sheet restructuring (Yahoo Finance). While public miners have to be clear about their financials, it shouldn’t be too surprising to think that private miners are also selling some BTC.
Glassnode data supports this thesis as Miner Net Position Change started showing outflows at the end of April.
While we haven’t had any severe form of miner capitulation yet, it’s something to keep an eye out for as that has historically marked clear Bitcoin price bottoms.
All content is for informational purposes only. This Blockware Intelligence Newsletter is of a general nature and does consider or address any individual circumstances and is not investment advice, nor should it be construed in any way as tax, accounting, legal, business, financial or regulatory advice. You should seek independent legal and financial advice, including advice as to tax consequences, before making any investment decision.









Very good analysis! Thank you for explaining everything! Keep up Will!
Hi Blockware, possible to share the crypto exposed equities excel file pls