Blockware Intelligence Newsletter: Week 26
Bitcoin on-chain analysis, mining analysis, equity-analysis; overview of 2/11/22-2/18/22
Summary:
The general market is, for the most part, in a dangerous, trendless chop.
Gold appears to be trying to breakout from an 11 year base.
Select crypto-equities are standing out from the crowd, as seen in the included spreadsheet.
Bitcoin 1D correlation to Nasdaq has flipped negative
Currently sitting at a crucial pivot point from price structure standpoint
Spot premium over perps continues
ConocoPhillips ($COP) is dipping its toe into Bitcoin mining.
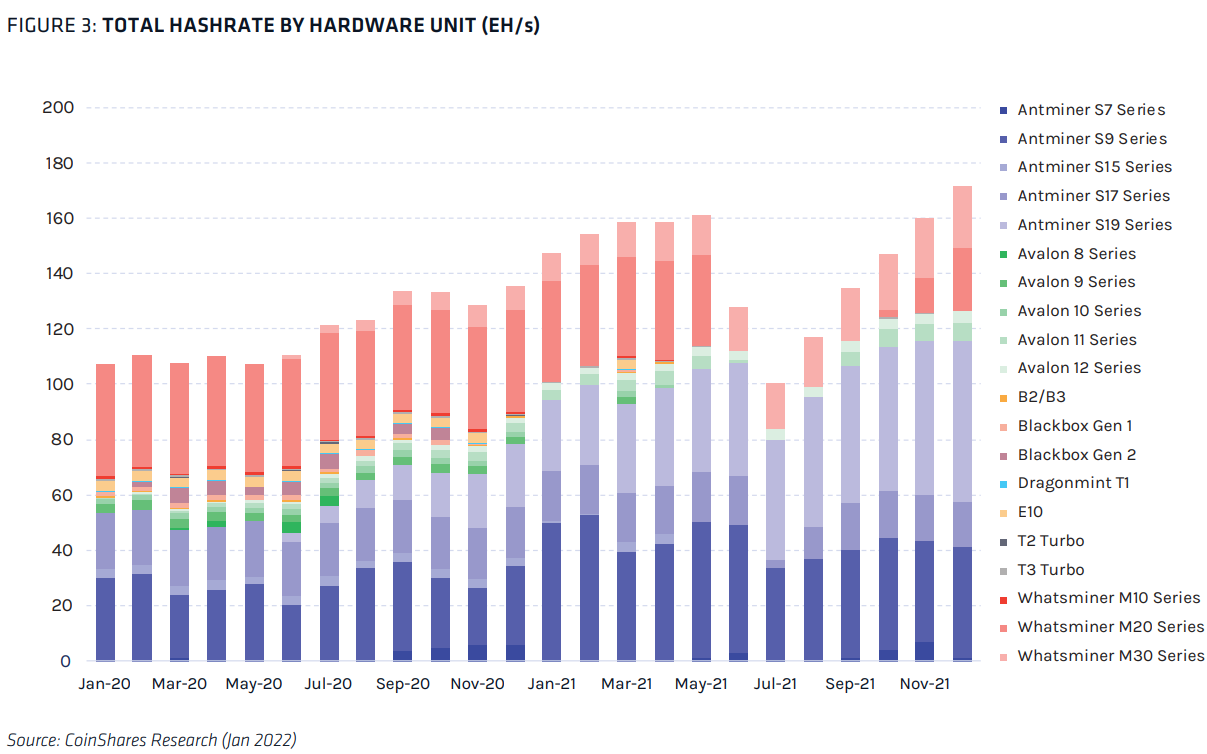
Visualization of total network hash rate by hardware unit.
Hash rate is moving higher (200 EH/s), roughly in line with our projection at the beginning of 2022.
General Market Update
It has been another interesting week of price action. For the most part, I would characterize this environment as a trendless chop. It appears that investors don’t know if they are willing to buy here with all the macroeconomic uncertainty.
This market has generally been a choppy mess, with very few real setups. This is an environment for seasoned traders and will chop you to pieces if you let it.
The majority of investing gains come from a select few times of the year. When there is uncertainty, and no clear trend, it doesn’t make much sense to try to force gains.
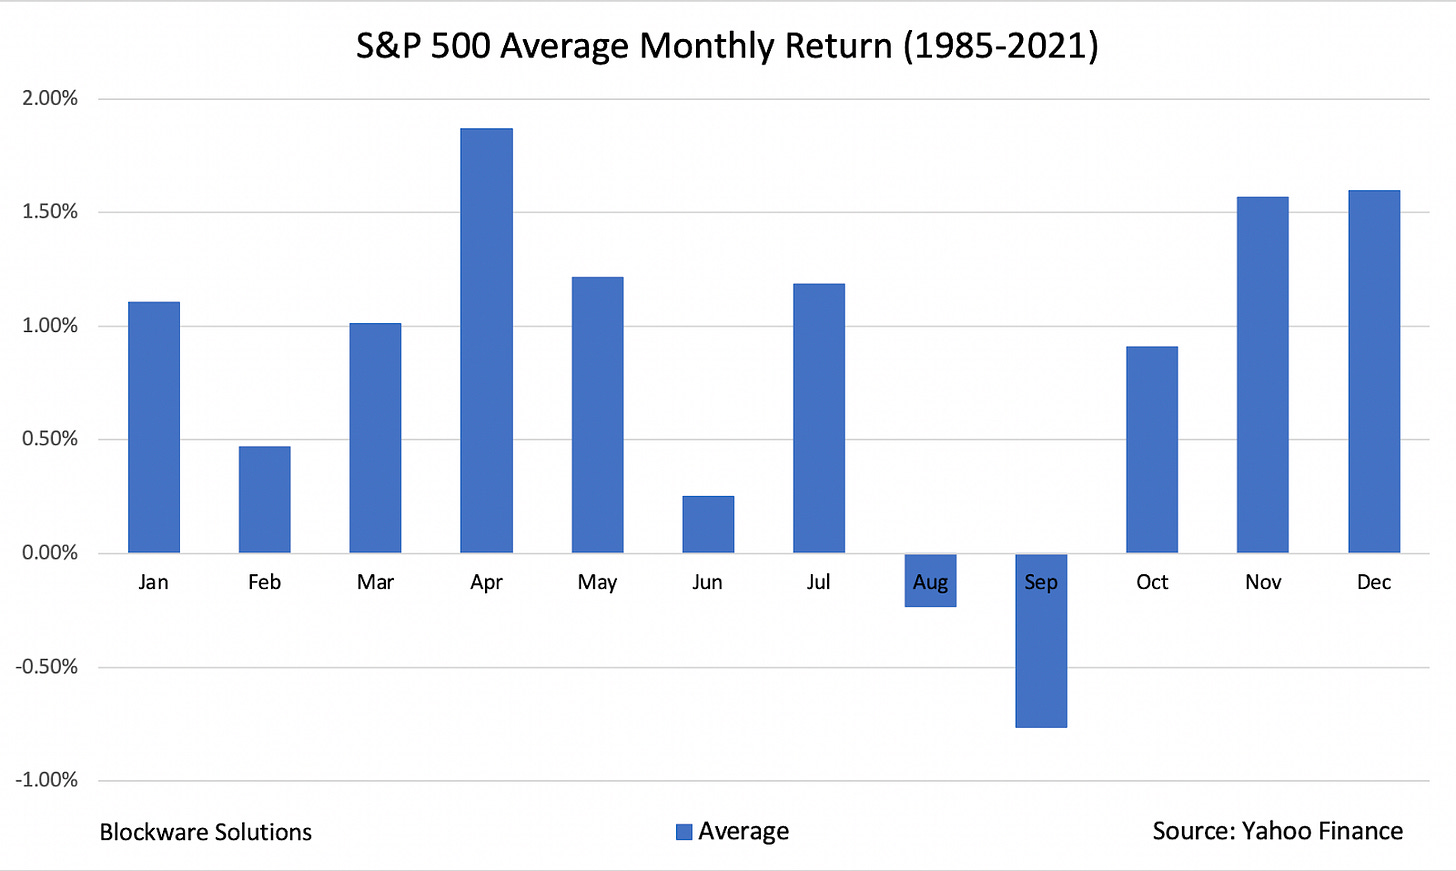
The chart above I created shows the average monthly return of the S&P 500 from 1985 to 2021. While it shows us that February is historically not a super strong month, it more so reiterates the point that there are certain times of year where we see the strongest gains.
It can be difficult for some to step away from the market to solely become observers. Objectively speaking, the ability to sit out is one thing that can turn a mediocre investor into a good one.
This is why I am personally in cash. In the market, we strive to live to fight another day. The safety of holding cash ensures that we don’t blow ourselves up before the next uptrend.
The chop of the current market makes sense when we look at the news. There’s obviously a ton of uncertainty surrounding the situation in eastern Europe with Russia and Ukraine.
It appears to me that areas of the market have begun to price in a conflict. Other areas appear to be stagnant, waiting on news, but unsure what to do for now. This is why we’re seeing strong buyers one day flip to become strong sellers the next.
GOLD 1D (Tradingview)
An example of an area that could be pricing in a conflict would be the gold market. On Friday last week, gold broke through this downtrend line inside a beautiful looking cup and handle pattern.
GLD 1M (Tradingview)
Gold has been building out this base since 2011. With volatility contracting for several months now, classic supply and demand analysis favored a breakout to the upside.
Gold simply needed a catalyst to propel it higher. This catalyst may just be the forces of supply and demand, which work to launch assets out of traditional basing periods. But the timing of this downtrend line break with the threat of large-scale war is definitely curious.
War generally causes folks to shed fiat and other assets and flock to the perceived safety of gold. Furthermore, war is the most expensive endeavor that any government can pursue.
This is why countries would leave the gold standard in the 20th century when they entered conflicts. It gave them the ability to print as much money as they needed, before inflation ran too high. Nowadays, there is nothing stopping them from printing however much money they need to fight the war.
This is another reason why we’ve historically seen gold perform well in times of conflict. Investors understand this concept and prefer to hold gold over government backed currencies with a rapidly increasing supply.
The gold rush in times of war has occurred all throughout history. In the above chart, we can see how the price of 1oz of gold behaved around events in the middle east from the late 1970s to early 2000s.
This, of course, doesn’t mean that market participants are certain of impending war, or that someone knows something we don’t. But the market is forward looking and immediately takes into account all possibilities.
IWM 1D (Tradingview)
On the tech side of things, the Russell 2000 ETF, IWM, hasn’t performed spectacularly since I discussed it last week. This current pattern is most likely to be a bear flag, as the 21EMA (blue) is below the 50SMA (red), which tells me, without a doubt, price is in a downtrend.
Upward sloping flags with price in a downtrend are likely to be sold once price reaches a level high enough for sellers to step back in. This is the opposite of a bull flag, characterized by a downward sloping flag with price in an uptrend.
Yesterday appeared to be an attempt to break down through the lower trendline of this flag. It was a light volume day, so Friday will be a important for confirmation on IWM.
But just because this move is more likely to be sold, doesn’t mean it will. The lack of confidence (uncertainty) around a move is necessary to form a bottom.
SPX 1D (Tradingview)
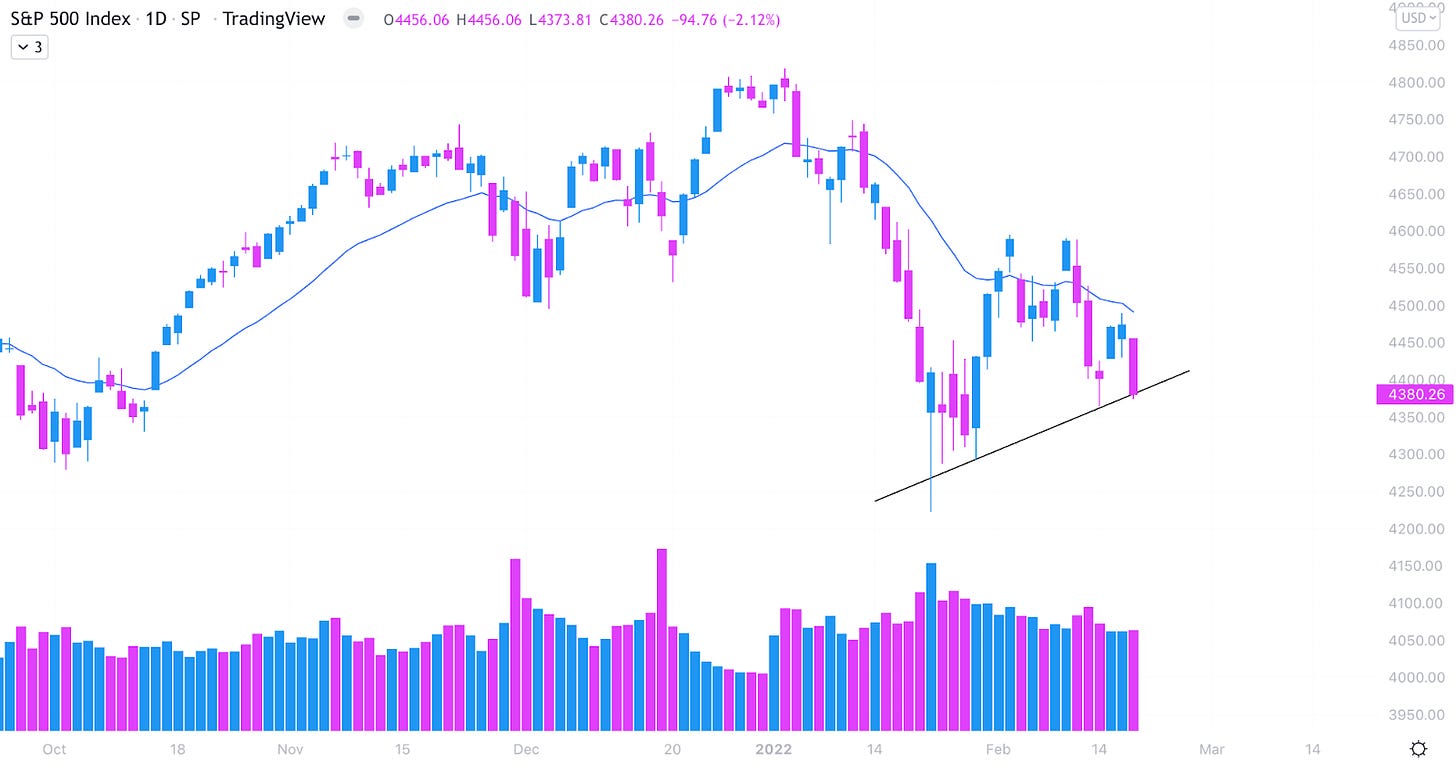
The S&P is in a similar boat as the Russell, with price still in a downtrend stuck beneath declining moving averages. That blue 21EMA has become pretty strong resistance for the S&P, with sellers stepping in nearly every time we’ve come near it.
Some other big news this week came on Wednesday, with the meeting of the Fed Open Market Committee (FOMC). The FOMC meets twice per quarter to discuss the current state of the economy and their plans for the monetary policy of the US.
This week, the members of the FOMC stated large concerns about the current level of inflation in the US. As we know, one way they can lower inflation is by raising interest rates, which has been the Fed’s 2022 plan for quite some time now, along with shrinking their balance sheet (AKA selling the bonds they’ve been buying for the last 2 years).
The FOMC stated that if they can’t get inflation under control soon, they will have to push forward their timeline of rate hikes. It seems likely that March will be the month we see that first hike.
The Fed needs to increase interest rates soon, as inflation has spread beyond sectors strongly affected by the pandemic. They have stated that rate hikes will begin very soon, and the selling of their bond portfolio may be aggressive.
The Fed is essentially stuck between a rock and a hard place. If they wait too long, or are too timid, when they begin to lower inflation, then we could be too far gone. But if they are too aggressive, then they could crash the market and economy.
Crypto-Exposed Equities
This week was no different for most crypto-exposed equities as it was across the general market, with choppy price action across the board.
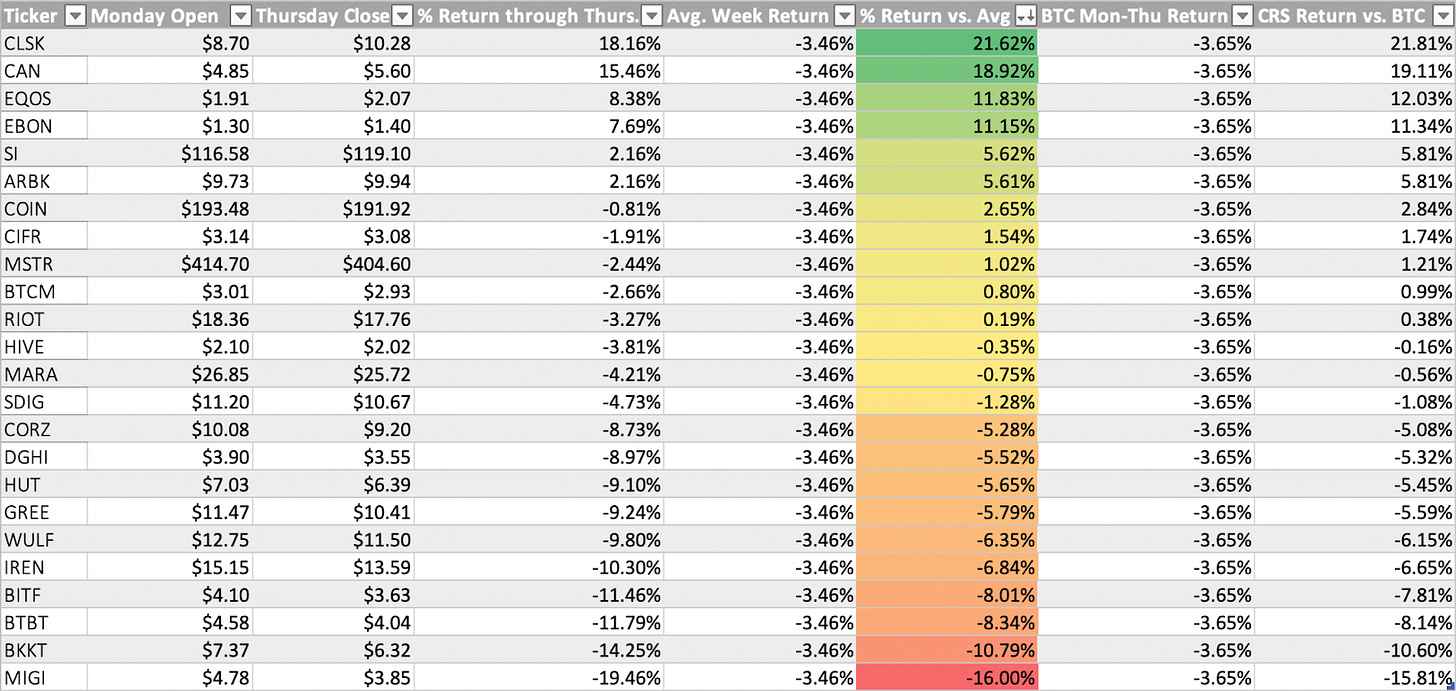
There appears to be a big disparity between the stronger names in the industry group and the rest. Names like CLSK, CAN and EQOS have had strong weeks of price action, but many other names look to be rolling over for a potential next leg down.
What happens next for crypto-exposed equities depends entirely on the price action of Bitcoin. And generally, what happens next for Bitcoin depends on the macroeconomic conditions of the US and world.
This is why I include information about interest rates, bonds and gold in the general market update section every week. It may not seem relevant to cryptoassets to a newer investor, but in reality, it is extremely important.
The relationship between risk-on vs. risk-off periods in the markets is what makes or breaks Bitcoin’s price action. By analyzing the general economic environment, we can get a clue as to when institutions will be interested in accumulating assets like Bitcoin and its related equities.
Above is the weekly comparative excel sheet for our crypto-related equities. This week I changed it up from last time.
Note that all weekly returns are only as of Thursday’s close. I will update this over the weekend to include Friday’s price action and post it to twitter (@Blakedavis50).
In the colored column, we can see the difference in this week’s return and the average return of all names on this list. This is a way for us to easily identify the stocks that are outperforming the rest of the industry group.
I also included the column on the far right, comparing the returns of each name to that of BTC for the week. The order of the stocks will be the exact same. I just included it in case anyone is more interested in comparing these names to BTC rather than each other.
Generally speaking, anything above 0.00% could be considered relatively strong, in my mind. Not to say that things below 0 are weak, but these names are more volatile than BTC and the majority are pretty illiquid (institutions require liquidity).
Bitcoin On-Chain and Derivatives Update
To preface this I think it should be stated that current market conditions are very murky and certainty about uncertainty seems to be extremely high. For short-term traders, it may be wise to wait until more clarity after March’s FOMC meeting. This week’s letter will be oriented towards longer-term investors (9-12 months), given that’s the current mental framework I am approaching the market with currently. Let’s first take a peek at the derivatives market and then segway into on-chain.
Before we get into anything price-wise, can we just take a moment to appreciate the recovery of Bitcoin hash rate? After China banned Bitcoin mining, we have seen a full recovery of hash rate; meaning machines and human capital migrating across the world and replugged in a completely decentralized way. The Bitcoin network continues to prove its resiliency and the network is currently more secure than ever before.
First of all, from a price structure standpoint still looking at the same areas of interest we’ve highlighted for a while: Currently watching to see if BTC can hold the 40k area and set a higher low here, then would be expecting to see a push up to 47k. If BTC starts closing back below, would be eyeing a retest of 30-33k area. 40k has been an area that has defined much of the last year of trading for BTC. Also still believe 47k is the most important area to reclaim from a high time frame perspective, lots of confluence of importance there.
Now on to derivs. The indicator at the bottom of this chart compares a weighted average of the price of all BTC perp contracts and the weighted average of all spot BTC. This gives you the premium or discount depending on if perps are trading above or below spot. Currently, Bitcoin has been in a prolonged regime of spot premium. This is overall healthy for the backdrop of current market conditions and something to consider when putting other metrics or thesis’ into context.
The way I see this is that the longer and more aggressive a regime, the more impactful the move will likely be once that regime finally changes. An example of this was early 2021: degen longs got used to a persistent spot bid bailing them out and leveraging longing every dip. This complacency, as a byproduct of being at one extreme of the spectrum and participants expecting the current regime to continue forever, set the precedent for a massive liquidation wipeout. Very similar, over summer last year shorts got comfy shorting range highs at 40k, and towards the end of the re-accumulation period got comfy shorting 35k. This complacency fueled the move back up as market participants were mentally trained to view every rally as a short opportunity.
Still feel that the 30-35k area is viewed as a value area for large market participants. I think this for a few reasons. First of all, based on price action if we think of the last year of trading between 30k-60k as one giant range, that area sets range lows. Second, we can look at spot order books and see where areas of interest are for large players. Seeing a confluence across several major exchanges of interest at that 30k level.
And lastly, looking at whales’ holdings, saw a fairly substantial uptick on the move down to 30k a few weeks ago, showing that was a level that they were interested in doing business. After grinding up off that low their holdings have gone flat.
Quarterlies are now below 5%, showing a continued decrease in froth from the derivs market. A dip into backwardation would be an awesome buy opportunity if given.
Another interesting thing to keep an eye on that I literally just noticed while tinkering around writing this, is the trend between the 7DMA and 14DMA of quarterlies is interesting to note. Whenever the 7DMA is substantially below the 14DMA has been a decent buy opportunity.
Simply buying backwardated quarts has historically been a great buy opportunity though.
Another chart to watch has been the correlation of Bitcoin to tradfi and the Nasdaq in particular. Interesting that the peak of correlation talks and posting of charts comparing the Nasdaq and BTC was actually when the regime of correlation was starting to revert. Correlation is currently negative. Human psychology never changes; at extremes of trends we expect them to continue that way forever.
Now onto on-chain. In a very broad sense we view the low 30ks as a value area, and overall think the asymmetry is not skewed to the downside for someone with a year-plus time horizon, and therefore see it as a nice time to dollar cost average into the asset. Let’s look at a few data points to illustrate this.
First, we have the Mayer multiple; which simply compares Bitcoin price to its 200 day moving average. Currently sitting at the lower extreme of where it has historically oscillated.
Next, we have dormancy flow. This compares the annualized USD value of destruction to the 365 moving average. This gives you a gauge of how many old coins are being spent relative to the recent overall trend. Again sitting near the lower extreme of where it has historically oscillated.
Similar story with MVRV and STH MVRV as well. Showing Bitcoin’s market price set by the marginal buyer/seller relative to the cost basis of market participants.
Cost basis ratio, comparing the average buy-in of both short and long-term holders is also in the lower 25th percentile of historical values.
Mining
ConocoPhillips ($COP) 🤝 Bitcoin Mining
On Tuesday, one of the largest oil companies in the US announced that one of their natural gas projects in North Dakota is now using excess gas to supply a local Bitcoin mining operation.
This is excess natural gas that would otherwise be wasted and flared. Flaring natural gas has been a practice highly criticized by ESG supporters. Since Bitcoin mining operations can be set up virtually anywhere in the world, small mining operations are scavaging for the cheapest energy they can find. The cheapest energy is energy that would have been wasted. Instead of $COP wasting their excess natural gas, they can sell it to a local Bitcoin mining operation that set up shop directly next to them. This opens up another stream of revenue and eliminates natural gas flaring.
This first public step by ConocoPhillips is likely only the beginning of the energy industry and the Bitcoin industry merging together. Back in October of last year, I hinted at the long-term potential between these two industries.
Bitcoin and Bitcoin Mining are growing far too fast for the largest energy corporations to not take notice. If the next major bull market in Bitcoin occurs in 2025 at the same time there is a bear market in oil, large bitcoin miners may begin acquiring distressed energy companies to vertically integrate their operations.
Hash Rate Distribution by ASIC Model
Just last month, CoinShares released a fantastic report analyzing the Bitcoin Mining Network.
Inside the report is a chart that estimates the total hash rate of the network by hardware unit. It’s fascinating to see what machines were brought offline as a result of the China mining ban and visualize what machines made up the network at the beginning of this year.
Looking at the hash rate drop from the China mining ban, it’s easy to see that a significant amount of Antminer S9s and Whatsminer M20 Series were located in China and brought offline. Since then, it appears a fair amount of those older generation machines are back online.
An interesting thing to note is that S9s were estimated to have ~ 20% of the total network hash rate at the end of 2021 (40EH/s). This is a little less than half of the total estimated hash rate that will be brought on by the largest public and private miners this year (86 EH/s).
The current breakeven electricity price of an Antminer S9 is $0.09 per kWh. This means at the current Bitcoin price and difficulty, this older generation machine is likely on the cusp of dropping off the network. As more S19s and S19 XPs get deployed, the rise in hash rate may start to slow if the price of Bitcoin doesn’t move higher.
The Bitcoin network is self-balancing. If the price of Bitcoin falls, the inefficient weak old machines are the first to drop off the network. Old machines dropping off the network result in a lower mining difficulty. This does not mean that difficulty will adjust significantly down any time soon. However, it does suggest that all of the new hash rate being added to the network may soon begin to push off old generation machines.
Hash Rate Update vs 2022 Projection
As more new generation machines continue to get deployed, hash rate continues ticking higher ahead of schedule.
At the beginning of January, we released our hash rate projection for 2022, estimating that the total network hash rate would end the year around 300 EH/s. A month and a half in, it’s been roughly accurate.
The estimate is about 10 EH/s less than the current 14 day moving average. It will be fascinating to see how fast hash rate continues to rise for the rest of the year. As mentioned above, ~ 20% of the hash rate is estimated to be S9s. If price doesn’t climb, it’s reasonable to assume that some of these older generation machines will start to be unplugged as new generation machines continue joining the network.


Thanks Will - Fantastic newsletter this week. I got a ton out of it. Great insights and perspective.
Great article, however I believe there is a small mistake in this sentence: "estimating that the total network hash rate would end the year around 300 EH/s." Looking at the graph above this sentence I believe it is supposed to be 200 EH/s.