Blockware Intelligence Newsletter: Week 97
Bitcoin on-chain analysis, mining analysis, macro analysis; overview of 7/22/23-7/28/23
Blockware Intelligence Sponsors
Stamp Seed’s DIY tool kit gives you the ability to hammer the seed words generated from your hardware wallet into commercial-grade titanium plates, using professionally designed metal stamping tools.
By hammering each letter into titanium, your words become one with the metal, meaning no loose pieces or varying materials that could fail under extreme conditions. Our plates are fire-resistant, crushproof, non-corrosive, and will not decay over time, allowing you to HODL for the long haul.
Use code BLOCKWARE15 for 15% off sitewide, valid through July 2023.
1. Blockware Intelligence Podcast. Joe Burnett is joined by Kerri Lagnlais, Chief Strategy Officer at TeraWulf ($WULF), to discuss TeraWulf's transition from energy into Bitcoin mining, how Bitcoin miners are beneficial to energy grids, the 2024 halving, and more.
General Market
1. Effective Fed Funds Rate. FOMC announced on Wednesday that they’re raising the Fed Funds Rate by 0.25%, into the target range of 5.25-5.50%. The FFR is now at its highest since March 2001. The Fed meets next in September, giving them 2 months of data to look at.
2. 10-Year Treasury Yield. Yields have generally moved higher since FOMC. This largely stems from Powell’s press conference, where he stated that the Fed no longer forecasts a recession. As you may know, the market is in some senses banking on a recession to bring lower rates. If that recession doesn’t come, the Fed has more incentive to keep rates higher for longer to battle inflation.
3. Core PCE Inflation (YoY). The Fed’s preferred inflation metric, PCE excluding food and energy, was released this morning for June. Core PCE fell to 4.1%, just below expectations of 4.2%, and the lowest nominal level since September 2021. It’s hard to argue that disinflation isn’t well underway, which begs the question, why is the Fed still raising rates?
4. Russell 2000 ETF (IWM). With the slight rise in Treasury yields, we’ve seen some choppiness from small cap equities. It’s important to monitor small caps to understand the breadth of the market. Small caps rallying are the foundation that the market needs for a sustained bull market.
Bitcoin Exposed Equities
5. WGMI, Valkyrie Bitcoin Miners ETF. Public Bitcoin miners have largely seen a pullback this week after several weeks of monstrous gains. Notice how WGMI has thus far held its 21-day EMA (blue) and volume has dried up on the pullback.
6. Bitcoin-Exposed Equities Comparison Sheet. The sheet below compares the Monday-Thursday performance of several Bitcoin exposed equities. With BTC down ~2.9% and WGMI down ~1.2%, public Bitcoin companies are holding up surprisingly well.
Bitcoin Technical Analysis
7. Bitcoin / USD. Bitcoin has so far held this parallel channel and its 50-day SMA. Ideally, price holds the 50-day. If we break below it, the first support range we see is around $28.4-28.7K.
Bitcoin On-Chain / Derivatives
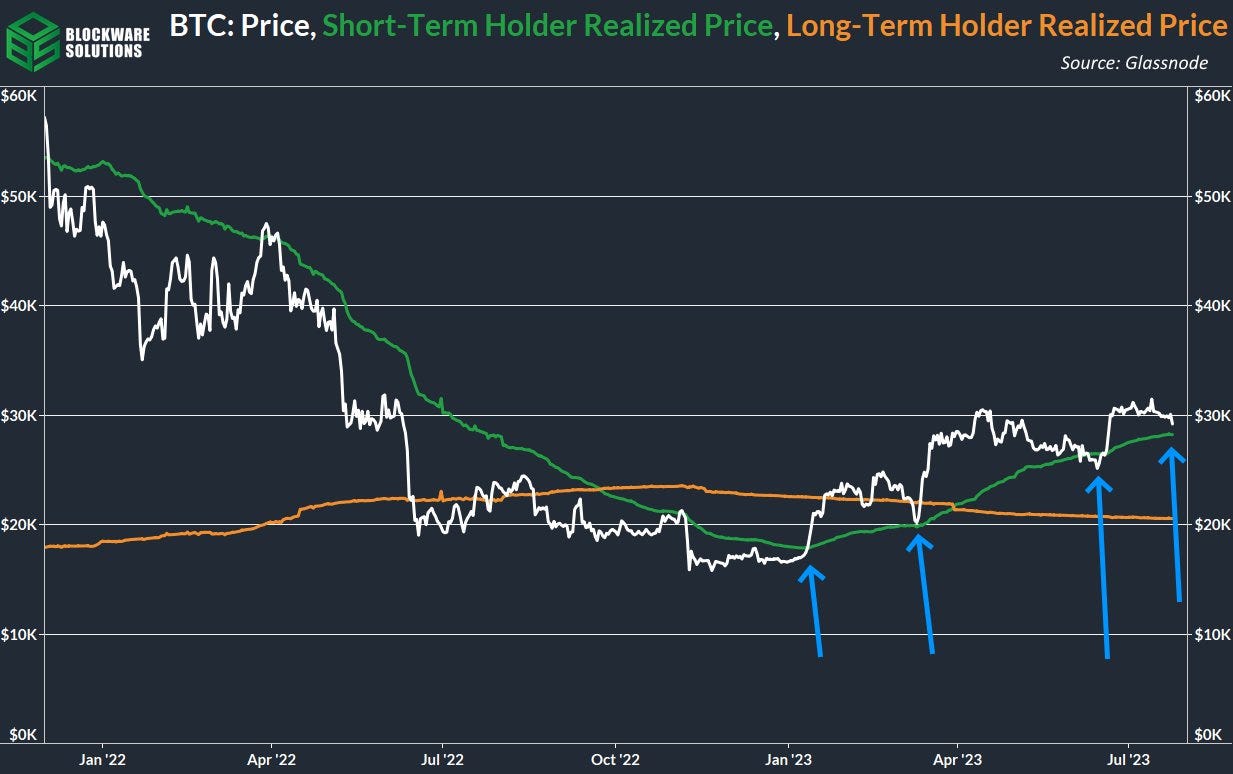
8. Short-Term Holder Realized Price: This metric represents the aggregate cost-basis of short-term holders; the most important on-chain support level when analyzing short-term BTC price action and on-chain psychology. Short-term holders tend to support the cost-basis during bullish regimes, which is why price may bounce up once it hits this level.
9. Seller Exhaustion Constant: This metric multiples the % supply in profit with 30-day realized volatility. When both of these metrics are low a big move in price is due soon; likely to the upside.
10. Realized Volatility (30 Day): Speaking of realized volatility, it’s at its one of its lowest levels in the past six years. The past three times 1-month volatility was this low preceded a significant increase in the price of BTC.
11. Pleb Accumulation: Retail-sized entities (.01 - 1 BTC) are beginning to accumulate at a higher rate, which will likely lead to the formation of a local bottom. If their rate of accumulation continues to accelerate that will increase that likelihood.
12. HODL Waves: It remains that ~70% of BTC have not moved in at least 1 year. This number has gradually increased over the past few months. This is a sign of major illiquidity on the supply side; new bursts of demand can spark rapid price growth.
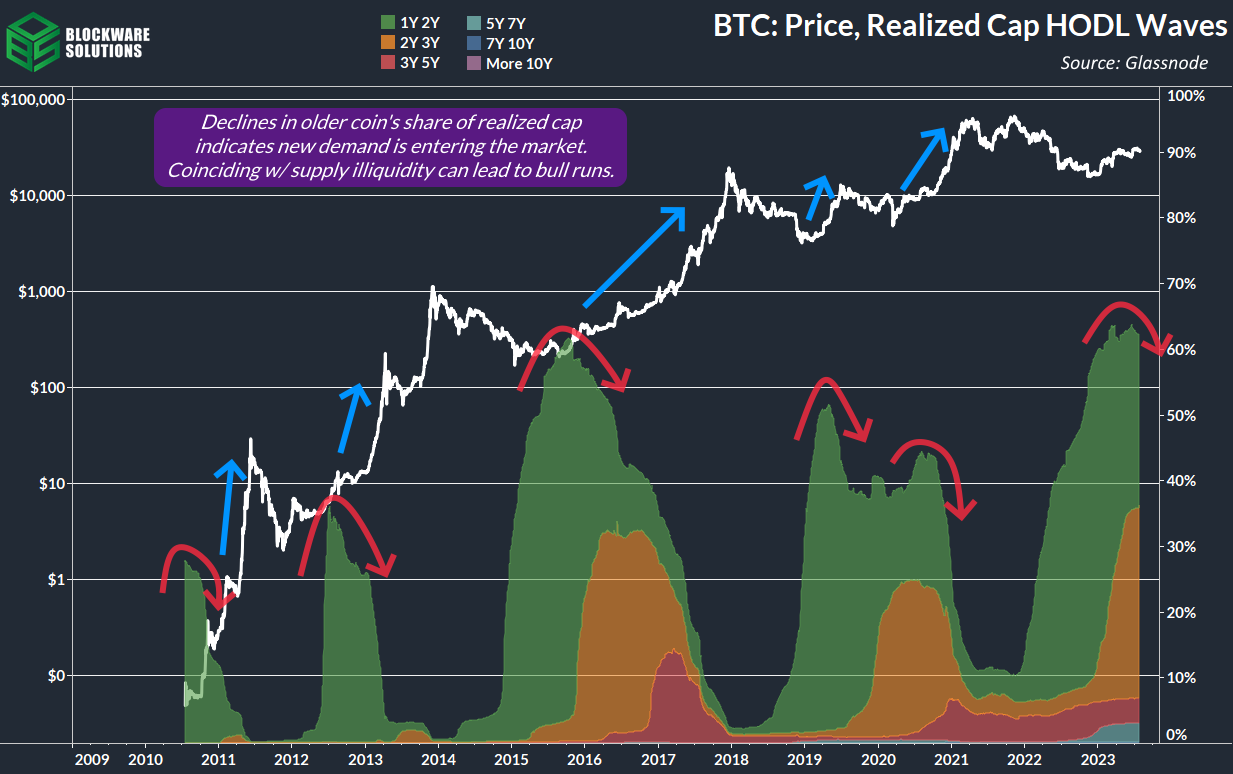
13. Realized Cap HODL Waves: This is HODL waves weighted by the cost basis of each HODL-duration cohort. As the older coin’s share of realized cap declines, that is indicative of new demand entering the market. This can create a positive feedback loop where new demand buys at a higher price, pushing price higher, spawning even more new demand.
Bitcoin Mining
14. Hashprice. Bitcoin’s hashprice now sits at $72 / PH ($0.072 / TH). It’s ~20% higher than its low set back at the end of 2022, but still far away from the ordinal induced peak in May.
15. Next Difficulty Adjustment. On Wednesday mining difficulty dropped 2.9%, a relief for miners. We’re only a couple days into this difficulty epoch so projections are still a shot in the dark, but another small negative adjustment is estimated.
16. Transaction Fees. Back in May Bitcoin saw a few blocks where transaction fees surpassed the block subsidy. Now transaction fees are almost completely back to historically normal levels.
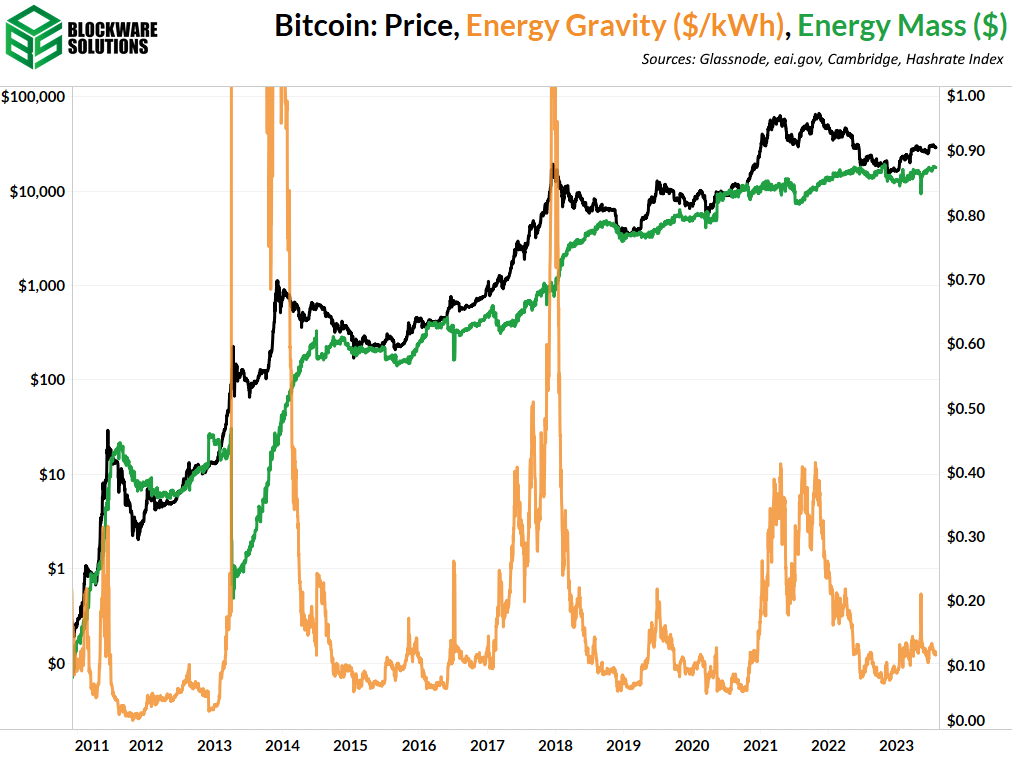
17. Energy Gravity. At a typical hosting rate today, new-gen Bitcoin ASICs require ~$18,000 worth of energy to produce 1 BTC.
All content is for informational purposes only. This Blockware Intelligence Newsletter is of general nature and does consider or address any individual circumstances and is not investment advice, nor should it be construed in any way as tax, accounting, legal, business, financial or regulatory advice. You should seek independent legal and financial advice, including advice as to tax consequences, before making any investment decision.


