Blockware Intelligence Newsletter: Week 7
The bigger picture
Dear readers, hope all is well. Been another volatile week for Bitcoin, fueled by some macro uncertainty and risk-off behavior in traditional markets. Also in the last 24 hours we’ve got both positive news in Twitter integrating lightning and negative news in China banning Bitcoin for the 10th time. Let’s dive into some information you may find useful to understand the current state of the market. Starting off with some shorter term indicators but then I really try to paint the macro picture for you guys. I want to drill home the idea that on-chain analysis should really be used to identify broader trends IMO.
Key OC takeaways:
- Market absorbs two consecutive days of $650M in net realized losses on Monday/Tuesday, risk-off behavior in traditional markets
- Exchange balances have increased by roughly $190M this week, most of which inflowed to Binance on Monday/Tuesday
- After absorbing losses market now slightly back in a state of profit
- Currently between two large zones of on-chain volume
- Price came very close to the floor model I’ve built around Bitcoin’s real time scarcity
- Whales + minnows both accumulating
- Long term investors with little spending behavior continue to lock up BTC, 93% of supply hasn’t moved in a month (ATH)
- Hash continues to come back online, miners slightly back in accumulation after some selling that we’ve been tracking over the last month
Key Bitcoin-related equity takeaways:
- There are clues that the general market has found support but the risk of a continued correction is not off the table.
- General market corrections are great opportunities to hunt down the stocks that will lead the market in the next move upwards. We break down a strategy to compare crypto-exposed equities to both the general market and Bitcoin to find the strongest names in the industry group.
On-chain Overview
First we have our URPD chart, this is essentially on-chain volume, showing where large amounts of BTC have transacted. This can help us gauge where investors cost basis lies and where zones of demand lie. Currently, after just dropping on China FUD this morning, BTC sits in between two large clusters of volume. Will be watching how price reacts at either the upper end of the cluster below us (bounced last week) or at the lower end of the cluster above us as short term resistance.
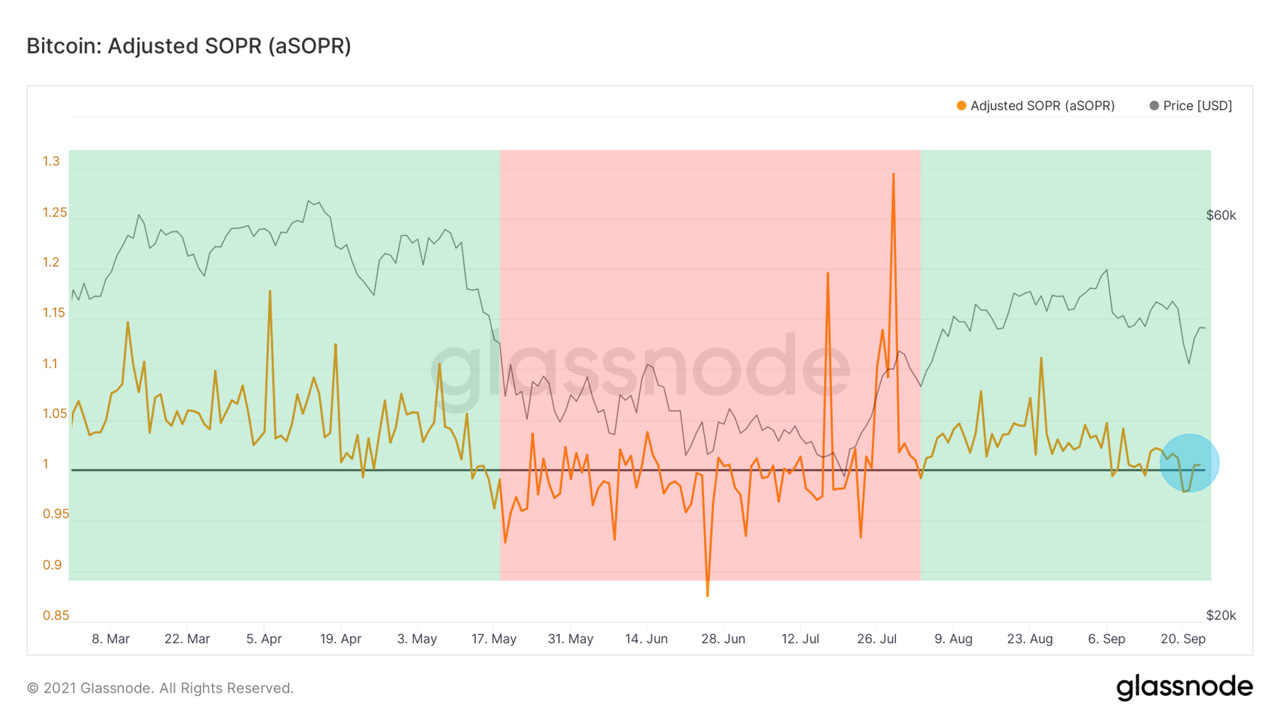
During the sell-off earlier this week the market absorbed roughly $650M in net realized losses back to back on Monday and Tuesday. These were the first consecutive days of net realized losses since early July. Since the market has rebounded into a state of net profit being realized, but want to see this sustained, very similar to the way we view SOPR.
Looking at futures open interest we can see a difference between the liquidation cascade from a few weeks ago compared to the events from earlier this week. The prior event was primarily driven by high OI, high funding, meaning there was a lot of leverage was in the market. Spot sold down enough to trigger stop/losses for traders and boom, initiated a cascade of liquidations that sharply drew down open interest. This recent sell-off seemed much more controlled, resembling risk-off behavior from traders/active managers driven by macro uncertainty.
Funding has now been negative for several consecutive days. This either means spot is leading futures or there is strong demand to be positioned short on perpetual futures.
Similar to our net realized profit/loss metric, SOPR dipped below 1 and since has reclaimed a state of profit. A breakdown below one + failed test of 1 as resistance would be bearish. What we want to see for bullish continuation is to hold a state of profit, retest 1 as support, and then continue stabilizing above 1. In a bear market you want to be risk averse at tests of 1 and in a bull market you want to look to average in buys around retests of 1.
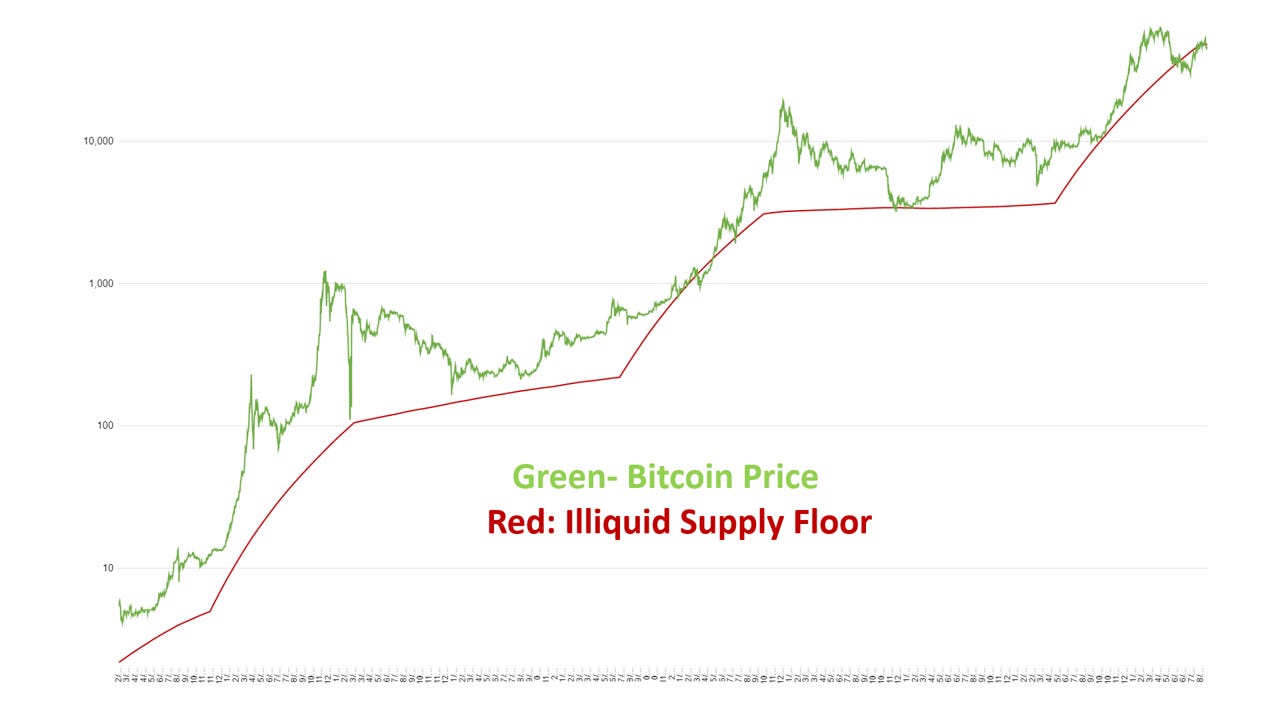
Next is a new metric that I created this week, with help from my friend Matt Faltyn: Illiquid Supply Floor. Using Glassnode’s illiquid supply data, this model is essentially trying to estimate a floor based on Bitcoin’s real time scarcity. Although price has indeed dipped below briefly in mid 2017 and earlier this year, it has never stayed below for long and still remains valid as a proxy for an estimated floor IMO. Currently $38,283.
Next up we have our supply shock related metrics. Long term investors continue to lock up BTC, diverging from price. We saw a very similar divergence back in June/July when we called for the reversal from the low $30Ks. Exchanges had some net inflows this week, especially Monday/Tuesday to Binance; in total +4,586 BTC (~$190M).
Whales are buying and have been since mid-July. When zooming out, we can see that following the trends of whales has been a viable idea. These big players tend to buy early on in broader uptrends and begin selling into strength.
Minnows, or the little guys, have also been buying. When we zoom out looking at the portion of supply held by retail, we see that their holdings are currently amidst a large increase, similar to the middle of each prior major price uptrend.
Entities with low spending behavior continue to lock up coins.
Plotting illiquid supply ratio out over time we see a macro change in investor behavior starting in March of last year. Throughout Bitcoin’s history the asset has become more speculative, now we are seeing that trend reverse itself.
This is also reflected by our HODL waves, showing the portion of supply has hasn’t moved in each denomiated time cohort. 93% of supply hasn’t moved in at least a month, this is an all time high. Another way to think of this is the amount of supply that is actively being traded is at an all time low.
Bitcoin related equities: (written by Blake Davis)
This week goes to show why we don’t try to pick bottoms. Many stocks that towards the end of last week looked like they were going to find some support fell through this week. Things now look to be at better levels but still I don’t see this as a place to dive in fully long. Last week we discussed waiting for stocks to make new relative highs before we dive back in. This is a strategy that keeps us safe and provides the lowest risk opportunities to buy stocks. If a stock is going to run 20, 50 or 100% out of the base currently being formed, missing a few percentage points isn’t a big deal. Investing is all about preserving capital when the market is weak and buying at the best risk-reward ratios once that market turns around. I think we’re potentially setting up for a great Q4 with some tech/growth stocks forming bases and the general market coming off its highs. Bitcoin to me also looks like it could make a move in Q4, as we roll deeper into the fall I believe there will be great potential for opportunities in crypto-exposed equities.
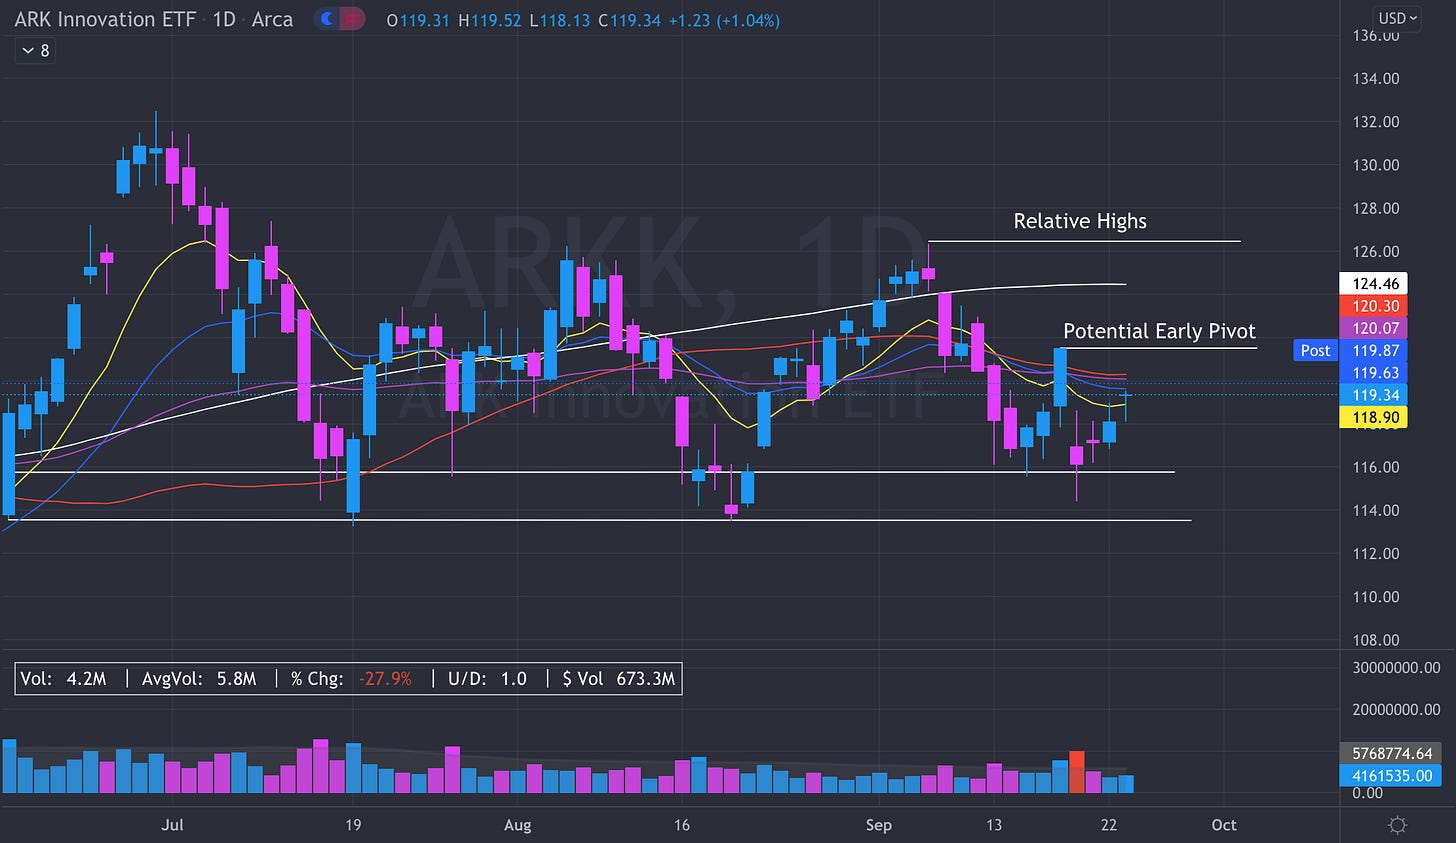
The Arkk Innovation Fund (ARKK) paints a solid picture of what growth stocks have done this week with many of them forming double bottom bases. On Thursday ARKK got back over its 10EMA (Yellow) forming an upside-reversal (hammer) candle. But per usual, there’s a divergence between the strongest names in the market and the average strength names. The stocks who’s charts look like ARKK aren’t the true market leaders. There are several names that have already been back in all time highs for a couple days. Bill O’Neil’s book “How To Make Money in Stocks” says that “Once a general market decline is definitely over, the first stocks that bounce back to new price highs are almost always your authentic leaders.” It doesn’t appear at this time that crypto stocks will be leading the market if the stocks finding support can hold. On a chart of the Nasdaq and S&P, they are both currently being supported near longer term moving averages (65EMA). But, we aren’t totally out of the water yet. A chart breaking its 50 day simple moving average on high volume is never a good sign and generally speaking, takes time to recover. I would bet that it takes at least another couple weeks for the indexes to recover into all time highs and until they do, the market will likely continue to be extra thin.
We know that historically, the strongest growth names will on average correct 1.5-2.5x the general market. Currently, that rule doesn’t include crypto-exposed equities, they are simply too volatile this early in the game and also pull a lot of their price action from Bitcoin. What we can break down is how far they have come down compared to the general market and Bitcoin and then compare stocks to ones in their own industry group. Below is a spreadsheet I created showing my top 30 or so favorite crypto-exposed equities. At the time I created it, the S&P (I used the ETF SPY) was 3.57% off its recent highs and Bitcoin was 17.84% of its recent highs. Around the middle of the table you can see the averages for all the stocks listed. It should be taken to mind, however, that a few of these stocks would be more considered crypto-exposed rather than crypto-related. Companies like Tesla, Nvidia, Square, Paypal etc. have exposure to crypto through a variety of means but not in the same way that a Hut 8, Riot Blockchain or Marathon Digital does. So it shouldn’t come as a surprise that the bigger liquid companies are all at the top of this list. Stocks that aren’t primarily crypto focused aren’t going to be impacted by a crypto correction nearly as much as a validator. For crypto-related equities, this table shows that they are much more correlated to Bitcoin than they are the S&P. This shouldn’t come as much of a surprise. I’ve sorted the table by least to most down compared to BTC. How I’m using this table is to first be able to gauge risk in an investment by looking at how volatile they are compared to BTC. I am also using the industry group average to see which stocks are out-performing the average.


Is it possible to view the Illiquid Supply Floor metric anywhere? Hard to read the data points at bottom of graph and a very interesting metric you've created. Thx for everything btw, love the newsletter.
This really, great. What I find to be interesting is the relative number of long term holders are increasing and the supply in circulation is decreasing. All while the number of users are increasing via El Salvador. Shouldn't the price be closer to what the S2F is modeling at, and not where we are today?