Blockware Intelligence Newsletter: Week 67
Bitcoin on-chain analysis, mining analysis, macro analysis; overview of 12/10/22-12/16/22
Blockware Intelligence Sponsors
If you are interested in sponsoring Blockware Intelligence email: sponsor@blockwaresolutions.com.
Blockware Solutions - Buy and host Bitcoin mining rigs. Now is the time to start mining BTC. Both S19j Pros and S19 XPs are available for bulk purchase.
Summary
Inflation data released on Tuesday shows that CPI has likely peaked.
Despite decreasing the size of their rate hike on Wednesday, an increasingly hawkish stance from the majority of FOMC members has resulted in lower equity and Bitcoin prices this week.
Unlike the equity market, the fixed-income market is indicating that bond investors don’t believe the Fed will raise rates past 5%.
It has been a relatively quiet week on-chain as BTC remains in a period of low volatility and heavy accumulation.
Roughly 65,000 BTC (~$1.1 billion) has been withdrawn from Binance in the past 7 days
Negative funding in the futures market indicates bearish sentiment among traders.
$CORZ appears to potentially be saved from bankruptcy by lender B. Riley.
Bitmain announces new firmware for the S19 Pro series that increases efficiency by 13.6%.
Blockware and Riot co-authored report was discussed on the Stephan Livera Podcast (SLP #442).
TEPCO, Japan's largest power company, is now mining Bitcoin.
General Market Update
After a few weeks of sideways price action, we’ve seen large directional movements as a result of a few key economic updates.
On Tuesday, the Bureau of Labor Statistics released the Consumer Price Index (CPI) data for the month of November.
CPI increased by 7.1% YoY, which was lower than the consensus analyst estimate of 7.3%, and also lower than October’s 7.7%. Core CPI rose by 6.0% over the 12-month period, also coming in lower than estimates of 6.1%.
From a MoM perspective, headline CPI rose by 0.1% from October and core rose by 0.2%. These monthly increases were also lighter than market expectations of 0.3% for both headline and core.
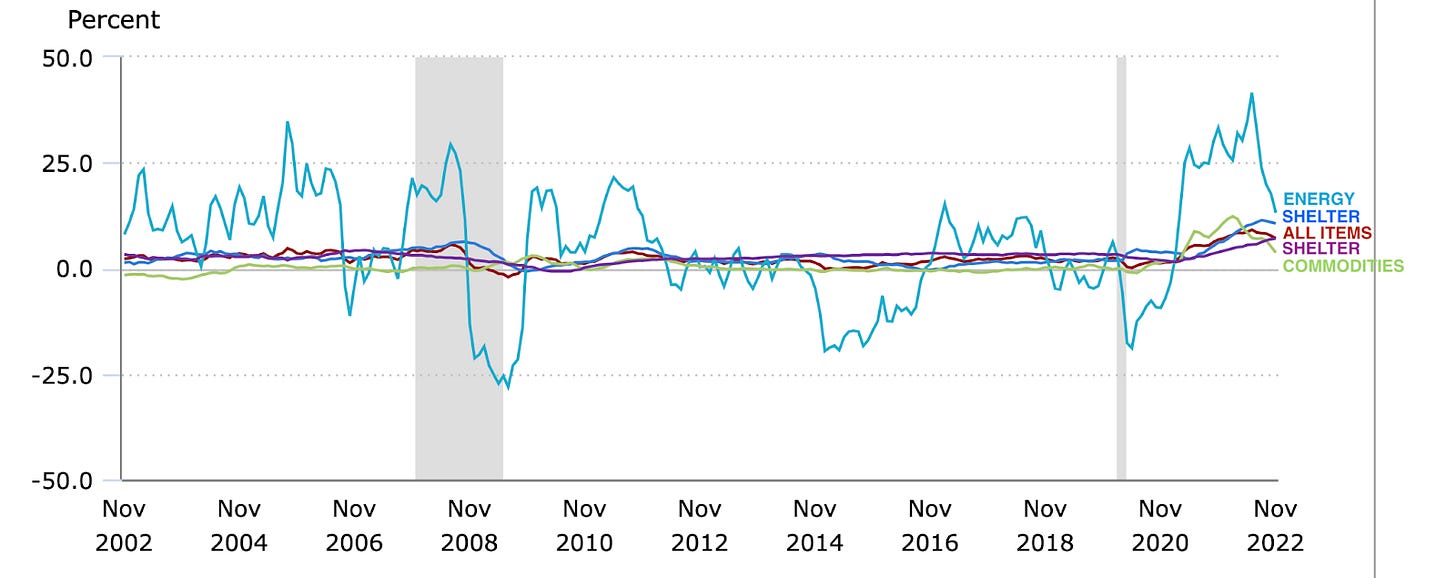
November CPI - Selected Categories (BLS)
When we look at the individual categories of CPI, we see clear signals that inflation has begun to cool down in the US. In the month of November, we’re still seeing increases to food and shelter costs, but saw notable declines in the price of energy, non-food/energy commodities, used vehicles, computers, health insurance, and public transportation, to name a few.
The CPI shelter component is an interesting one to watch, as it makes up nearly ⅓ of CPI’s weighting. In November, we saw continued price increases in this category, but it should be noted the lag that’s experienced with shelter pricing.
Rent costs make up roughly 99% of the shelter component, and the cost of rent is sticky. There is a severe lag between declines in housing prices, and declines in rent.
Generally speaking, it takes 12-months for changes in the housing market to be reflected in the shelter component of CPI. Therefore, YoY inflation would’ve declined by more than 0.6% in November from October because that shelter component is holding CPI elevated.
That being said, inflation remains an issue in the US, and across the world. Of course, declines in inflation metrics are good to see, but prices are still significantly higher than in years past.
In our opinion, this week marked a structural shift in the narrative driving the markets. From the market’s perspective, 2022 has largely been a year where inflation numbers have driven price movements.
This can be explained fairly simply by understanding that the market operates heavily based on expectations of future interest rates. When inflation continues to rise, the market then expects the Fed to raise interest rates even further than previously expected.
Now that we’re seeing headline CPI numbers come down, the narrative has begun to shift away from rising inflation, and towards how deep the Fed’s actions will cause the impending recession to be.
It’s possible that the Fed achieves the mystical soft-landing, however, after the FOMC on Wednesday, this appears increasingly unlikely.
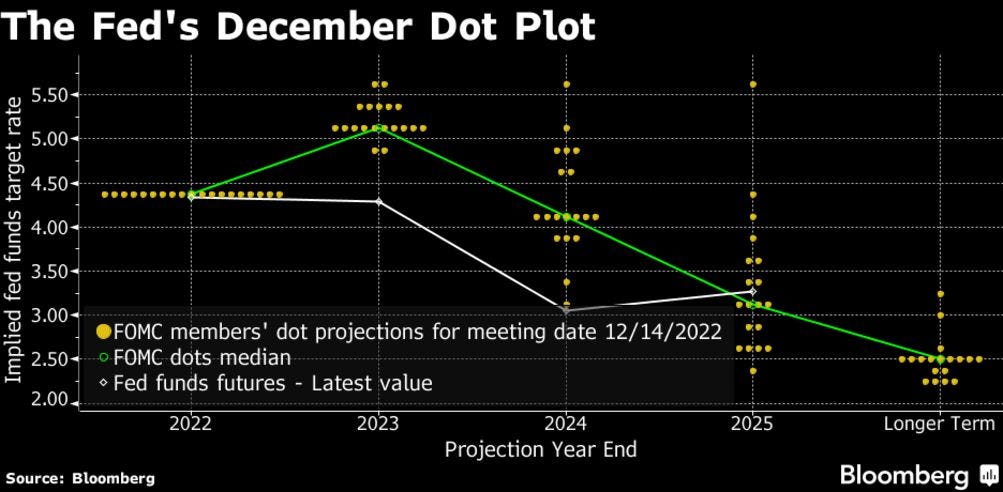
12/14/22 FOMC Dot Plot (Bloomberg)
The chart above, known as the dot plot, shows us the FOMC member’s predictions of the EOY value of the FFR in the next few years. Looking at the 2023 value, we see that 17/19 members now see rates at or above 5.1% at December 31st, 2023, an increase from last month.
This would explain why the market has reacted poorly to FOMC, even though the size of the rate hike decreased to 50bps.
The futures market somewhat agrees with the dot plot, and has currently priced in a roughly 55% probability of rates peaking at 5% by the March 22nd FOMC meeting. The 2-year Treasury, which is also a useful terminal rate predictor, also shows rates peaking in the 5% range in 2023.
This has been the consensus for several weeks now, and explains a bit about why the markets have seen a prolonged rally recently. With the FFR target range now at 4.25-4.50%, the market is indicating that they expect consecutive 25bps hikes on February 1st, and March 22nd.
From there, the market currently finds that the most likely scenario is rates will be held at 4.75-5.00% for the remainder of 2023.
Throughout 2022, the focus of the Fed was the speed of raising the FFR. Now, as rates have already been raised extremely quickly, the focus has shifted to finding the appropriate rate level that can achieve the Fed’s goals.
The labor market is a key area that the Fed looks at to signal how their policy is affecting the broader economy. Of course, the Fed remains committed to their 2% inflation goal, but it feels as though employment was more of a focus on Wednesday than it has been in months past.
Initial Jobless Claims (FRED)
In a contractionary policy cycle, the Fed would like to see an increase to unemployment to indicate that higher rates are having their intended effect of lowering demand. But as you can see above, we haven’t begun to see this, in aggregate.
Initial jobless claims, or the number of individuals filing for unemployment benefits for the first time following job loss, sits at 211,000 as of 12/10. This is down YTD, from 224,000 on 1/1/22. Currently, the unemployment rate in the US is 3.7%.
It should be noted, however, that a significant reason why unemployment remains so low is due to how the unemployment rate is calculated.
The unemployment rate is measured by looking at the number of people who are unemployed, but actively seeking a job. The issue is that currently, roughly 38% of the US population isn’t seeking employment.
So besides looking at the unemployment levels, there are several other employment metrics we can analyze to see what’s going on in the job market.
The chart above shows the MoM change to the average hourly earnings of private employees in the US. The November data released on Tuesday shows that wages grew by about 0.6% last month.
Once again, this shows that the intended effect of contractionary monetary policy hasn’t yet hit the labor market. If employers were truly expecting a deep recession, we’d likely see increases to unemployment, or at the very least, a reduction in wages.
If unemployment remains sticky, it would likely result in the Fed either raising rates higher than their current projections, or holding them elevated longer than currently expected (or a combination of both).
Based on all the data presented in this newsletter thus far, there are essentially 2 schools of thought in the markets right now:
The current expected hike schedule will continue to lower inflation and begin to lower employment, therefore rates will likely peak around 5% in Q1 2023
The current expected hike schedule will not be enough to materially lower employment or sustainably suppress prices, therefore rates will surpass 5% in 2023
Based on the Fed dot plot, FOMC officials have clearly begun to shift from theory #1 to theory #2. This has caused market participants to adjust their approach, which can be seen in this week’s price action.
Nasdaq Composite Index 1D (Tradingview)
On Tuesday morning, the Nasdaq gapped up ~3.6% on the CPI news. But with FOMC on Wednesday, market participants used the liquidity to lower long exposure, thus the ~2.5% decline from open to close for the Nasdaq.
Then starting Wednesday afternoon, with the increased hawkish stance of the majority of FOMC members, the market continued its decline through Thursday. As of Thursday’s close, the Nasdaq is down 6.34% from Tuesday’s open.
After failing to break through resistance at $11,500 for the 3rd time in the last month, the Nasdaq now sits back below its 50-day SMA as of Thursday’s close.
This is an area where readers should be very careful. While we see the most likely support levels at $10,800, $10,500, $10,300, and $10,000 for the Nasdaq, the market could very easily begin another leg lower here.
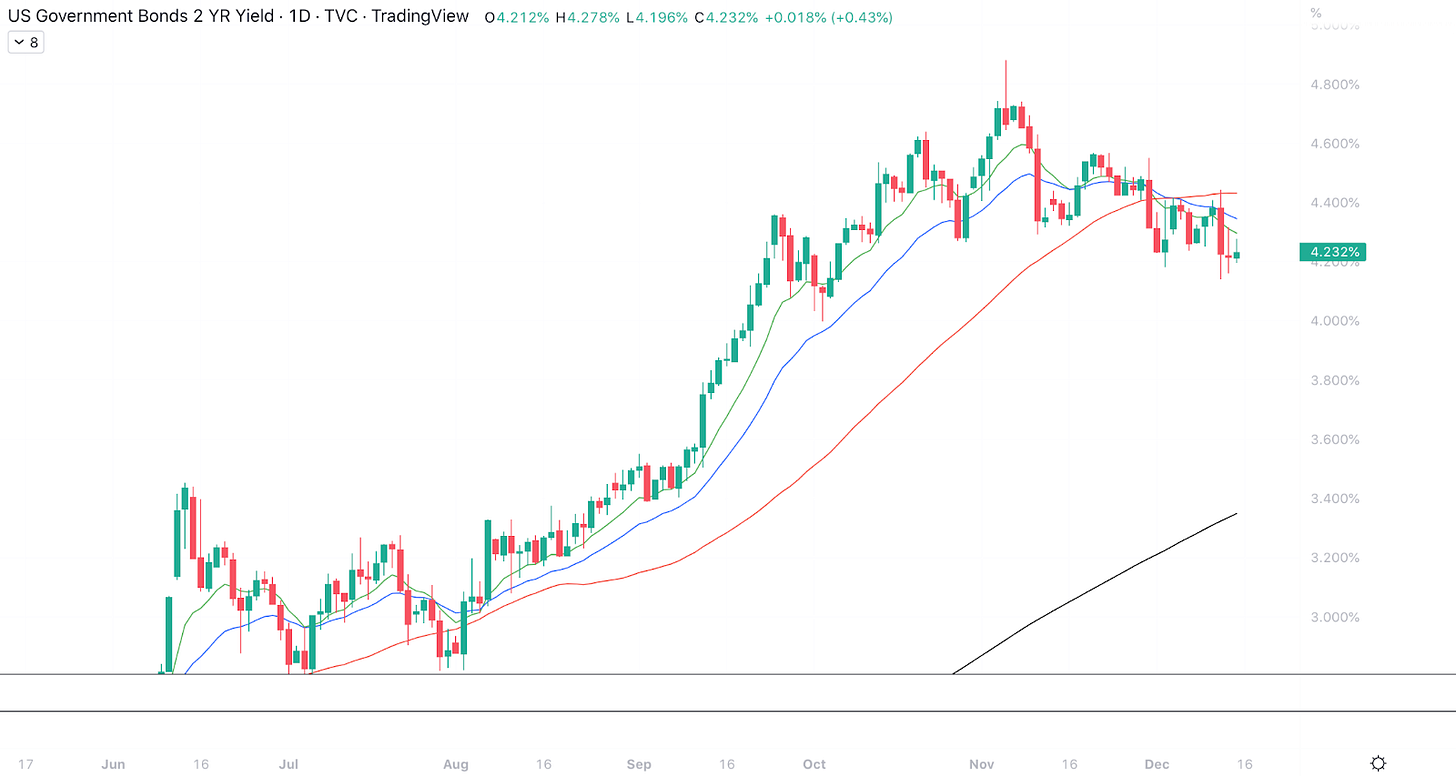
Interestingly, the bond market is currently telling us that they’re not buying what the Fed is selling. In other words, the bond market believes that the Fed will not raise rates past 5%.
2-Year Treasury Note Yield 1D (Tradingview)
While stock prices headed lower on Wednesday, Treasury prices continued to rise. If bond investors were convinced by the Fed’s rhetoric, we would’ve seen a selloff in bonds, and thus a rise in yields.
Clearly this wasn’t what happened, with the 2Y’s yield declining slightly on Wednesday. On Thursday, yields increased slightly, but there’s been no structural change to yield action this week.
Crypto-Exposed Equities
Despite the strength BTC showed earlier in the week, we largely haven’t seen that buy pressure translate into higher prices for crypto-exposed equities this week.
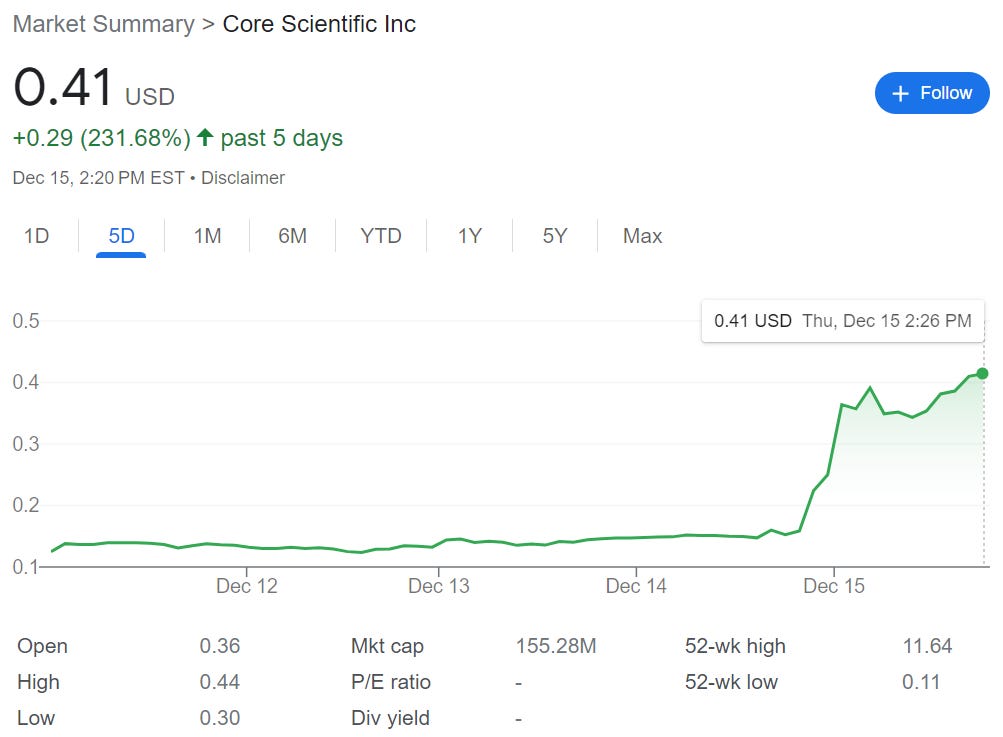
The exception to this has been Core Scientific (CORZ).
CORZ 1D (Tradingview)
The CORZ news will be discussed in the mining section on this newsletter, but it was certainly wild to watch CORZ shares jump roughly 218% this week.
But as mentioned, CORZ was an exception this week. Interestingly, we didn’t see any of BTC’s strength spill over into the crypto-equity group, as we tend to usually. It’s possible that the BTC rally was one that institutional investors didn’t feel convinced about.
Throughout 2022, we’ve seen crypto-equities bouncing before BTC, likely from institutions' front-running BTC buys to double-dip profits. Whether or not this will happen off the bottom is anyone’s guess, but it’s something to look out for.
Above, as always, is the weekly sheet comparing the Monday-Thursday price action of several crypto-equities.
Bitcoin Technical Analysis
As mentioned, we’ve seen BTC’s strength early in the week attract sellers on Thursday and Friday.
Bitcoin/US Dollar 1D (Tradingview)
After an initial bounce above the 50-day on Wednesday with FOMC, BTC ran into sellers around $18,400. Now, as of Friday morning, BTC is breaking back down below shorter-term moving averages, like the 10 and 21-days.
$16,700-16,800 is the next logical area where we could see an influx of buyers. Beyond that $16,400, $16,000, $15,700 and $15,400 would be the next logical support levels before a break into new YTD lows.
Currently, VWAP anchored from the lows created on 11/21 sits at $16,611. This is a key area that our team is watching for short-term strength to flip into weakness.
If BTC is unable to hold this AVWAP, a retest of the lows at $15,460 seems like the most probable scenario.
Bitcoin Onchain and Derivatives
It has been four weeks since the FTX contagion sent the price down another leg. During this time, the BTC price has remained relatively steady in the $16,000 to $18,000 range.
The cost basis of short term holders is down to ~$18,600. This is the first level of resistance that we want to see broken before we can say that the status quo of downward and sideways price action is most likely over.
The quiet price action of the past month is illustrated by low realized volatility. Not counting the moment leading up to the FTX fallout, which had slightly higher volatility than what we have now, this is the lowest level for realized volatility since Q3 of 2020, just before the last bull run. Prior to that instance, volatility was this low at the bottom of the 2018 bear market.
Calm waters do not last long in Bitcoin so be prepared for a sharp move here shortly.
During this period of low volatility we have seen heavy accumulation from various sized entities. Entities with .01 - 1 BTC, 1-10 BTC, and 10-100 BTC have all added to their bags at unfathomable levels.
Exchange balances are continuing to decline. The leading culprit this week has been Binance who, in the last 7 days, has experienced withdrawals totaling almost 65,000 BTC ($1.1 Billion).
There is heavy concern surrounding Binance’s liquidity. Their liabilities have not been publicized and the primary concern is that there may be outstanding loans against users’ assets held on their platform. As the events of this year have shown, leaving your assets on an exchange poses a very serious risk with little upside.
Should this depletion of funds from the Binance turn into a full-fledged bank run, and the rumors of their insolvency proved true, they would be the biggest fish to fall thus far. Binance is one of the largest remaining off-shore exchanges that poses a risk of further contagion. For reference, at their peak, FTX held ~139,000 BTC in their wallet. Binance’s holdings peaked on December 1st at ~657,000 BTC and they currently hold ~588,000 BTC.
The total amount of Bitcoin on exchanges is now below 2.3 million and will most likely continue its rapid decline in 2023.
Perpetual Futures Open Interest has remained down from its local high prior to the FTX implosion. Although leverage is still relatively high compared to earlier in this Bitcoin cycle, it does appear to be clearing out.
After going deeply negative, the funding rate flipped positive briefly and has since flipped slightly negative once again. The signal we can interpret here is that, overall, the futures market is not as fearful as it was a few weeks ago.
Bitcoin Mining
B. Riley Issues Letter to $CORZ Shareholders and Lenders
The Bitcoin Mining industry has been stress tested all of 2022. As stated all year, a falling BTC price, rising energy prices, and increasing mining difficulty weigh on Bitcoin miners. Core Scientific ($CORZ) has experienced extreme turbulence despite controlling almost 5% of the total network hashrate, as of the end of October. Core Scientific at one time had one of the highest market capitalizations among all miners, yet their high levels of debt have put extreme pressure on their ability to remain solvent.
In a rather surprising turn of events, B. Riley issued a letter to $CORZ shareholders and lenders proposing debt restructuring to the Core Scientific Board in order to avoid bankruptcy. Shares of $CORZ were quickly revived after the announcement. The letter included terms to potentially provide two years of runway in the form of non-cash pay financing. If the restructuring is successful, it would be great news for $CORZ.
New firmware for S19 Pros
On Wednesday, December 14th, Bitmain published this interesting Christmas announcement relating to an S19 Pro series firmware upgrade. The power efficiency would improve from 29.5 J/TH to 25.5 J/TH, a 13.6% improvement. This would move the pros even closer in efficiency to the XPs which currently operate at 21.5 W/TH. Time will tell how effective this firmware really is out in production, but if it is successfully rolled out, it will likely increase the market value of pros relative to XPs.
Blockware will certainly be seriously exploring the new firmware for both client and self-mining rigs. Our plan is to test this out on a few self-mining units before a potential beta with clients. If this works as advertised without too many complications, it could be very interesting.
Blockware and Riot Report Discussed on the Stephan Livera Podcast
If you have not already read the original report, Bitcoin Transaction Fees, take a look or listen to the podcast to learn more about what happens after all 21,000,000 BTC are mined.
TEPCO is Mining BTC
TEPCO, Japan's largest power company, is now mining Bitcoin. They are beginning with a 1.5 MW pilot project. This is simply a continuation of the energy industry beginning to merge with the Bitcoin mining industry. Bitcoin Magazine published more on this announcement here.
All content is for informational purposes only. This Blockware Intelligence Newsletter is of general nature and does consider or address any individual circumstances and is not investment advice, nor should it be construed in any way as tax, accounting, legal, business, financial or regulatory advice. You should seek independent legal and financial advice, including advice as to tax consequences, before making any investment decision.


