Blockware Intelligence Newsletter: Week 5
What happened on Tuesday? Does this event have any broader implications?
Dear readers,
Hope all is well. It’s been another wild week for Bitcoin, including the largest deleveraging event since May 19th. This move was caused by a cascading liquidation of leveraged traders. On-chain is used to track broader underlying market structure, while on shorter-term time frames derivatives can drive price fluctuations. With this in mind, we’ll discuss in this letter how these fundamental investor trends only have strengthened and I don’t see anything to be concerned about from that perspective. However, from now on, some high-level derivatives data will be covered in this letter to keep you all prepared for these potential zones of heightened short-term risk.
Key takeaways:
- Substantial leverage wipeout this week, liquidating $1.23B of longs, wiping perp futures open interest out by roughly $4.4B
- Selling was done by young coins, LTHs seem unphased (their holdings actually increased)
- Whales have bought an additional 44,393 BTC ($2B) this week, including an uptick during the liquidation cascade on Tuesday
- Exchanges are down another 25,733 BTC this week (~$1.18B)
- Profitability has reset and bounced back into a state of profit, a reset we had been watching for in the back of our minds these last few weeks
- Hash continues to come back on the network, miner profitability in BTC terms dropping, in USD terms flat. Miners have sold an additional 467 BTC (~$21.2M) this week.
What happened Tuesday?
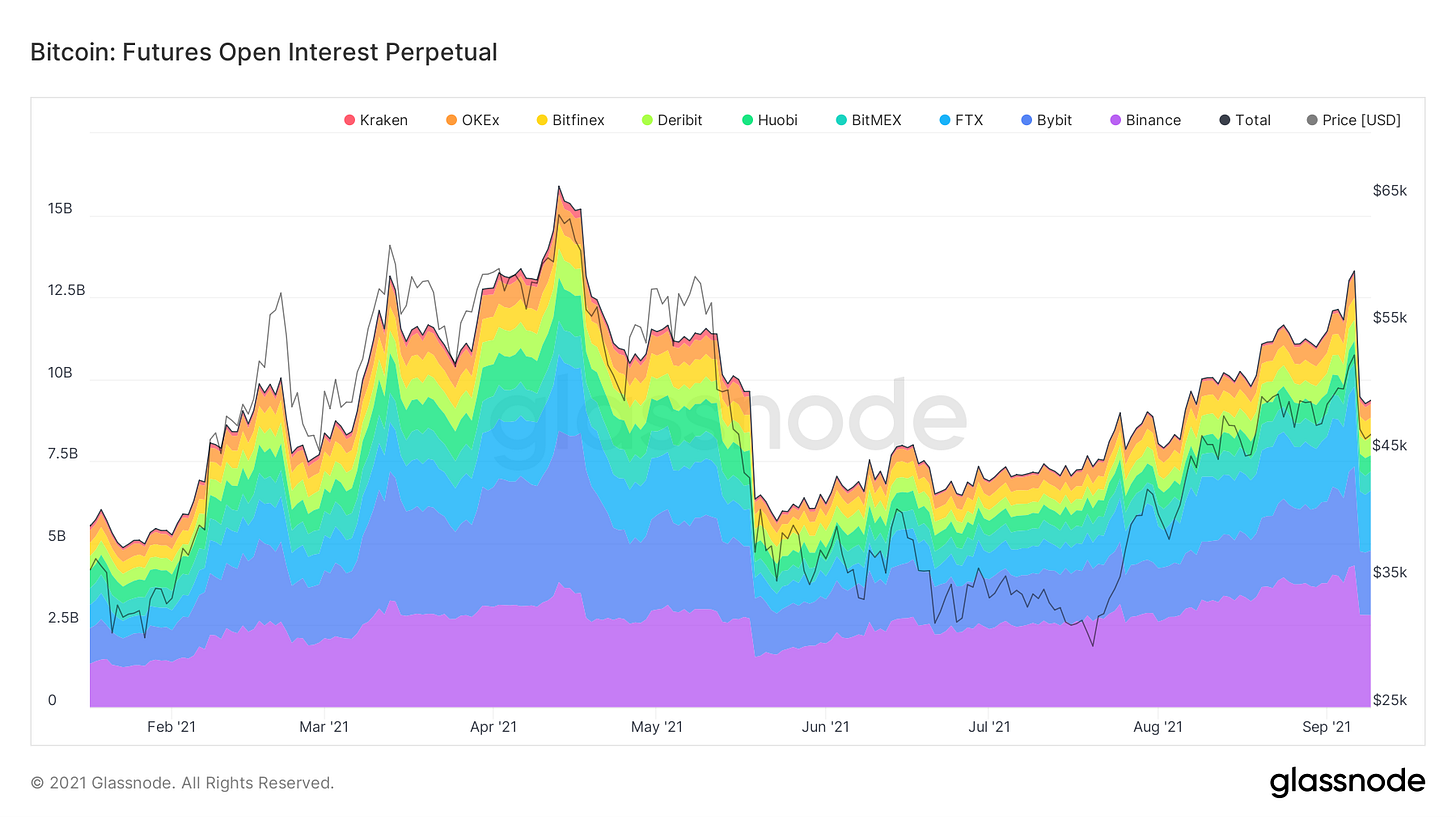
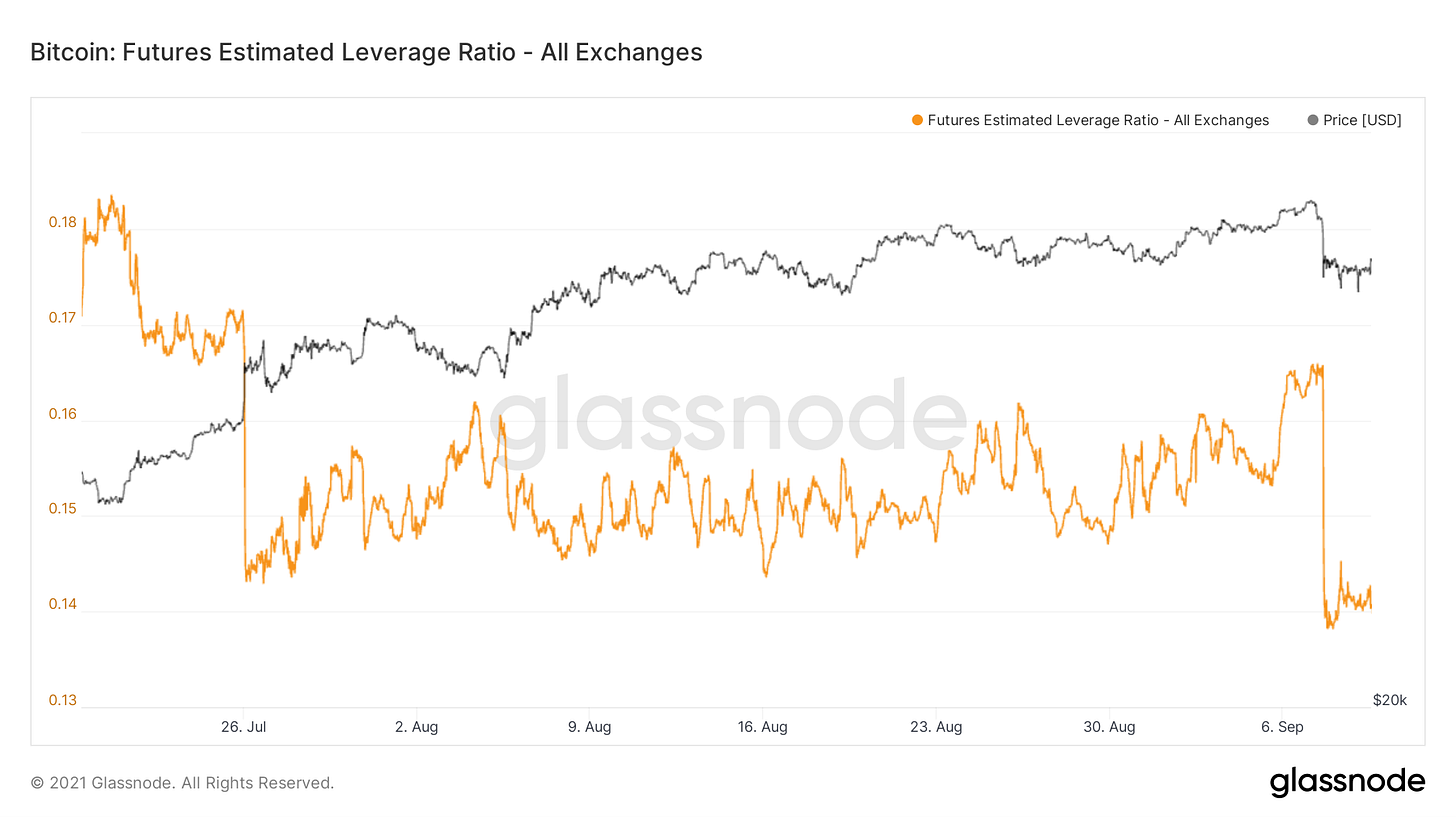
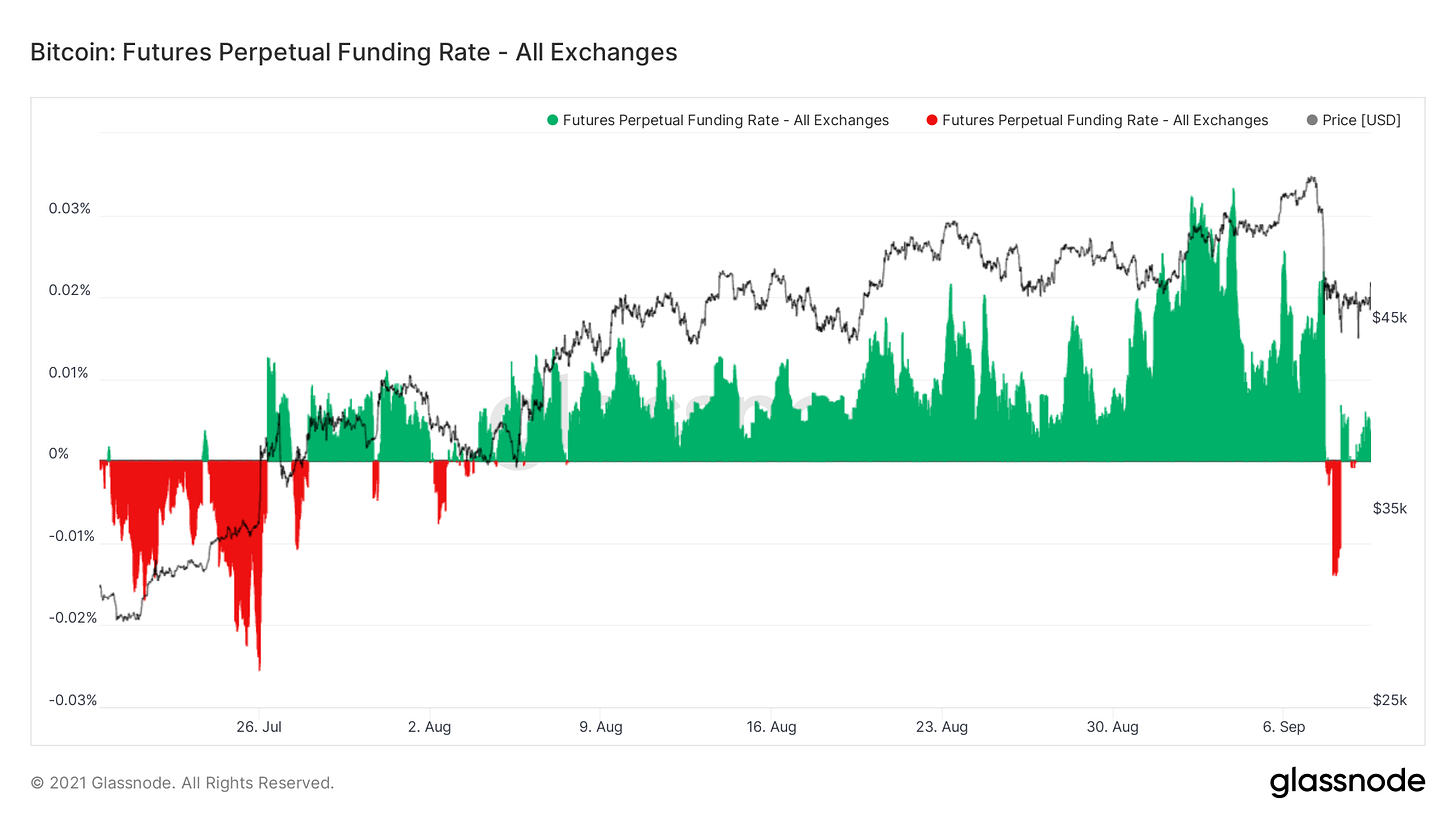
Tuesday was the largest long liquidation cascade the Bitcoin market has experienced since May 19th. What exactly happened? Prior to the crash, we had futures open interest rising alongside an uptick in our estimated leverage ratio on Monday. Funding was also positive at the time, although far from prior levels reached earlier this year. These factors in the derivatives market gave a favorable setup for a leverage cleansing, although I must admit I did not see an event of this magnitude in the cards. One piece of information I wasn’t paying attention to and may be useful to us all moving forward is the spot margin lending rates on FTX. This is something Willy pointed out to me while discussing the event and will be an indicator I follow moving forward.
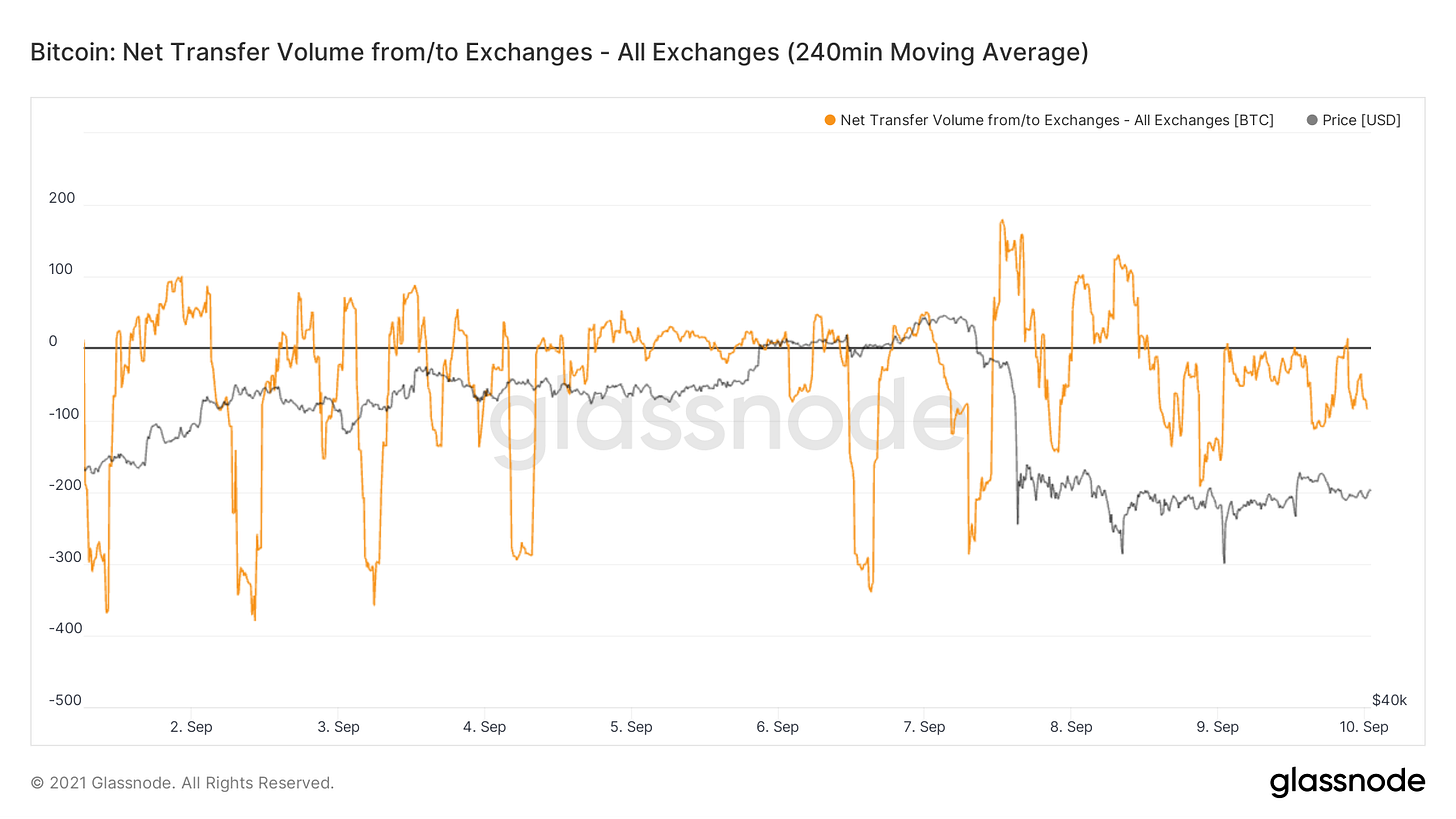
Prior to the cascade, there were some coins that moved onto exchanges, although nothing alarming. (this is the net flow of coins to/from exchanges) However, due to how leveraged (in effect fragile) the market was this could have been the catalyst to initiate the cascade. Have also anecdotally heard that a large OTC sale was partially responsible, although I can’t see this in the data I use. (Glassnode only tracks 6 major OTC desks)
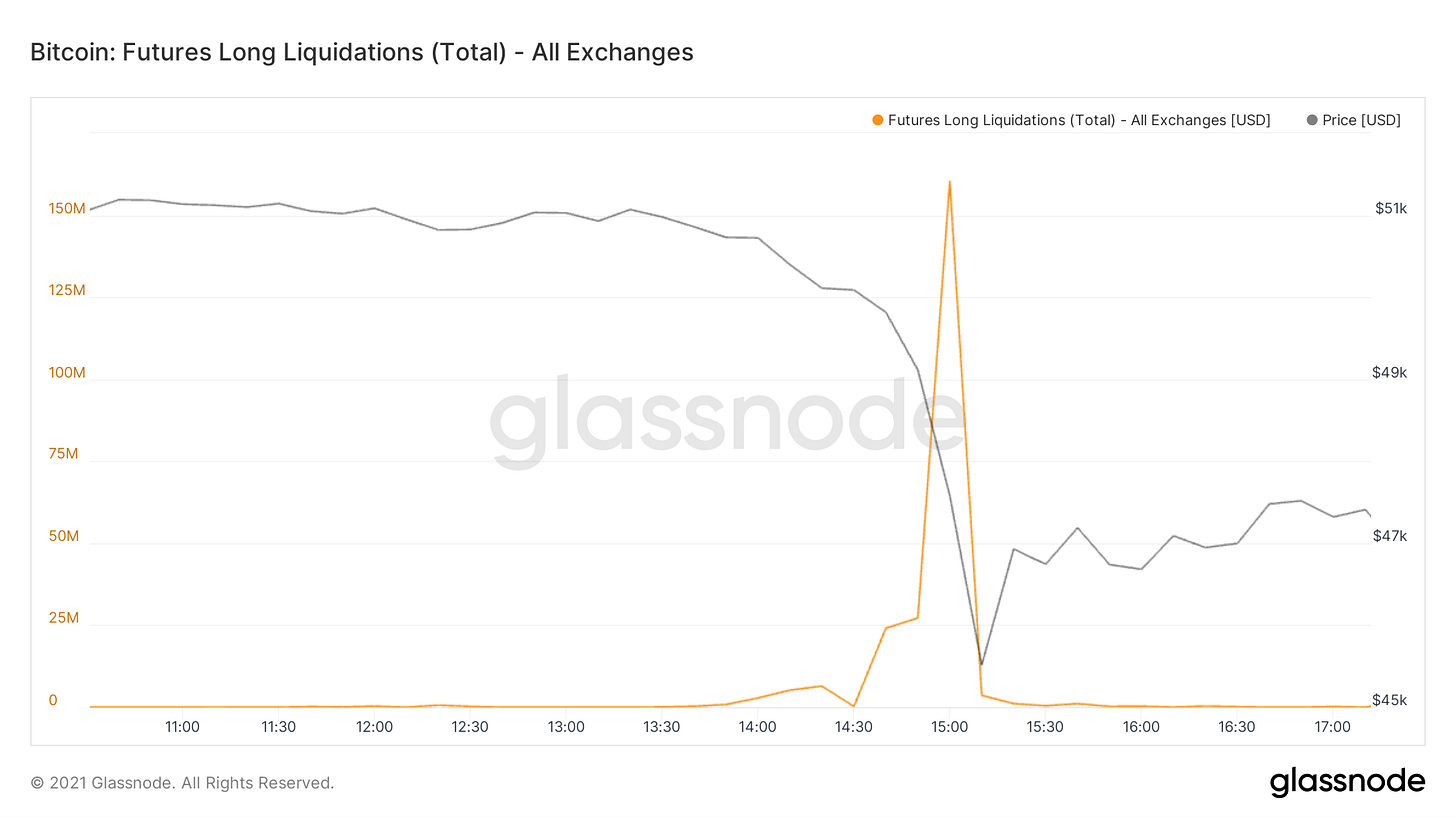
As one trader’s forced liquidation sale triggered the next trader’s stop-loss, roughly $1.23B of longs got liquidated, ~$622M of which came from ByBit. In case you’re wondering why that $1.23B figure doesn’t align with the chart below, the liquidations represented in Glassnode’s data (chart below) only cover Binance, Bitmex, and Okex, so I had to pull additional data from an external derivatives data provider to get the full picture.
In total, roughly $4.4B of perpetual futures open interest was wiped. I view this as a healthy cleansing, especially when you get a view of how investors acted throughout the event. (we’ll get into this shortly)
Here’s a view of funding rates. As we mentioned earlier, they were rising prior to the sell-off. We got our first reset to negative funding on an hourly scale since early August.
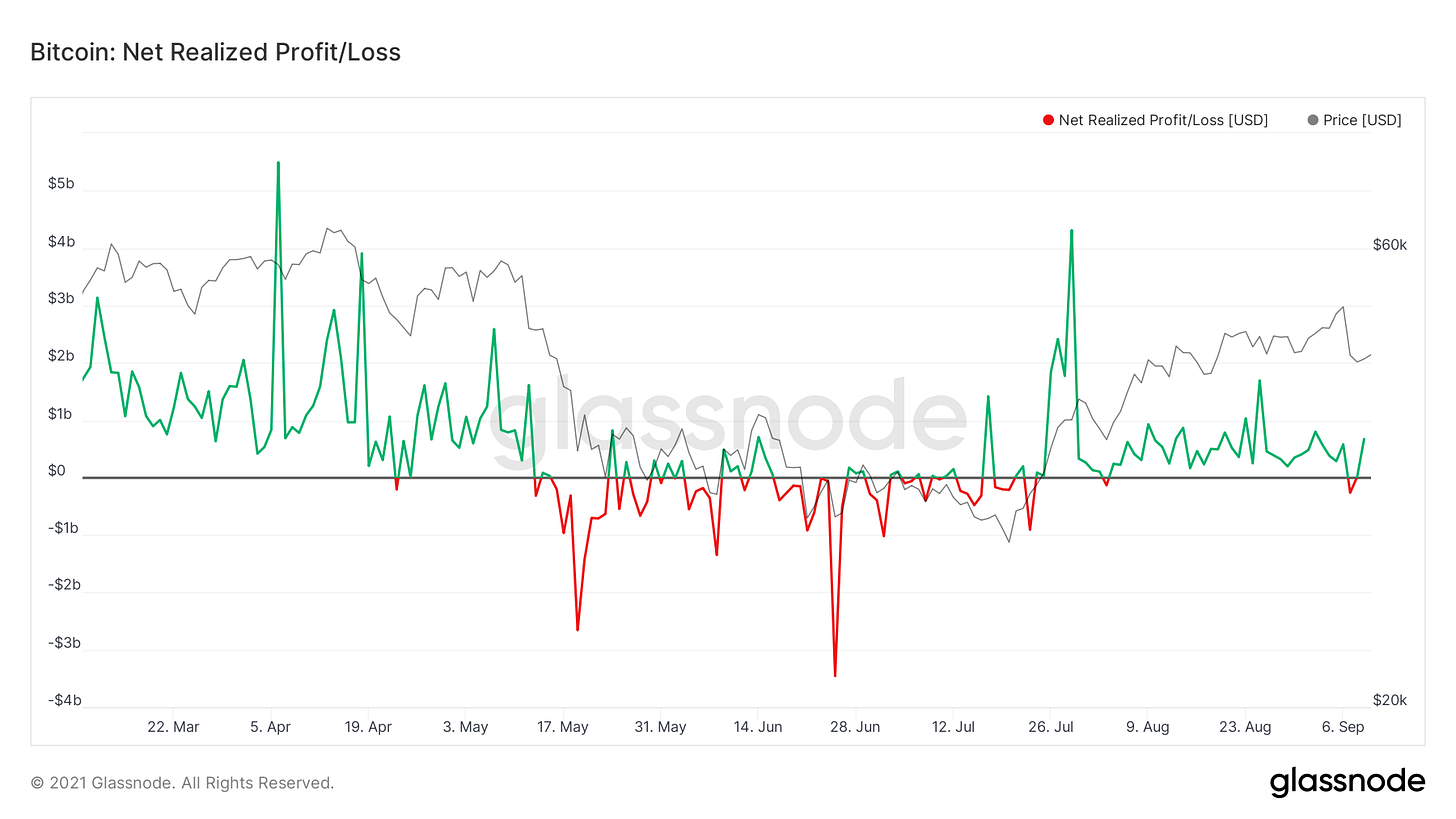
In total, the market absorbed $262.5M of net realized losses, the first day of net losses since August 3rd. Since then the market has bounced back into a state of profit. To get another angle on this we’ll transition over to our good old friend SOPR.
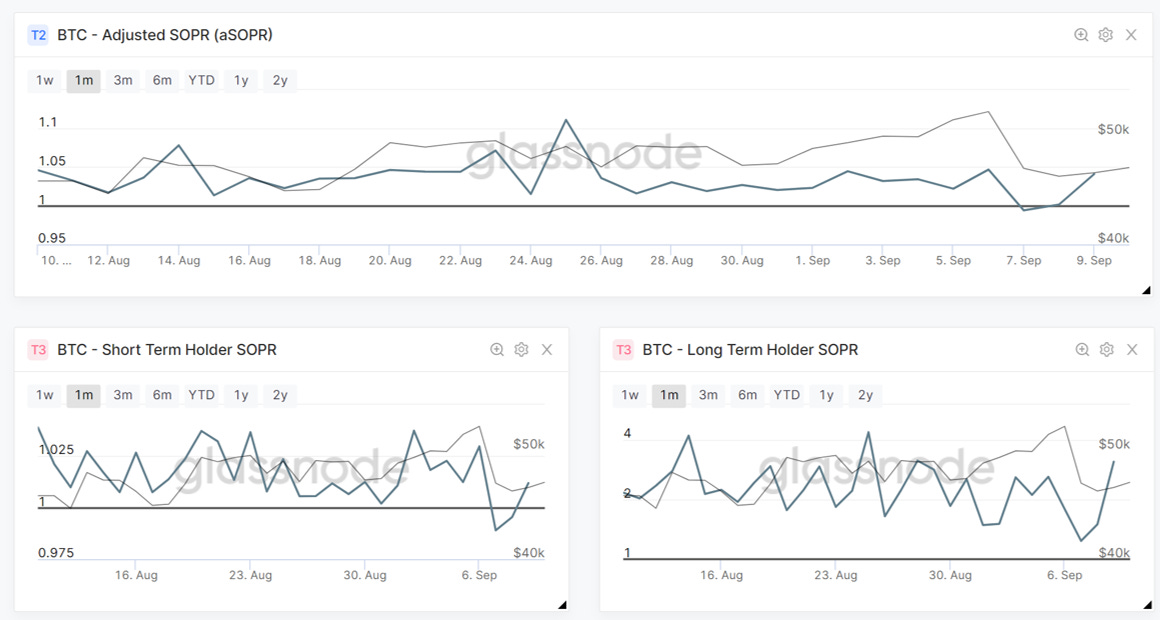
SOPR is a measure of the state of profit/loss that coins trading on any given day are carrying. On the top, we have our aSOPR metric, which excludes outputs <1 hour. (filters out the noise) This has bounced off a very slight dip below 1, now back in a state of profit. This is pretty much a textbook SOPR reset in bull markets. Given you are in a macro bull market, these retests of 1 serve as great buy-the-dip opportunities. Conversely, SOPR can also be used in bear markets to fade each rally in which SOPR tests 1. In the bottom left you’ll see short-term SOPR, using Glassnode’s entity clustering heuristics. The dip below 1 was a bit more defined for STH's, showing they were selling at a loss. Meanwhile, long-term-holder SOPR bounced without even tagging 1.
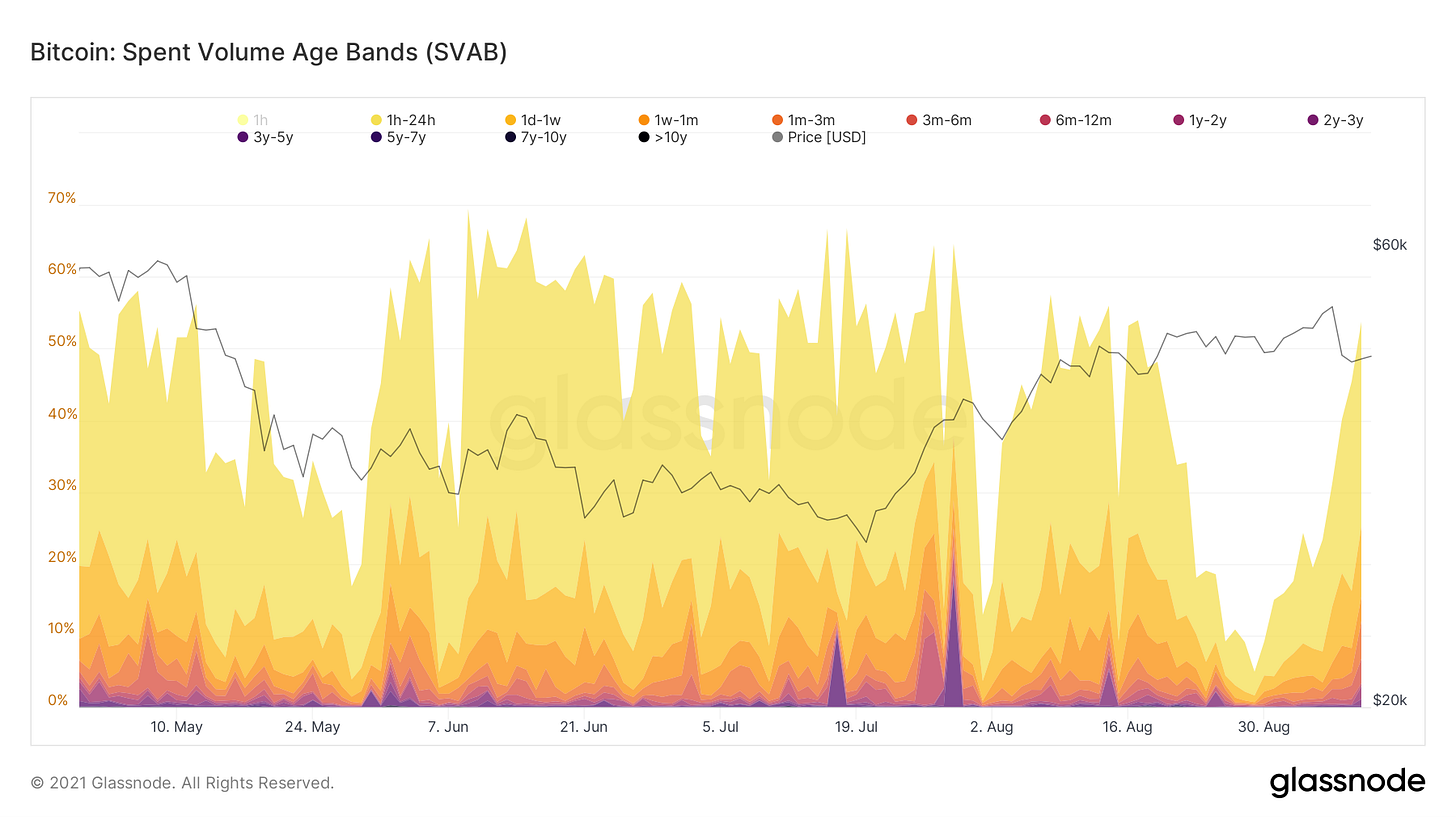
On a similar note, when trying to identify who was responsible for the majority of selling on a given day we can use our spent volume age bands metric. This shows the percentage of spent volume derived from each age bracket of market participants. Similar to what we see in STH SOPR, we also have a large uptick in spending coming from younger cohorts. In conclusion, liquidation cascade mixed with some selling from younger coins. Comparing this with the accumulation behavior that took place this week and on Tuesday specifically is quite interesting. Let’s take a look.
How does this affect market structure?
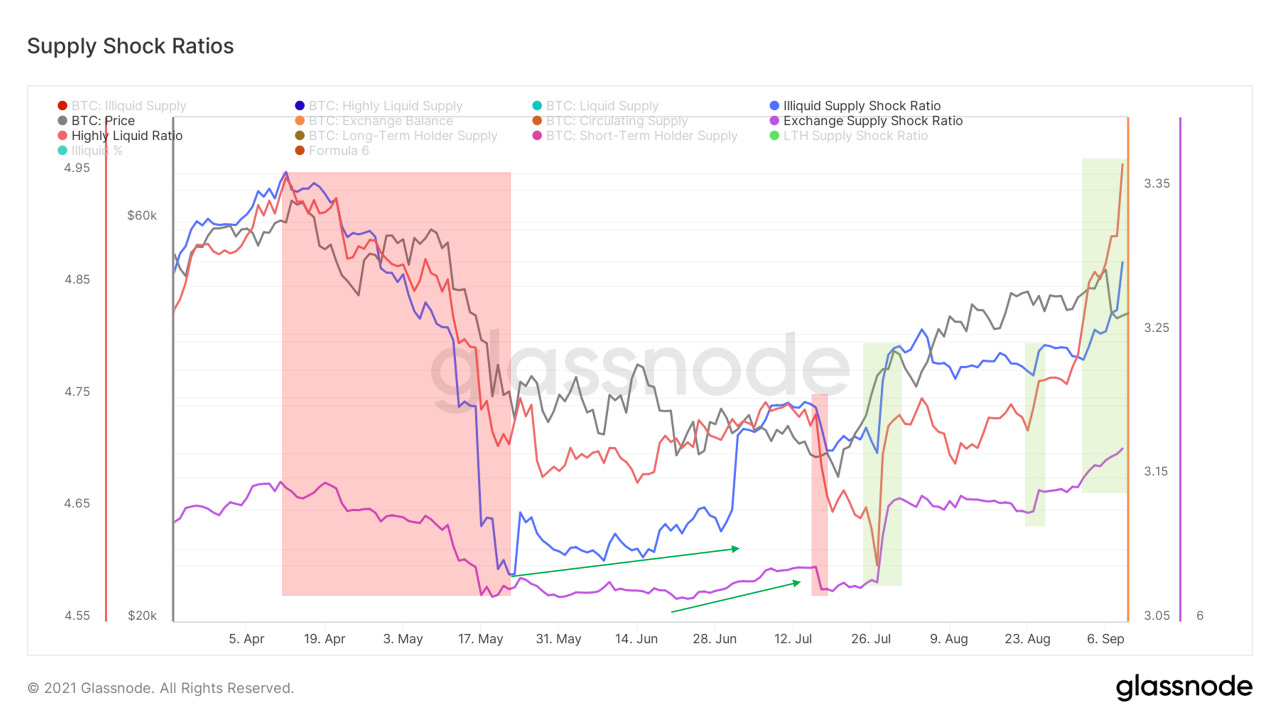
So has this event changed any of the broader trends that we’ve been following? The answer is no. In fact, these accumulation trends have only strengthened. Exchanges are down another 25,733 BTC (~$1.18B) this week, reflected by our exchange supply shock metric. We also saw a spike in coins moving to strong hands reflected by our illiquid supply shock ratio this week, including a positive print on Tuesday. Our highly liquid ratio also saw a large print this week, showing coins moved from highly liquid entities to liquid entities. (in & out speculators to short term investors) Would like to see this translate into illiquid supply.
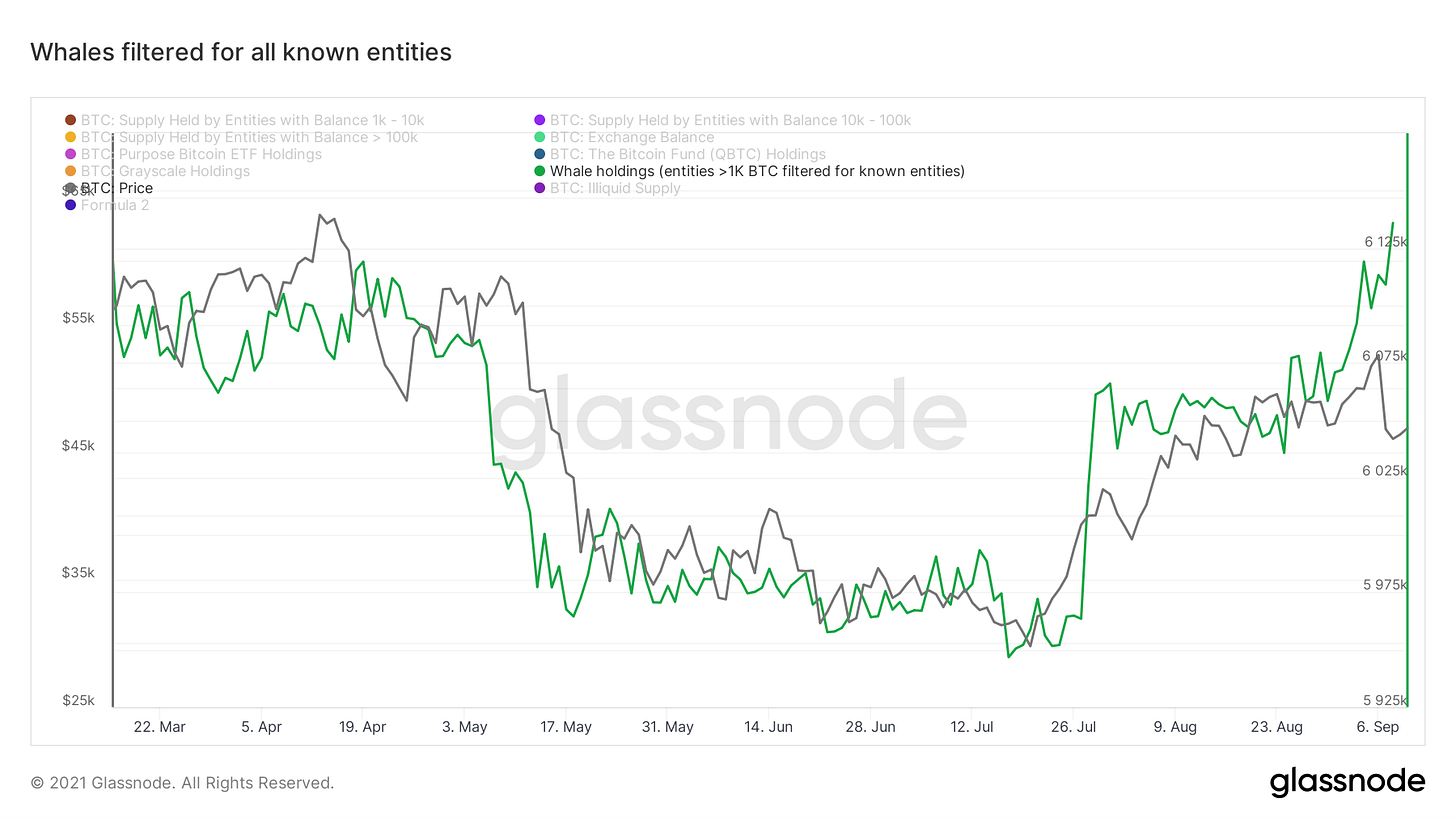
In addition, we saw whales increase their holdings again this week. This metric takes all entities with over 1,000 BTC and then filters out known entities we’ve identified on-chain such as Grayscale, Purpose ETF, QBTC, and most importantly exchanges. In total whales added 44,393 BTC (~$2B) this week.
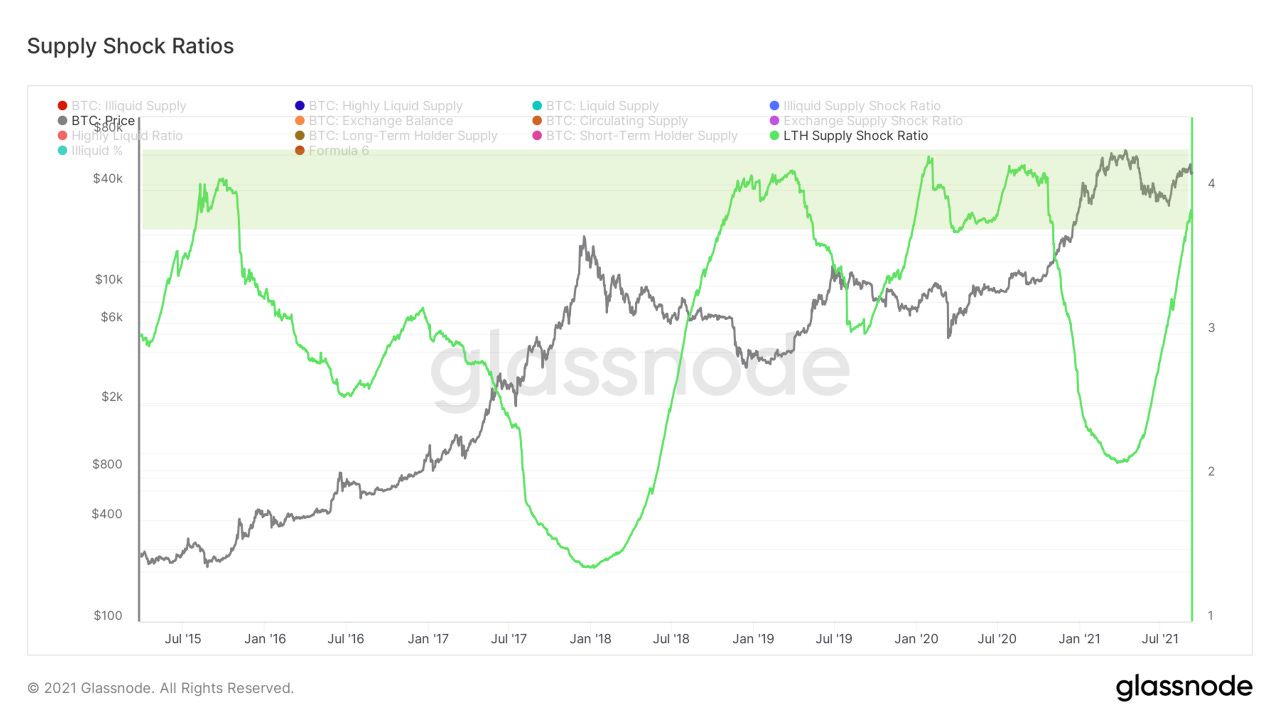
It’s easy to get concerned by these short-term moves, but I think it’s important to remember the broader picture is highly bullish. Here we have our long-term holder supply shock ratio, comparing coins held by LTHs to STHs. What we see is that the ratio is now approaching a zone that has historically caused a supply shock effect in the market caused by long-term investors locking up a substantial portion of BTC. Over the next few months, the metric will have reached the upper bound of this SS range if its trajectory continues. The amount of supply in nominal BTC terms continues to reach all-time highs, increasing by 83,062 BTC (~$3.82B) this week. Note: this isn’t solely long-term holders buying coins this week, a lot of it is STHs aging past the 155-day threshold used to deem LTHs. Nonetheless, these coins are being locked up; for an in-depth view of all accumulation metrics see last week’s letter.
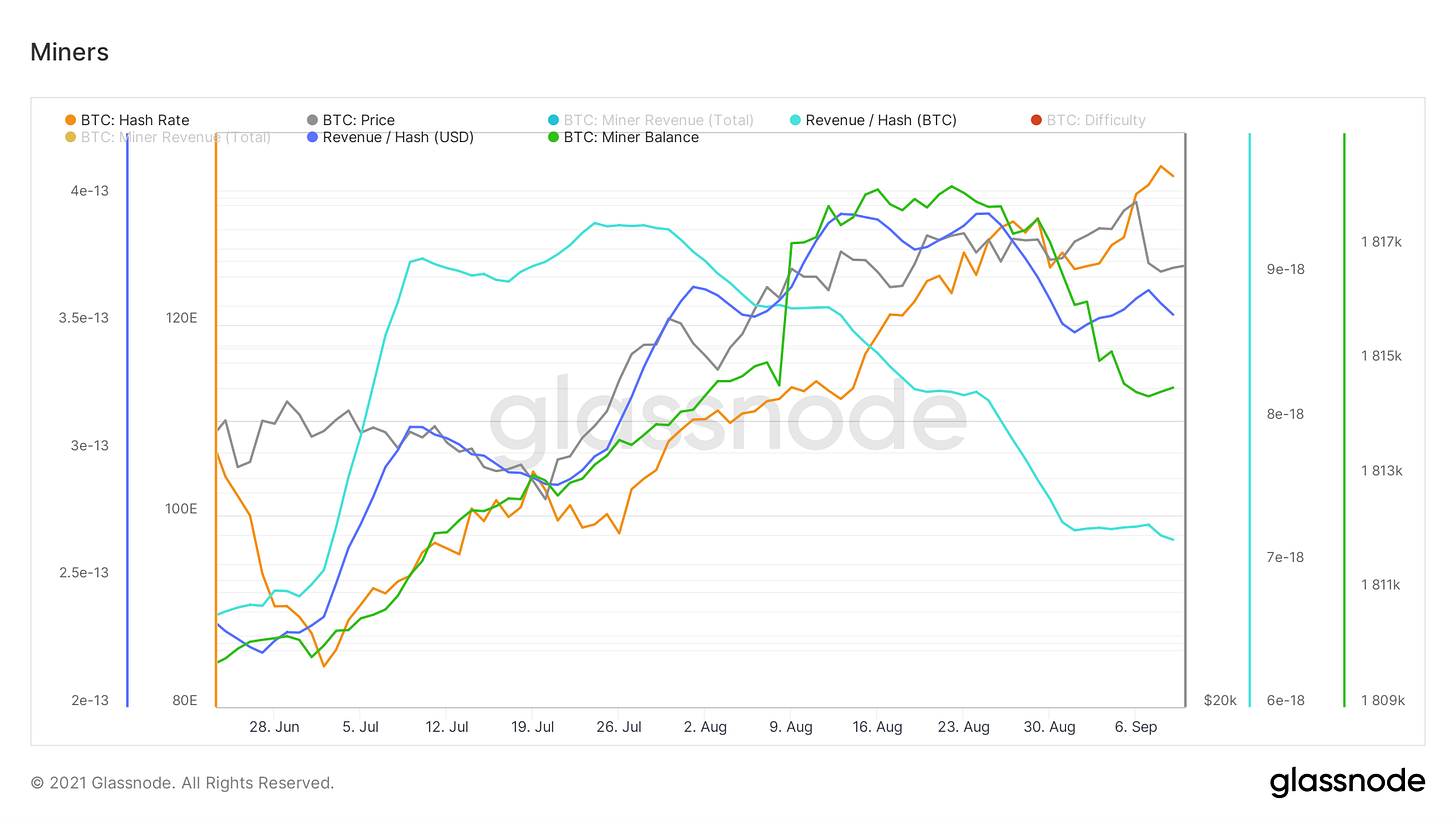
Lastly, we take a peek at what’s going on with miners. Hash continues to come back on the network, showing no signs of slowing down. As more competition for the same block reward comes online, miner revenue in BTC per hash has dropped. However, when denominating this in USD terms their revenue looks much stronger, because of the BTC price increase. Miners also continue to sell off, although nothing substantial. They’ve sold an additional 467 BTC this week according to Glassnode.
Bitcoin-related Equities (written by Blake Davis)
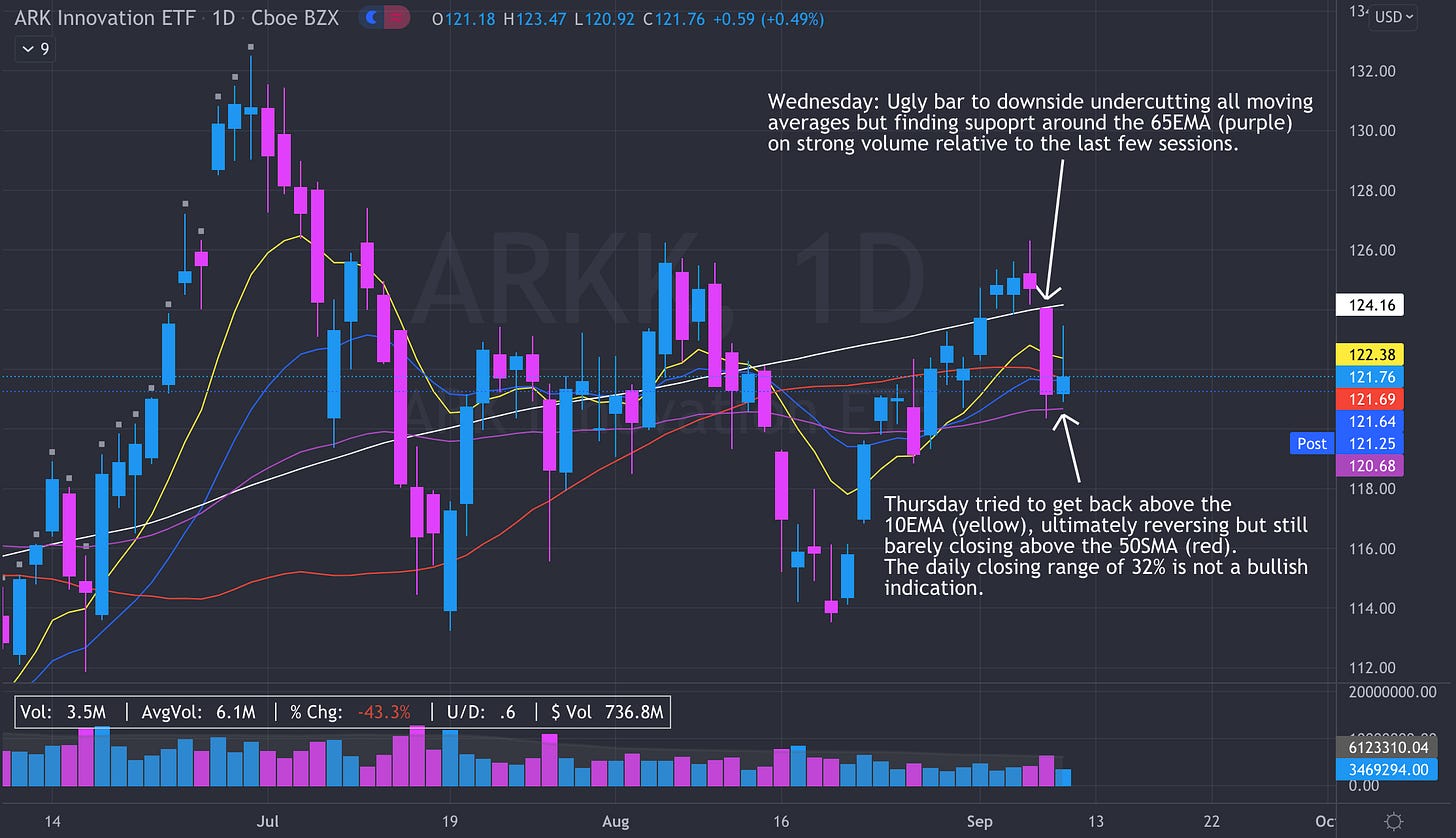
It has been quite the week for crypto and the general market, and it shows looking at charts of our crypto-exposed equities. Obviously, Bitcoin has been a big talking point this week with a $10,000 bar to the downside. As we’ve discussed here before, crypto-stocks are essentially high beta avenues of investing in Bitcoin, so when BTC has a bad day our stocks have just as bad, if not worse ones. One week of price action doesn’t change anything in terms of the potential these companies have to grow, and with the on-chain metrics showing signs that long-term holders are holding BTC, this is the time to take your eyes off crypto-stocks. What’s encouraging is how fast price can change sentiment in crypto, despite whales not selling their long-held coins. In order to have a bull run, you need to have a certain degree of bearishness. This is so that we can squeeze shorts but also so that there are people left to buy the asset. This is why we often see parabolic climax runs on the big volume before a stock tops (example MSFT Jan. 1992). There simply isn’t anyone left to buy it and support it higher at that level. If you scrolled through Twitter or watched financial news this week there was a lot of bearish talk about Bitcoin. People who think they understand, but don’t really understand, Bitcoin love to be bearish after the price falls. Bears are simply fuel for our crypto-stocks when BTC decides it’s ready to take off again. In terms of the general market, it is possible we’re going to need some time to form some bases but this is still to be determined. Lots of names have had huge runs the last couple of months and came down pretty fast earlier in the week. Thursday was a nice day with a lot of names finding support around moving averages. But this isn’t quite the signal for me to start deploying cash yet. In the markets, we’re trying to compound our money from levels that show us the best risk-to-reward ratio. Buying off moving averages is a common strategy that works for people looking to add to an existing position. Personally, I like buying on strength and adding at moving averages. But when the breadth of the market is falling with price, the most risk-averse play is to wait for prices to pass back over key levels to the upside before starting any new position. Here’s a daily chart of ARKK, an ETF of Arkk Invest’s Innovation Fund, that I like to use because it tells us more about what growth stocks are doing than the heavily weighted S&P or NASDAQ. In the short term, the trend is unclear which makes it hard to find an edge.
The stock market presents a handful of times a year where you can make serious money, but as of now, it doesn’t look to me like this one of those times. One of my favorite quotes from “Reminiscences of a Stock Operator” by Edwin Lefevre says “There is the plain fool, who does the wrong thing at all times everywhere, but there is the wall street fool, who thinks he must trade all the time.” But of course, what do I know, my opinion is irrelevant to the beast that is the financial markets. Anything can happen at any time so we have to stay on our toes, you have to be able to change your opinions if the price disagrees. Relative strength is the key to staying alive in the market. The strongest crypto stocks held up the best this week and the weakest fell apart. Positioning yourself to be in the strongest names requires a little work, but the benefits are clear. The strongest growth leaders in the market (DASH, U, NET DXCM, DDOG, DOCS, UPST to name a few) still look good. That’s the power of RS, but we have to keep in mind that there’s a lot of previous leaders who are falling apart. This big divergence, shown by looking at market breadth, isn’t good for the overall market. So sure, there’s money to be made in certain areas for the time being, but personally, I would rather wait until there’s a strong trend across the board. This is all personal preference, everyone has their own personal risk appetite. That is just my $0.02.


I can see extreme hard work behind. Thank for knowledge sharing
Will. What you are delivering at your age is simply awesome. A kid with a brain crunshing data as no one else and delivering very useful analysis. I am really impressed. A french fan (much older !!)