Blockware Intelligence Newsletter: Week 39
Bitcoin on-chain analysis, mining analysis, equity-analysis; overview of 5/20/22-5/27/22
Blockware Intelligence Sponsors
If you are interested in sponsoring Blockware Intelligence email: sponsor@blockwaresolutions.com.
FTX US - Buy Bitcoin, crypto, and now US stocks with lower fees on FTX. Use our referral code (Blockware1) and get 5% off trading fees.
Blockware Solutions (Mining) - It is difficult to buy ASICs, build large mining facilities, and source cheap scalable electricity all on your own. Work with a trusted partner like Blockware to deploy capital into Bitcoin mining.
Blockware Solutions (Staking) - Ethereum 2.0 is almost here, now is the time to stake your ETH with Blockware Solutions Staking as a Service to take advantage of 10-15% APR when the Ethereum network switches over to Proof of Stake.
Summary
Junk bonds have seen a sharp rally in the last week, a potential early indication that institutional appetite for risk-assets may be shifting back in a direction that benefits stocks and Bitcoin.
We take a look at 100 years of bear market data, to provide a framework for how a traditional bear market plays out.
Thursday was a follow-through day on the Nasdaq Composite, a signal that the index is staging a legitimate rally attempt. We also examine historical data for this relatively uncommon buy signal.
Bitcoin experienced a -4.3% downward difficulty adjustment, meaning mining a new block became easier for all miners.
General Market Update:
It’s been another volatile week in the equity markets (shocker), but we have seen a few bullish indications that have led to a short-term bottom. But more on that in a bit.
With the release of the FOMC minutes on Wednesday, we saw a strong uptick in algorithmic trading intraday and thus, volatility. Powell and committee members essentially said more of their usual, reiterating that we’ll continue to see 50bps interest rate hikes from future meetings.
An increased Fed funds rate (FFR) puts selling pressure on equities due to the most important relationship in finance: Rates ↑ = Bond Prices ↓
(Go back to last week’s newsletter for a more in-depth explanation on the effect bond prices have on stock prices)
That being said, the stock market is a forward-looking pricing mechanism that discounts the future. What I mean by this is that the stock market nearly instantly prices in expectations about the future as they occur.
The market indexes are NOT a representation of the current state of the economy. They instead tend to look roughly 6-12 months into the future to discount what investors believe will occur.
This is where the saying “Buy the rumor, sell the news” comes from. Insiders or traders who are expecting a big announcement, strong earnings, changing monetary policy, etc. position themselves accordingly, well before that news hits the market. By the time that the news actually arrives, those who are late to the game essentially become exit liquidity as the early investors sell their positions.
This is an example of how the market is forward looking. And the same can go for the inverse of “Sell the rumor, buy the news”.
It’s no secret that the Fed is going to continue to increase the FFR, they’ve been talking about it since September 2021. And the fact that there’s historically high inflation and rising commodity prices is also common knowledge.
So now that the market has had plenty of time to price this in, it’s not that the market can’t bounce until the economy is fixed, it’s just a question of how long it will take for stocks to price this in.
Stocks don’t bounce because of the economy, they bounce because people are buying them. Therefore, the stock market always bottoms before the economy because eventually, we’ll reach a point where most of those who are going to sell stocks due to macroeconomic fears already have. Only then do we bottom.
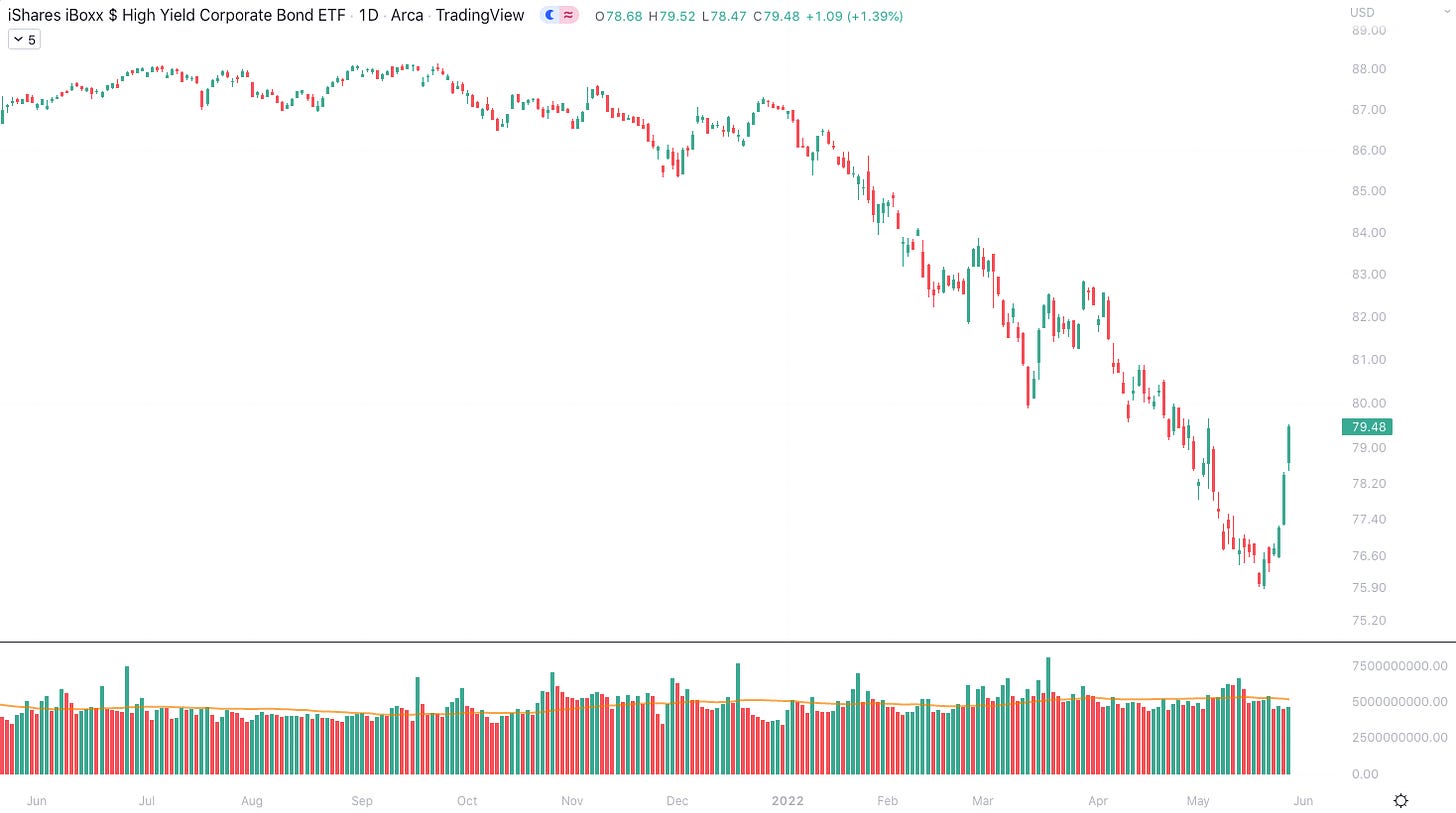
Last week we talked about bond spreads and compared the prices of junk bonds to that of lower-maturity Treasury bonds. Since then, the junk bond ETF, HYG, has had a very strong week.
HYG 1D (Tradingview)
As of Thursday’s close, HYG is up 4.76% from its lows, the largest increase in these bond’s prices since their September 2021 top (notice how that aligned with the initial talks from the Fed to increase the FFR).
If you don’t recall, junk bonds are the riskiest subset of bonds. Just as their sell off last year was an early signal of an incoming derisking period for institutions, seeing a fairly strong bid for these securities this week could be an early signal of a returning appetite for risk assets.
This move is most likely to just be a bear market rally for junk bonds, but it’s absolutely something to monitor.
This week I created an Excel table which breaks down some data from every bear market in the S&P 500’s history. Before I discuss this I should note that formulating investing decisions based on averages and medians is generally a losing game.
Notice above how large the standard deviations of this data set are. A standard deviation shows us how varied the data points are in comparison to the mean (average). A large standard deviation means the data points are very dispersed.
This just proves the point that every market cycle is different. Assuming that one will behave a certain way due to an historical average will lead to disappointment. History doesn’t repeat itself, it rhymes.
But I do believe that there is value in learning from this data. It represents the framework that bear markets traditionally have tended to take and can help build your mindset for what to expect in the future.
So now, notice that the median bear market lasts for 355 days after falling 33.5%. As of today, it has been 143 days since the S&P topped on January 4th, and the index has fallen 20.93% (peak to trough) since then.
Furthermore, I went through and counted how many times the index attempted to rally higher during that bear market, using a price increase of 10% as the benchmark for what I’m considering a formidable rally attempt and not just a small bounce.
What you can see above is that the median S&P bear market has one rally of greater than 10%, not including the rally off the bottom. The average bear market had two.
So how can this data actually help us as investors and traders?
Because your median bear market lasts almost a full calendar year, falls over 30%, and includes at least one significant rally attempt, investors need to be PATIENT. It can be difficult to not dive back in at the first sign of green after months of red, but history tells us that good things come to those who wait.
This doesn’t mean the S&P needs to make new highs before we start buying, it just means that it would be wise to wait until we see legitimate buy signals from the indexes before getting too aggressive.
Hedge fund manager Jim Roppel once said, “You don’t have to be first to make a fortune”.
Moving on, as I alluded to in the intro, the market has flashed some bullish signals this week. Junk bonds being bought is one thing, but bond prices are secondary indicators in the equity markets. Only stock prices allow us to truly gauge what’s going on in the stock market.
The last couple of weeks the indexes essentially went sideways, but in that time several stocks were able to stage breakouts that have, so far, managed to stick. These breakouts largely came from the oil and energy sectors in names like: SD, EQT, CRK, HP and AR, to name a few.
An easy way to think about stocks and market trends is to think about them like a fish swimming in a river. When we’re in a bull market, and the water is pushing everything upstream, most stocks will go with the trend higher. In a bear market, the momentum pushes most stocks lower, or downstream.
In a bear market, there will be a few very strong fish, or high relative strength stocks, who will try to swim upstream with all their might despite the water pushing downstream. These stocks tend to go sideways while the market is going down.
Then you’ll have periods where the current pauses, and the indexes go sideways. Instead of following suit, those strongest stocks will be able to swim higher. That’s what we saw this week.
In general, it is a good sign to see some things working. Capital deployed into parts of the equity market can potentially bleed into other industry groups as confidence returns.
That being said, we are absolutely still in a bear market, likely still building out the left side of this base. The primary trend is down which means we are much more likely to see people selling/shorting into strength than buying it.
But we’ve been long overdue for a relief rally. On Thursday we saw a clear signal from the Nasdaq Composite that says the indexes are ready to stage a rally attempt. This signal is called a follow-through day (FTD).
A FTD can only occur under a very specific set of conditions. First, the index (can be the Dow, S&P or Nasdaq) must be at least 4 days off a bottom. Thursday was day 4 on the S&P, NSDQ and Dow.
Then, on day 4 or beyond, we need a day where the index is up at least 1.50% on volume that’s larger than the previous day, even by 1 share.
A follow-through day is a clear indication that the market is ATTEMPTING to create a new uptrend. It DOES NOT mean that the bear market or correction is 100% over. The saying goes, “Not every follow-through day starts a bull market, but every bull market starts with a follow-through day”.
In fact, if we look at previous bear markets you can see that, in general, it takes a few FTD attempts before one finally sticks.
Above you can see FTD data from the 4 bear markets of the 21st century. 2020 was a rare exception in that the first FTD was the one that stuck.
But when we look at the median values for these FTD’s, we can see that for those that didn’t work, the index still managed to gain more than 6% over 8.5 days before topping and creating another leg down.
The median value for how long it took each follow-through day to fail was 37.5 days. This means it took that amount of time for the index to undercut the low that the FTD followed.
So in summary, seeing a FTD is never a guarantee, but it clearly is a signal of a rally attempt underway. In the last 22 years, only once (11/4/08) did the FTD occur on a top. Every other time it was followed by at least a 1 day rally, but the median rally after is 8.5 days.
Crypto-Exposed Equities
Like Frankenstein rising from the dead, we finally saw a bit of life returning to the crypto-exposed equity group on Thursday.
The big reversal that Bitcoin staged, combined with a strong day of price action for the Nasdaq, helped to drag some of these names higher. While it is still too early in my book to be too excited, it’s nice to be able to talk about strength instead of my usual doom and gloom.
While Thursday was strong for most of these names, there are a few which stood out to me from a price structure perspective.
MSTR 1D (Tradingview)
Yesterday, Microstrategy staged an oops reversal to close up over 9% on the day. An oops reversal occurs when a stock gaps below the previous day’s low but then reverses to close inside that day’s range. In this case, MSTR really showed off its strength by creating a candle that fully engulfed Wednesday’s range and broke a shorter-term upper trendline.
Aside from this huge reversal, MSTR stands out due to the fact that its Thursday low was over 31% higher than its YTD low from May 12th. This is in comparison to 10.24% for Bitcoin, 16.65% for SI, 11.04% for CLSK, and 11.40% for IREN. Names like RIOT, HUT, HIVE and BITF were lower than their 5/12 low yesterday.
Coinbase is the other name that really stands out to me from this group. The Thursday low for COIN was actually 52.58% higher than its May 12th lows. This is a strong signal of strength from a name who is now down nearly 82% off its April 2021 direct listing price.
A few other names who are standouts to me this week are: CIFR, SDIG, EBON, CLSK, and BKKT.
We should note that all of these names have a ton of overhead supply, which will make increases in price run into serious resistance. Overhead supply stems from the fact that you’ll have investors who bought this stock much higher and held onto those shares to the bottom.
When prices start to increase, these people will likely start selling in order to get out at a price that’s much closer to breakeven, after being deep in the red for months. This creates a steady flow of supply leaving these stocks if they attempt to recover their massive losses.
As always, here is our table comparing the weekly performance of several crypto-native equities to the group average, Bitcoin and the mining ETF WGMI.
For my trading and technical analysis youtube series this week, I created a video covering the crypto-exposed equity industry group and discussed things like: why is there demand for crypto-equities, how do crypto-equities perform compared to Bitcoin, how can we valuate public miners, and broke down an example of identifying periods of relative strength for crypto-stocks in comparison to Bitcoin.
Check out the video here if you’re interested.
Bitcoin price action, on-chain, and derivatives
Bitcoin now sits 57% down from its all-time high in November of last year.
This rapid decline has translated to one of the biggest drawdowns in monthly returns for the asset class in its history.
Bitcoin has been essentially just been ranging for the entirety of the last 2 weeks, currently retesting the lower bound for the second time in the last few days.
As we’ve discussed over the last few weeks, don’t find it attractive to trade lower time frames in this environment and find it much more conducive to keep a high time frame view from a physical and mental capital preservation standpoint in this environment. The goal of this letter has always been to try and aid strategic allocators rather than short-term traders.
With that in mind, not much has changed in the HTF view we’ve laid out throughout the past few letters; therefore apologies for being somewhat repetitive.
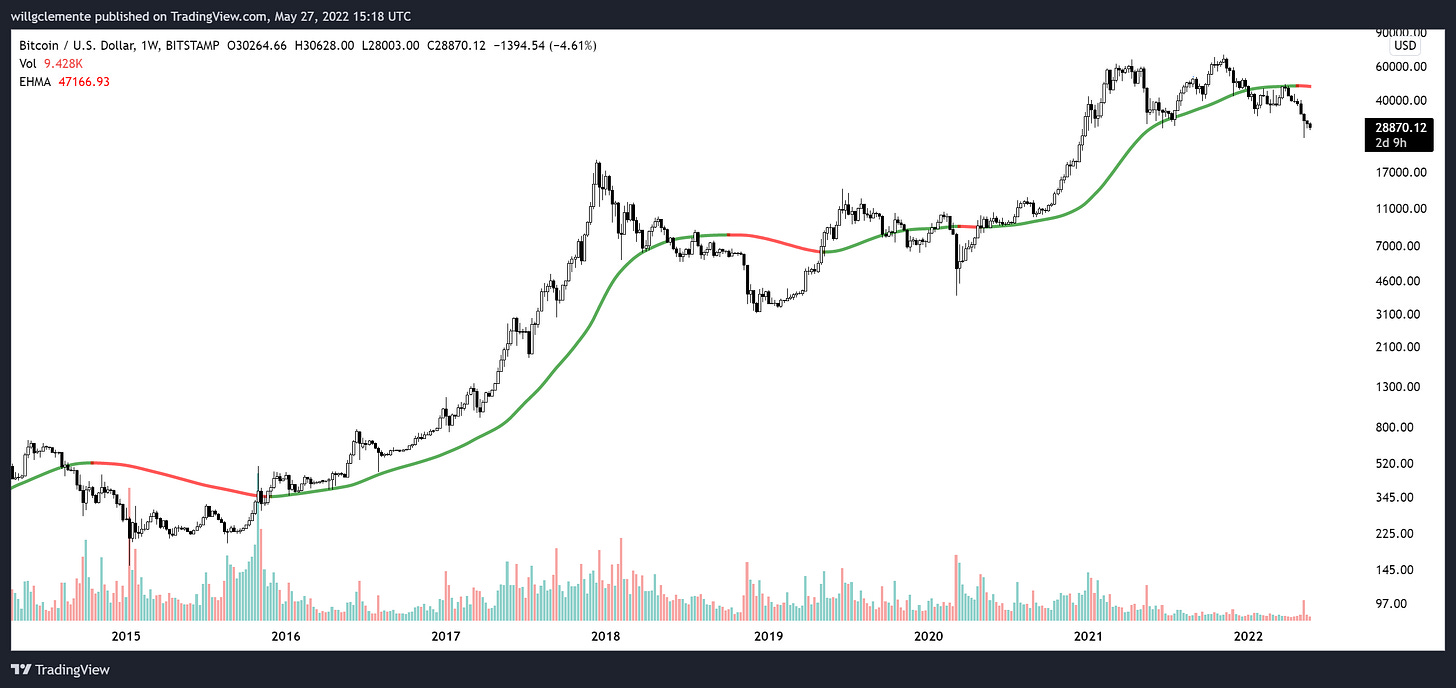
We see momentum as >$47K. This is based on a confluence of factors from both an on-chain and technical perspective listed below.
Firstly, the 180-week exponential hull moving average, a moving average with more weighting to recent price action. When green the moving average is increasing, when red it is declining. This has served as a good HTF momentum tool.
This currently sits at $47,166.
Next, the 2022 yearly open, which sits at $46,200.
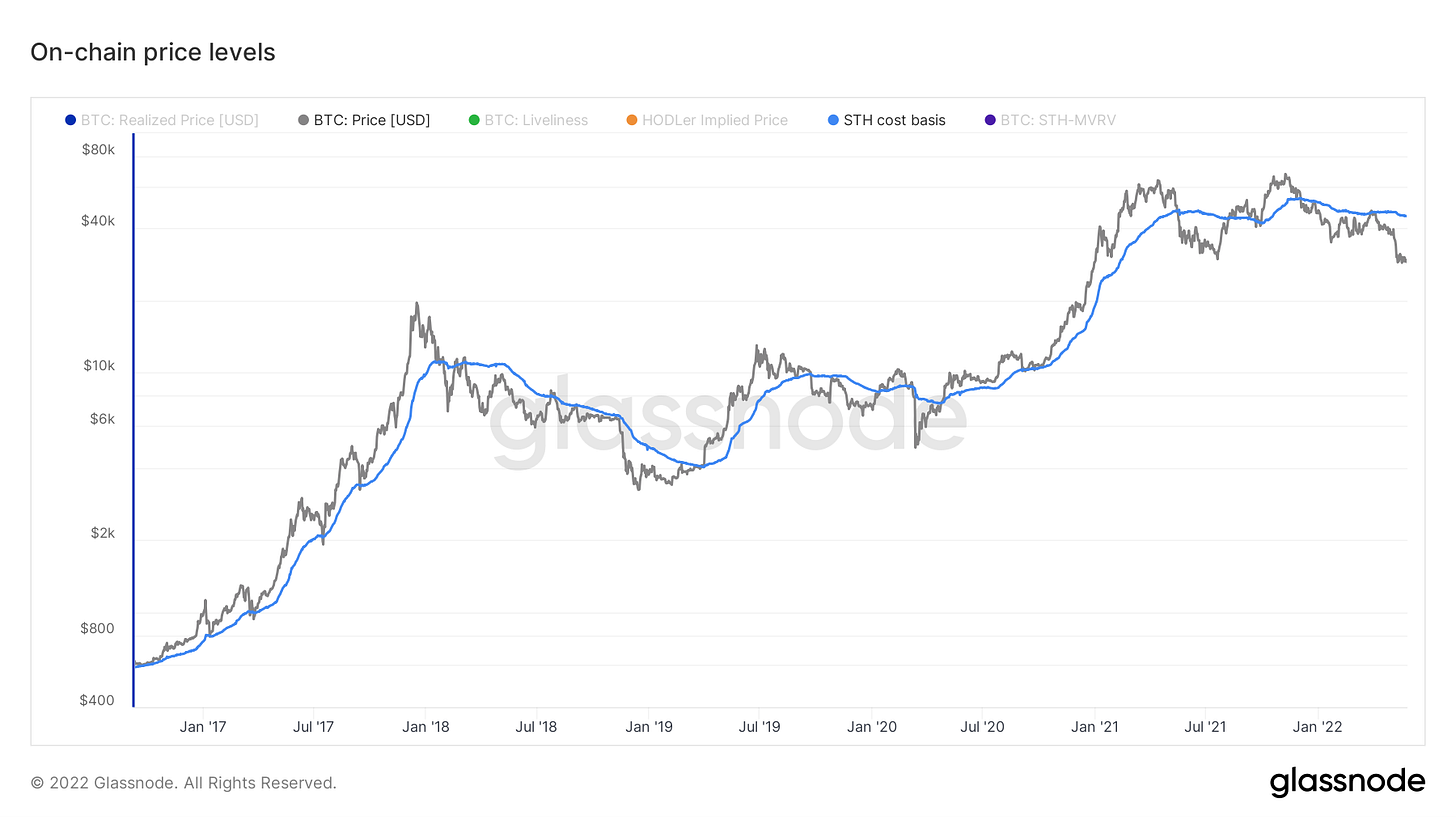
Next, the short-term holder cost basis. This is the aggregated cost basis of all entities on-chain who have been in the market for less than 155 days.
This currently sits at $45,038.
We still view extreme value for BTC as $22K-$24K. This is based on a variety of factors as well.
Firstly, realized price; the aggregated cost basis of all entities on-chain. This currently sits at roughly $24,000. Historically whenever market price has gone below realized price, it has served as a great buying opportunity. This is in partial because by definition the market is underwater in aggregate.
Comparing realized price to market price, we get MVRV ratio. Whenever market price pushes below realized the oscillator enters the green zone at the bottom of the chart which has market generational buy opportunities.
Next we have the mayer multiple, which compares the current market price to the 200-day moving average. This is near some of the lowest readings on record.
Next, we look at the price temperature bands created by analyst Dilution Proof. This measures the number of standard deviations of market price from the 4-year trend. The lower bound currently sits just above $21K.
Similarly, here is the 200-week average, one of the most widely known historical areas Bitcoin has cyclically bottomed. This currently sits just above $21K as well.
And last on the value framework, the 180-month exponential hull moving average; currently sitting at $20,400. I also like this chart because as mentioned, the indicator is green when the MA increases. With this in mind the monthly momentum of BTC is up only over the long term.
And lastly for sake of the word limit on the newsletter, one of the most interesting trends I’ve noted is the Asian premium to EU and US trading hours that has persisted for several weeks now. This is notable because based on this it appears Asia has dominated the market for the last 2 years.
Bitcoin Mining
-4.3% Downward Difficulty Adjustment
Bitcoin has a truly unique innovation: proof of work mining combined with a mining difficulty adjustment. As more hash rate (mining machines) joins the network, difficulty rises so the supply distribution schedule remains intact.
On Wednesday, Bitcoin saw a -4.3% decrease in mining difficulty. This means blocks were coming in a bit slower than 10 minutes on average and the network automatically decreased mining difficulty as it sensed that hash rate may be dropping off the network.
It’s too early to tell if this is the start of any sort of miner capitulation (likely no), but if the price of Bitcoin does continue to take a beating, then we can expect older generation mining rigs to start being turned off.
All content is for informational purposes only. This Blockware Intelligence Newsletter is of a general nature and does consider or address any individual circumstances and is not investment advice, nor should it be construed in any way as tax, accounting, legal, business, financial or regulatory advice. You should seek independent legal and financial advice, including advice as to tax consequences, before making any investment decision.


How should we interpret that final "Asia Premium" graph? Is this to say that Asia was more aggressively buying the lows and selling the highs? And the fact that they've ramped up buying again implies that we may be at a low?