Turn Your Taxes Into Bitcoin
Live Webinar • Tuesday, July 21 • 2:00 PM ET
Join the Blockware team for a live session on how Bitcoin miners and Section 168 bonus depreciation can transform the way you manage your taxes, your finances, and your assets.
• How to turn your tax bill into Bitcoin
• Section 168 bonus depreciation, explained
• Live Q&A — bring your questions
• Plus: a special guest you won’t want to miss…
We’re keeping the guest under wraps for now — but if you’re serious about Bitcoin and building wealth, you’ll want to be in the room when we introduce them.
Sign up here: https://mining.blockwaresolutions.com/webinar
Short-Term Holder Realized Price
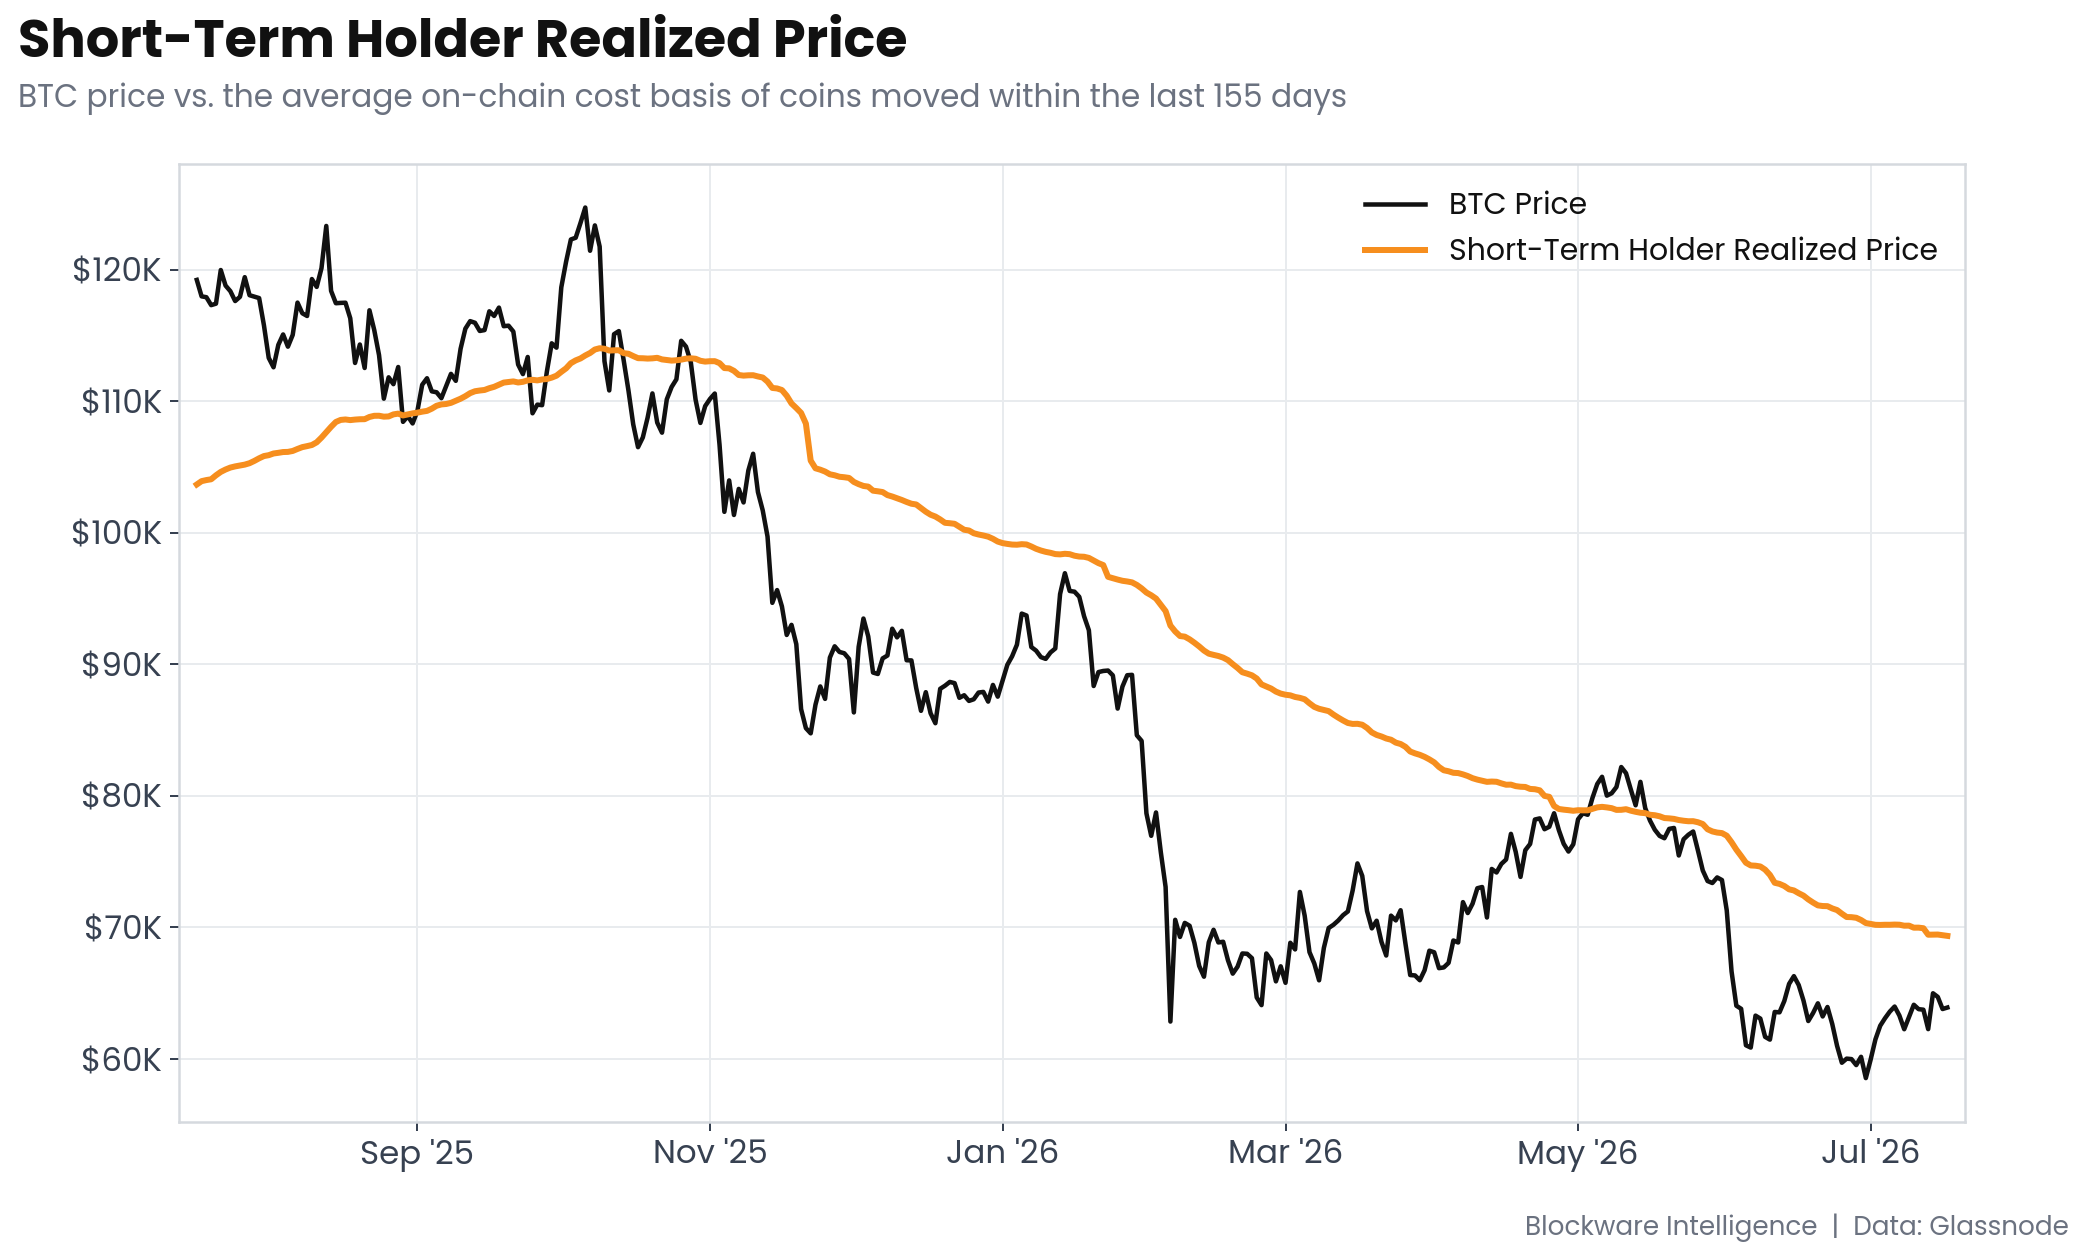
Short-Term Holder Realized Price is Bitcoin’s most important near-term level. STH-RP sits at roughly $69,400 while spot trades near $64,000, a gap of about 8%. This is the aggregate cost basis of every coin that moved in the past 155 days, so it marks the exact price where the marginal buyer of the past five months breaks even. In bear phases it acts as resistance because underwater holders sell into strength to recover their capital. STH-RP has been grinding lower all year while price has chopped sideways since the February low, so the two lines are converging. On the current trajectory a retest lands in late August. A clean break and hold above would flip the average recent buyer back into profit and go a long way toward confirming $60K as a double bottom.
Long-Term Holder Supply
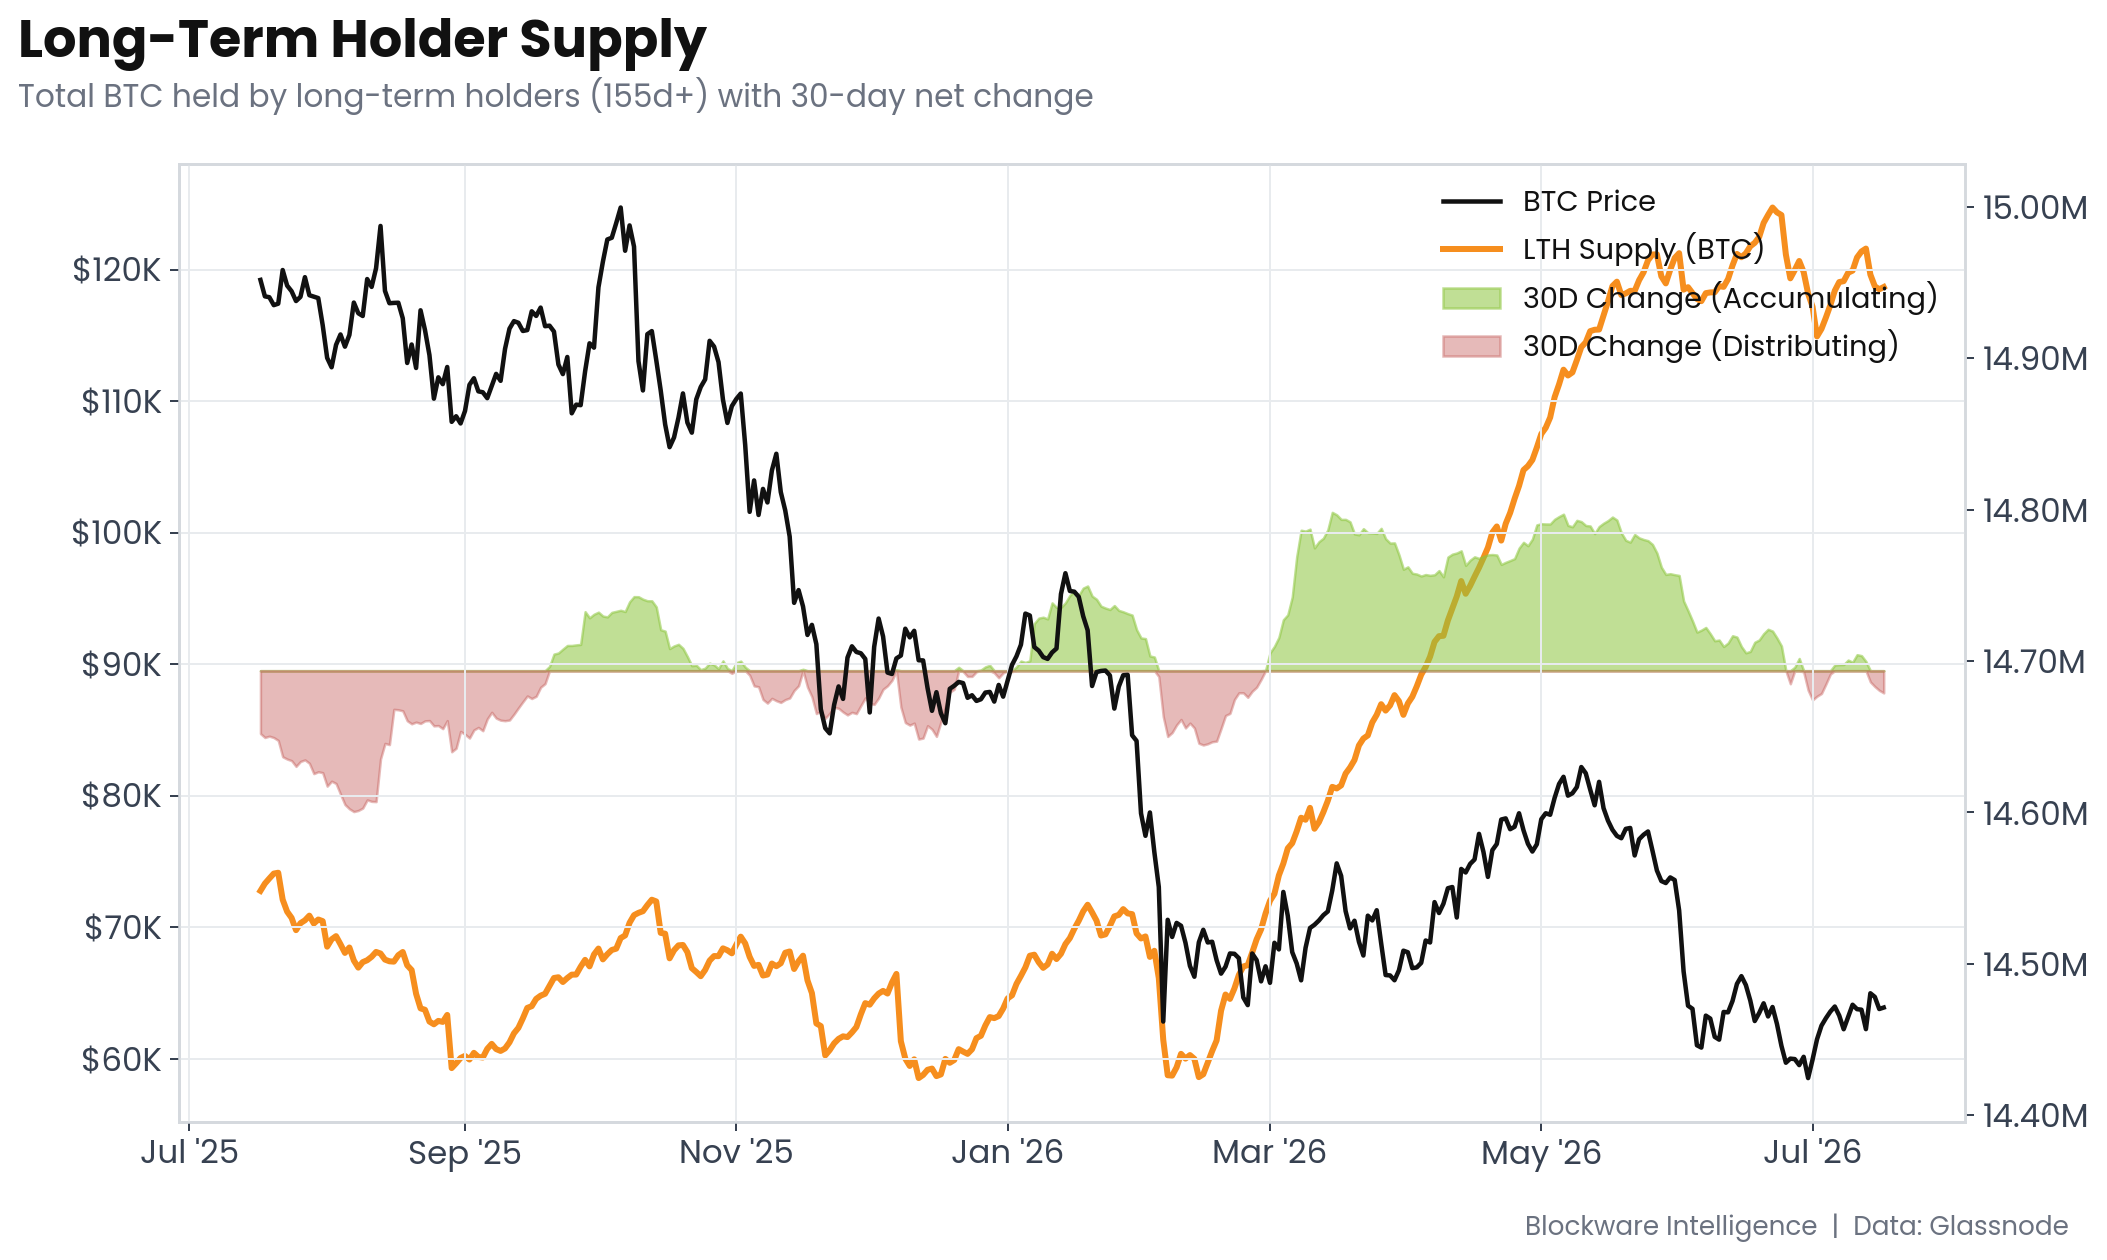
Long-Term Holder Supply spent Q1 and most of Q2 climbing aggressively, rising from roughly 14.43M BTC at the February low to a peak of 15.0M on June 22. That kind of accumulation pulls supply off the market and is exactly how price floors get built. Since the move back into the low $60,000s, however, the bid has cooled. The 30-day change in LTH Supply flipped negative on June 25 and currently sits at roughly -27,000 BTC. This is mild distribution, not aggressive selling, but it does mean the foundation building of the past two quarters is on pause. Watching for LTH Supply to resume its uptrend is one of the cleanest confirmation signals that the bottoming process is intact.
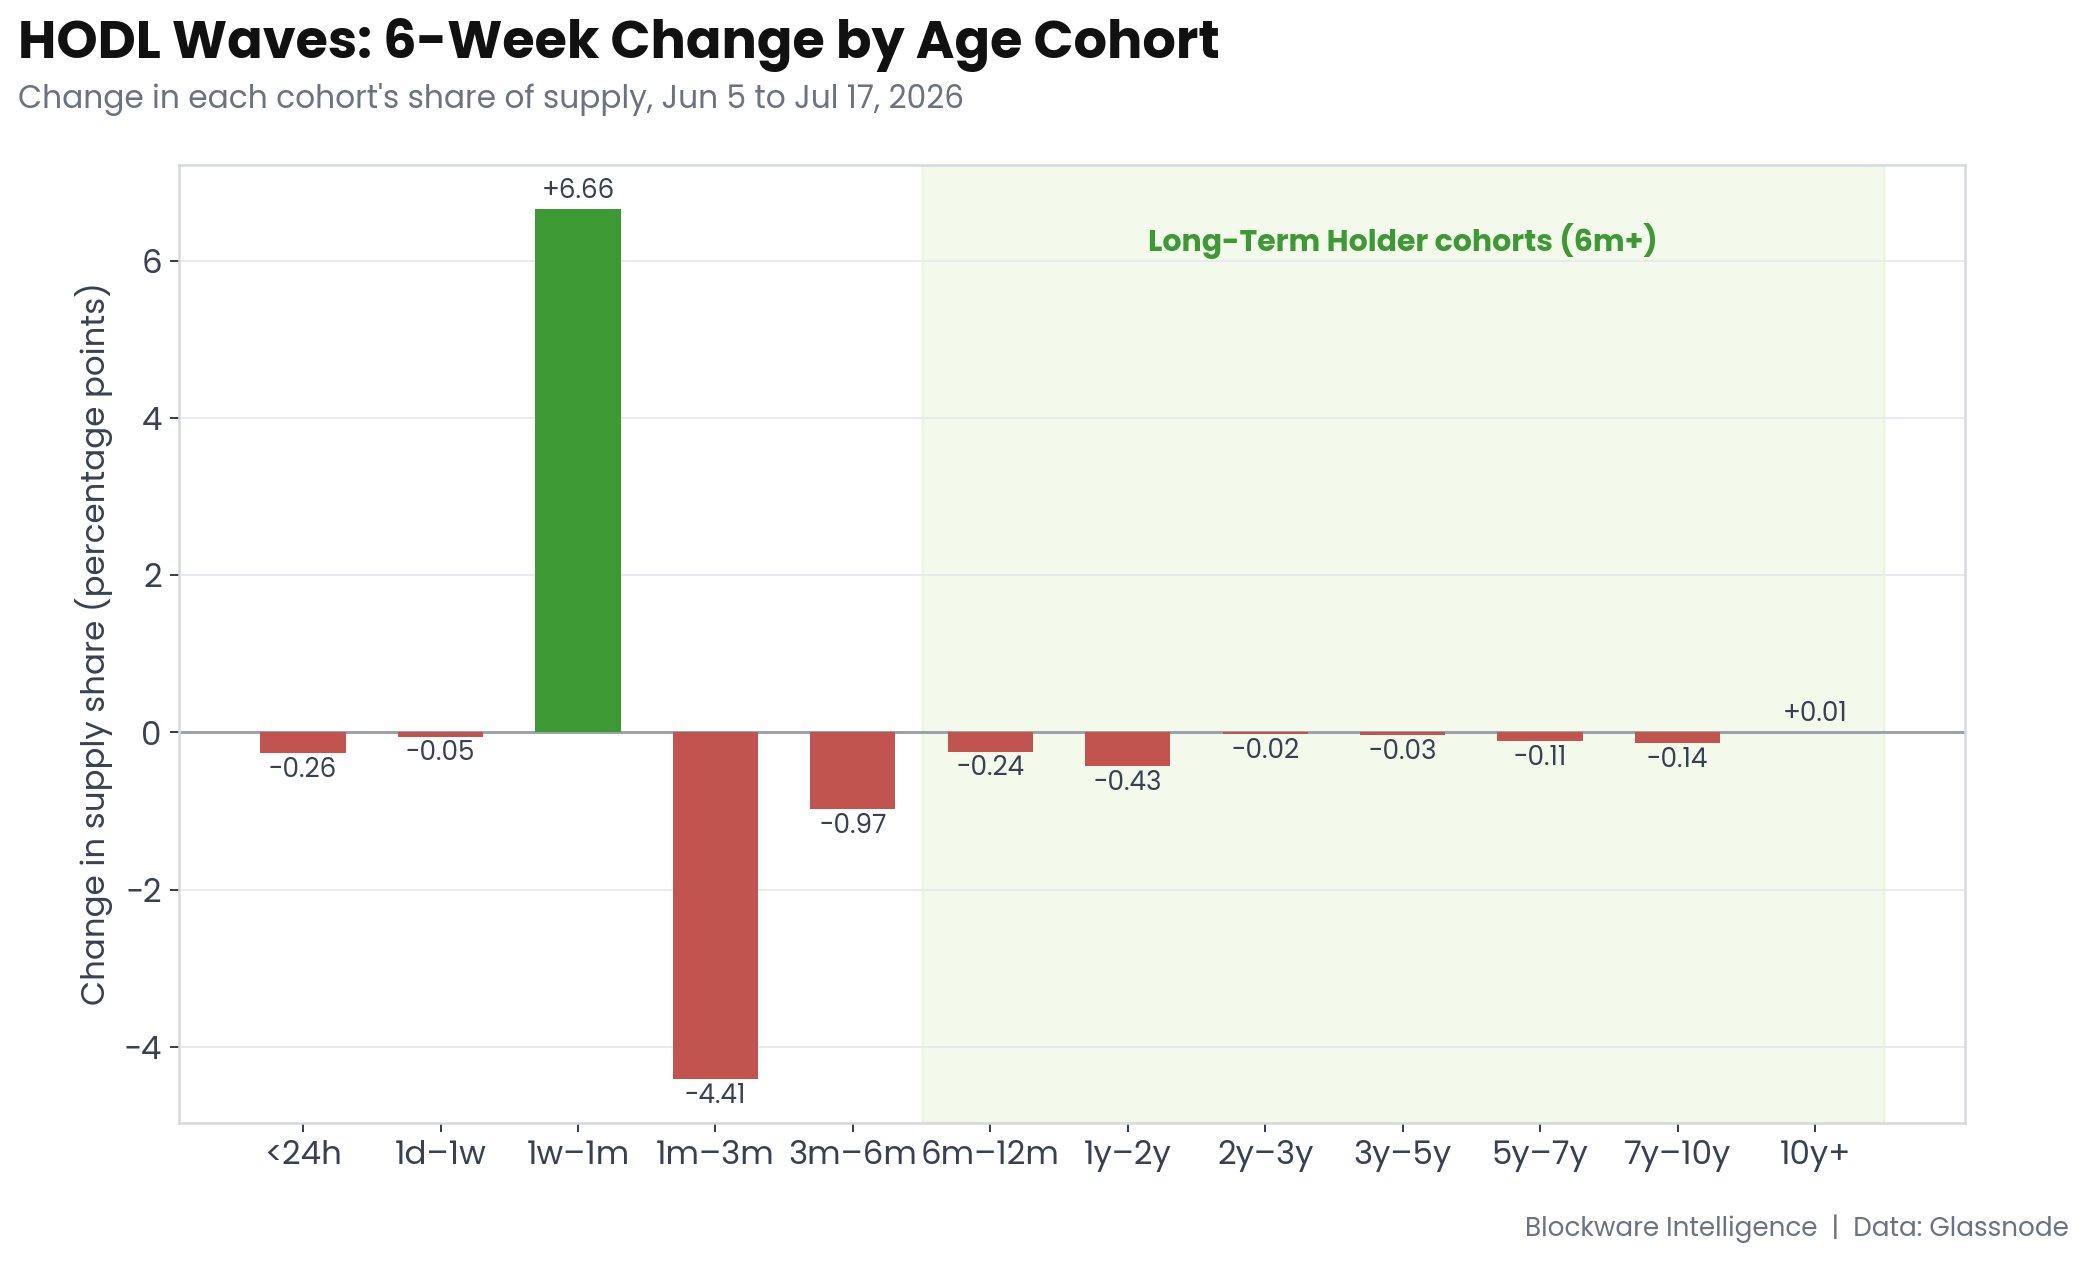
HODL Waves: Where the LTH Stagnation Is Coming From
The 1m–3m cohort collapsed from 6.1% to 1.6% of supply over the past six weeks, and that band represents every coin that moved hands between mid-April and mid-July. Those are the local-top buyers, the ones who accumulated all the way up from the low $60,000s into the strength toward $80,000 and beyond. They capitulated. The coins they bought are now in different hands at lower prices. Meanwhile the 1w–1m band exploded from 2.4% to 9.1% in the same window, meaning fresh buyers are constantly rotating in and out on shorter timescales instead of holding.
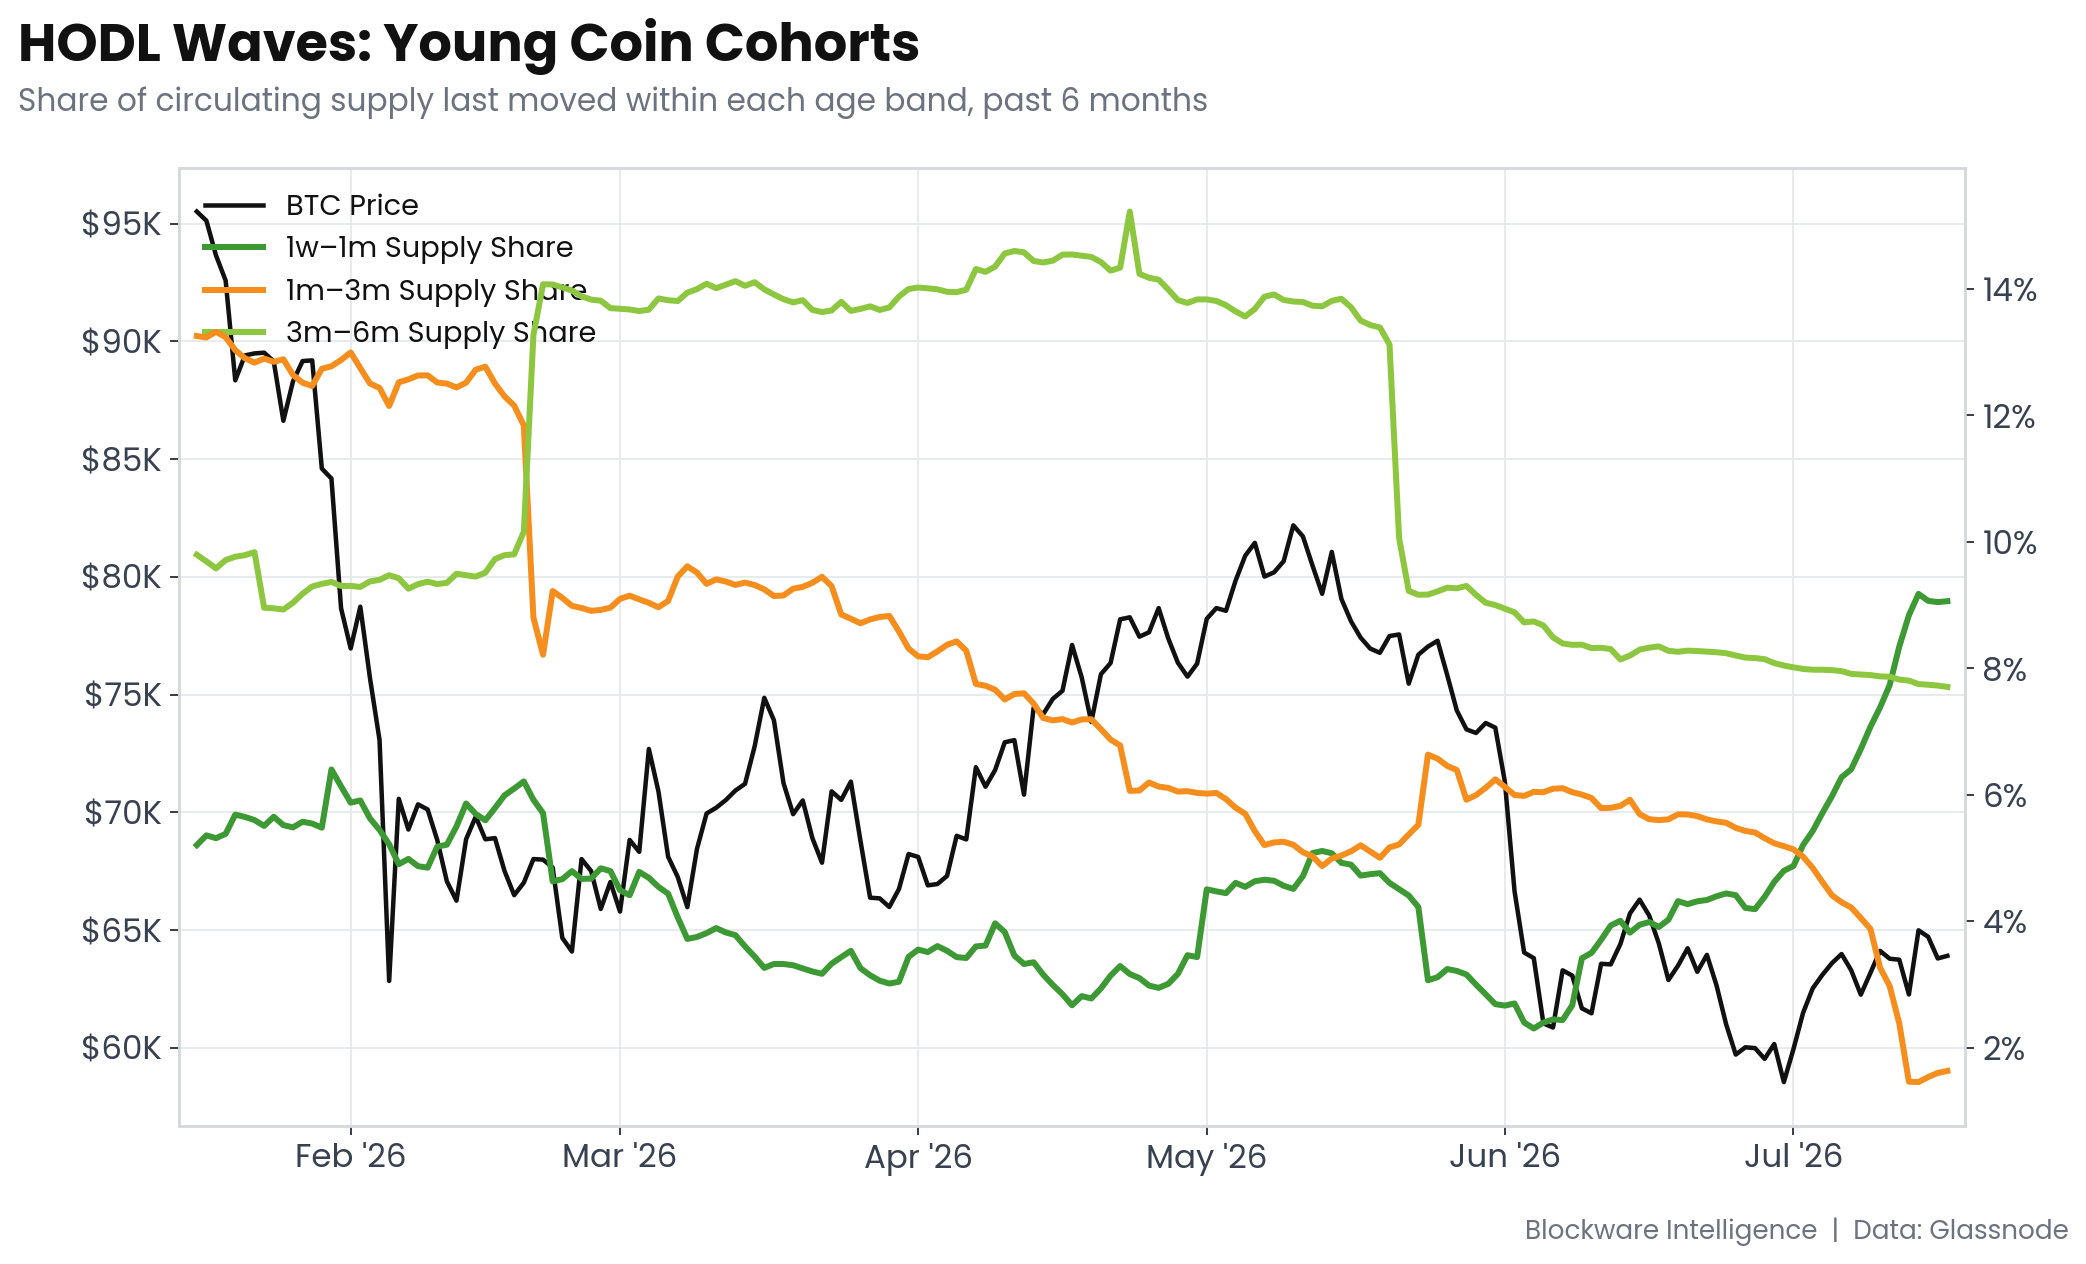
Here’s the key: coins that should be aging into the 3m–6m band, 6m–1y band, and beyond are getting trapped and recycled back into young hands instead of maturing into long-term supply. The pipeline is blocked. The long-term supply stagnation isn’t long-term holders dumping as much as it is short term cohorts not “graduating” into the long-term cohort anymore. The feeder bands below it are collapsing and re-spending instead of aging. Old hands remain dormant. This is capitulation by the recent relief rally cohort starving the long-term supply pipeline, not structural LTH selling.
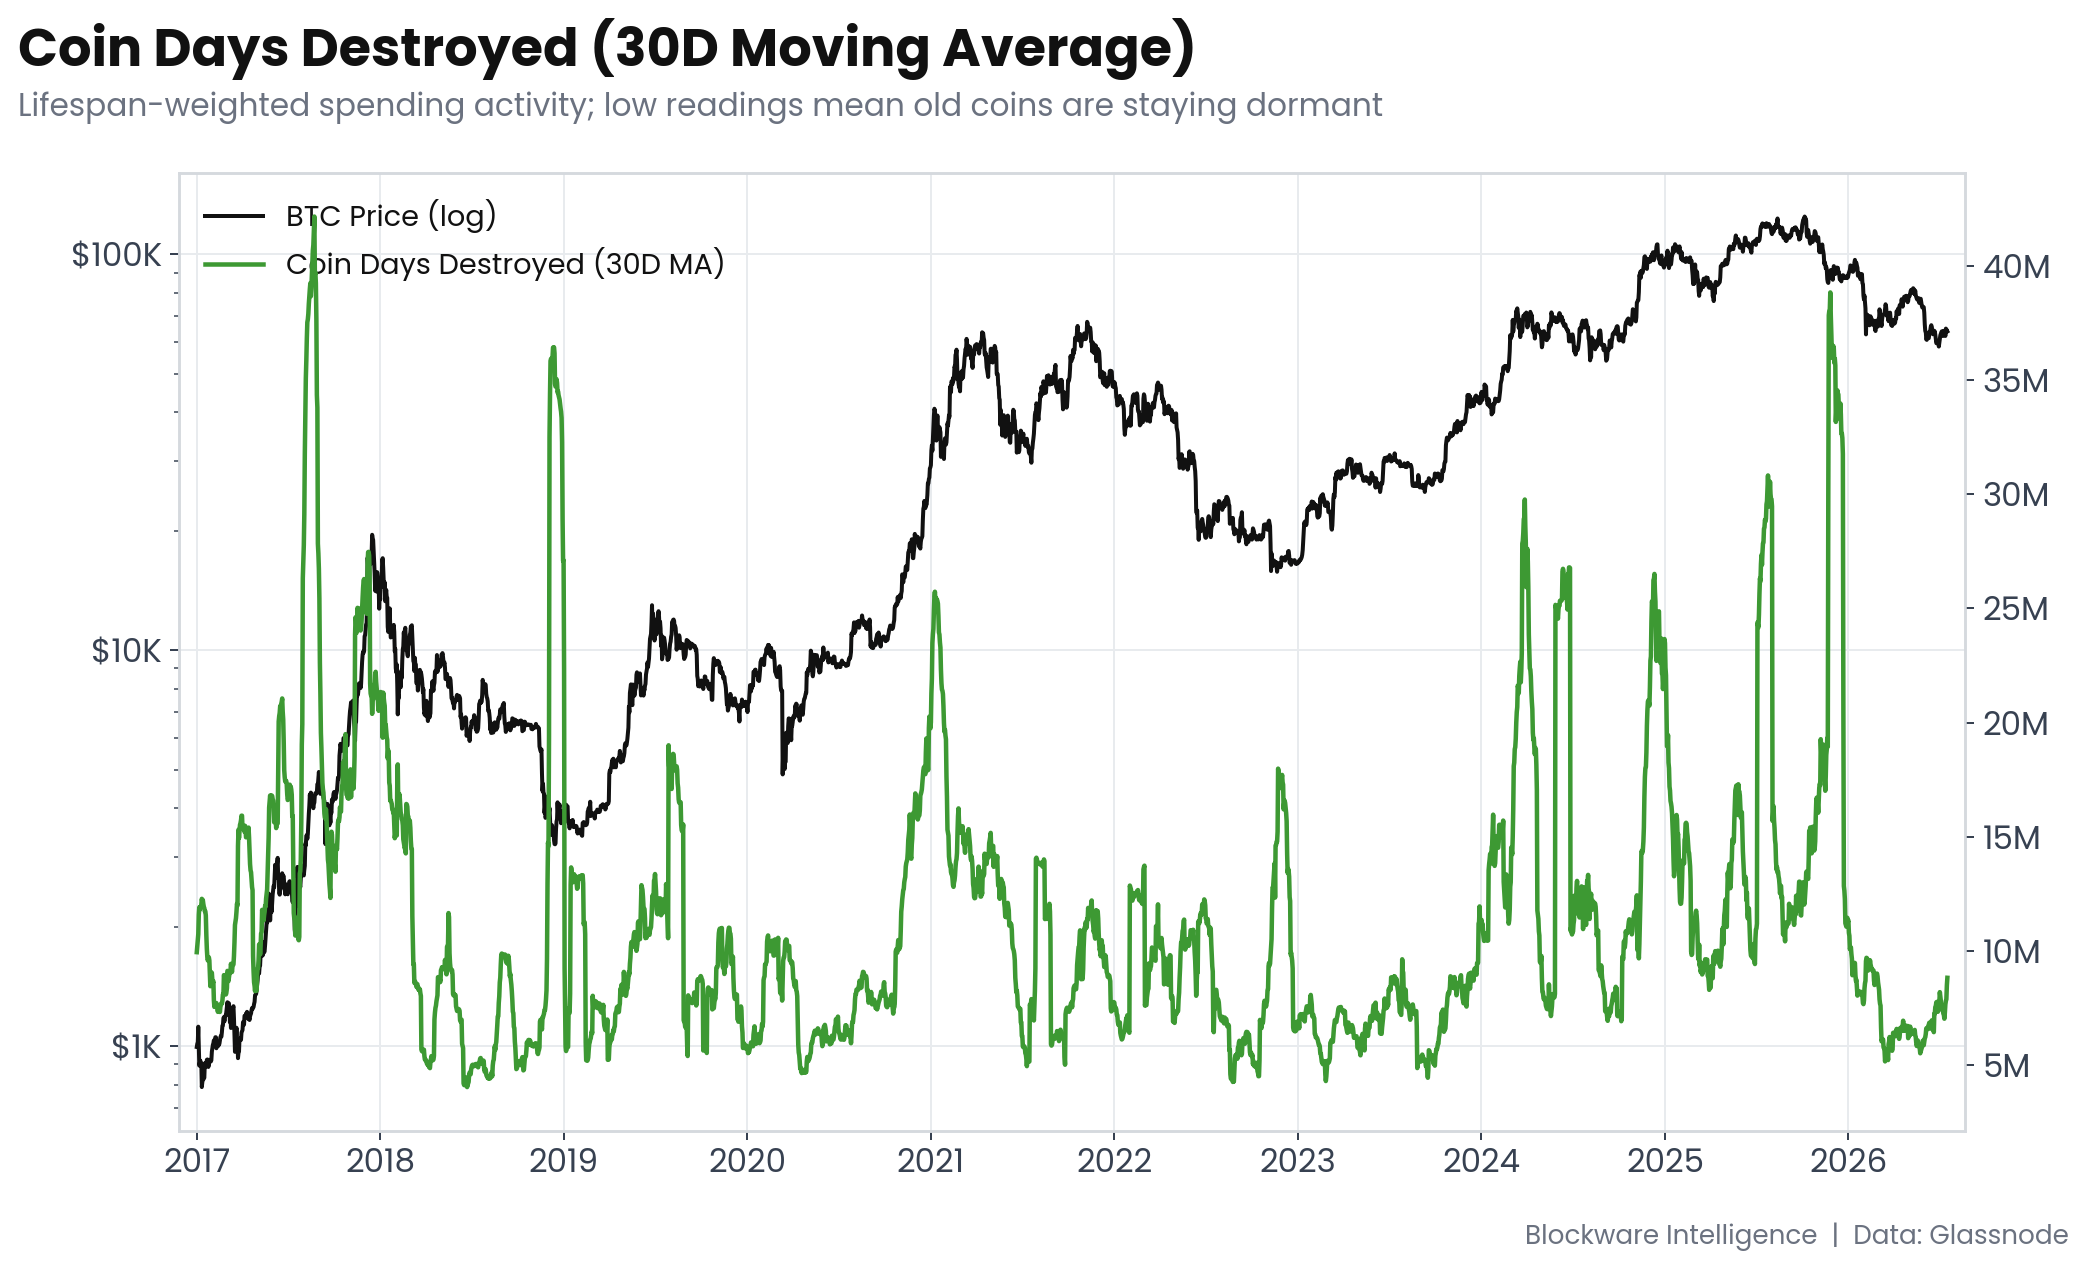
Coin Days Destroyed (30D Moving Average)
Coin Days Destroyed sits at roughly 8.8M on a 30-day basis, up meaningfully from the March low of 5.2M but still only around the 45th percentile of the past five years. CDD weights every spent coin by how long it sat dormant, so low readings mean old supply is staying put. The recent uptrend deserves context before anyone reads it as smart money exiting. Network activity is at record levels, which mechanically lifts CDD even when the age profile of spent coins stays young, and the HODL Waves confirm that bands older than one year barely moved over the past six weeks. Rising CDD here reflects more total activity, not old coins waking up. That distinction matters. Genuine old-coin awakening this deep into a drawdown would be a red flag. Broad activity growth with dormant elders is neutral to constructive.
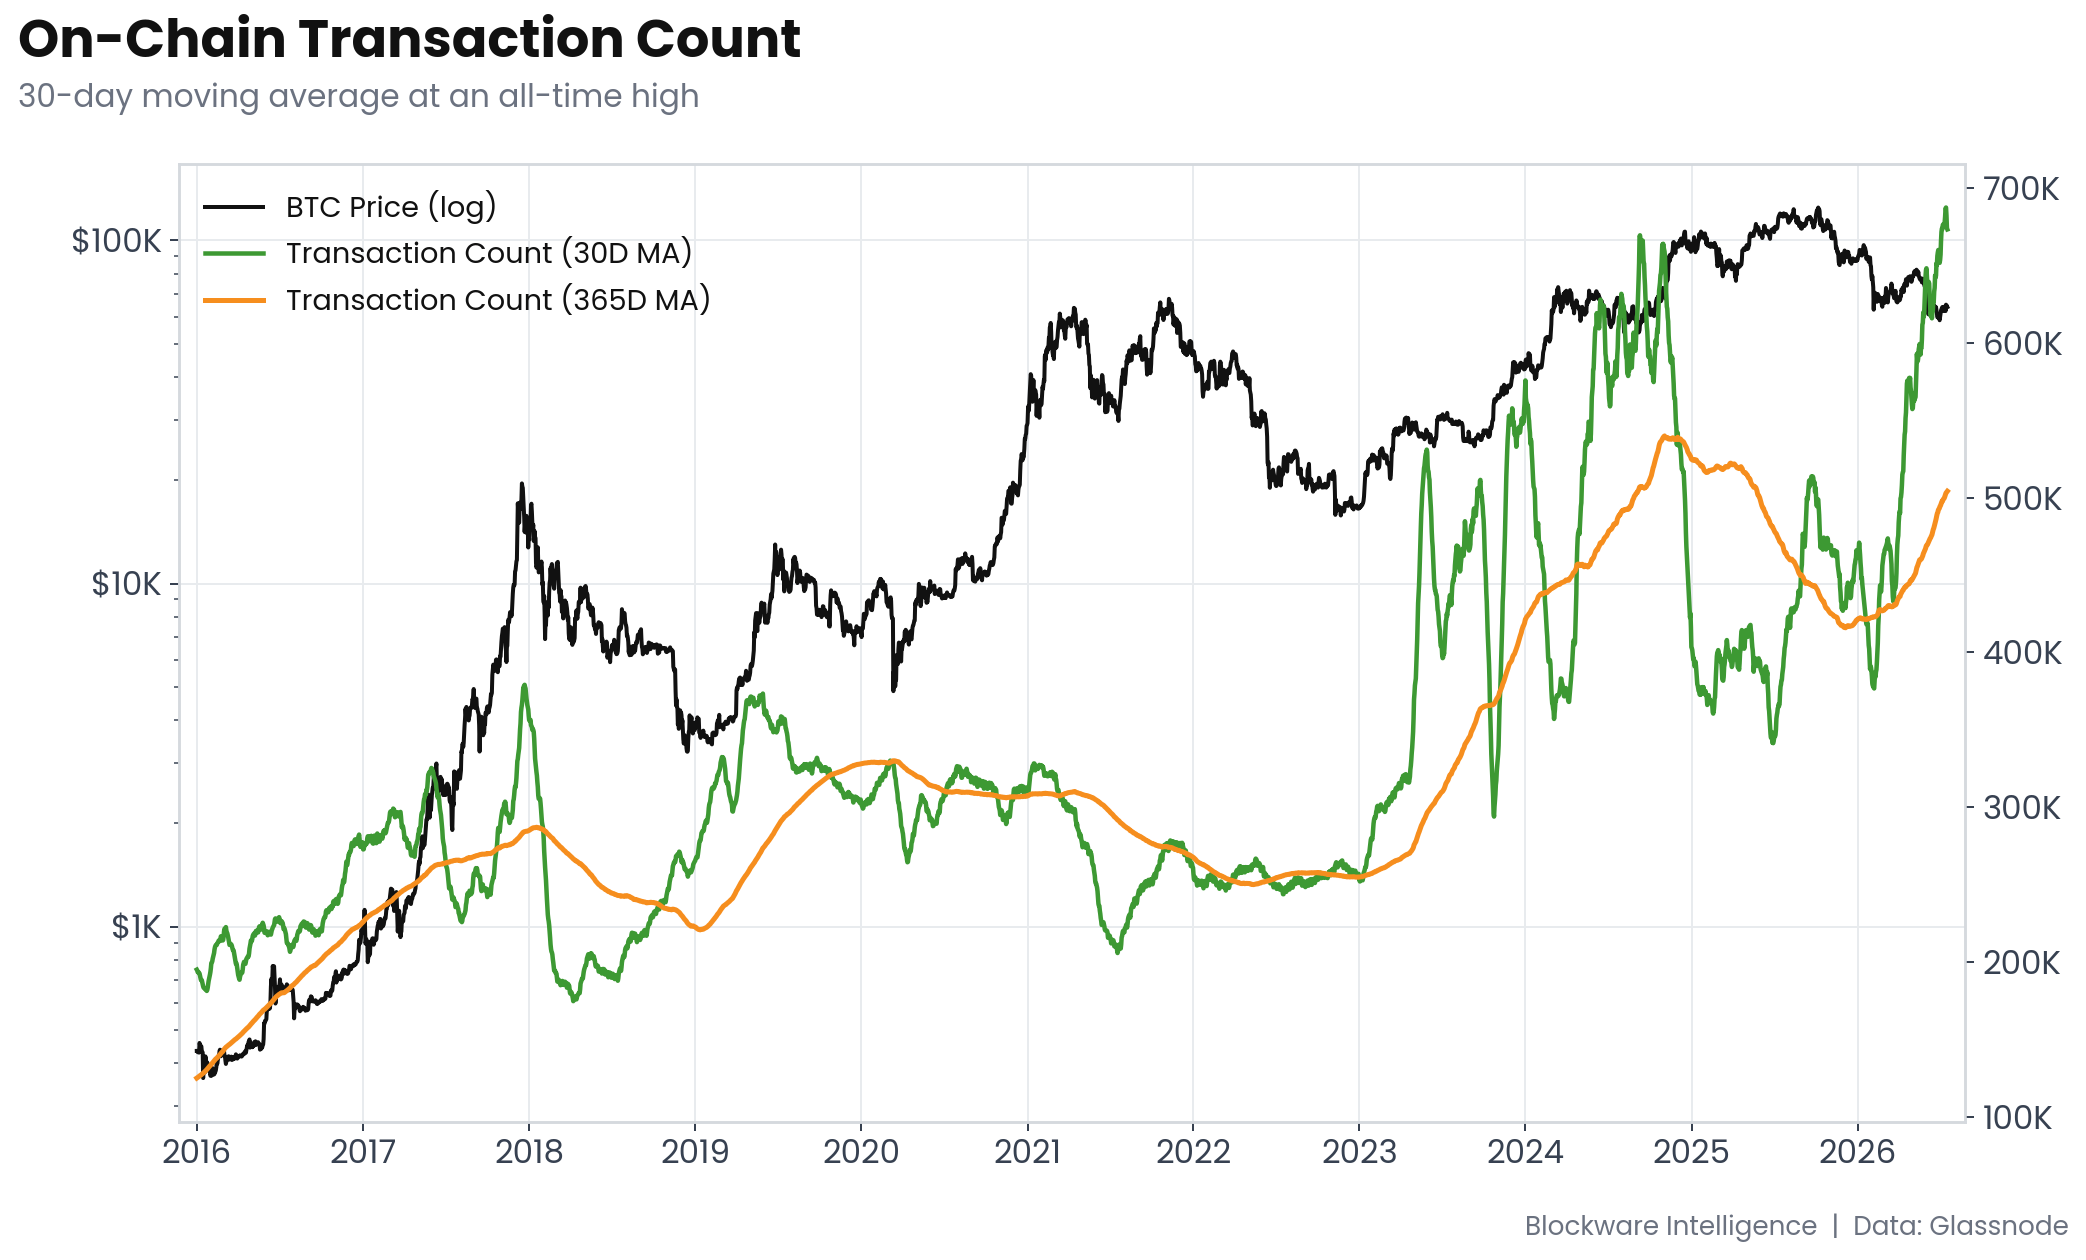
On-Chain Transaction Count at All-Time Highs
The 30-day moving average of daily transactions printed a record ~687,000 on July 14, up more than 90% year over year, and the monthly average has climbed every single month of 2026. This explains why CDD is drifting higher without any movement from older cohorts.
As for what’s catalyzing this surge in on-chain transaction count… that’s difficulty to say quite frankly. However, a surge in on-chain activity did coincide with the relief rally off the 2022 bottom.
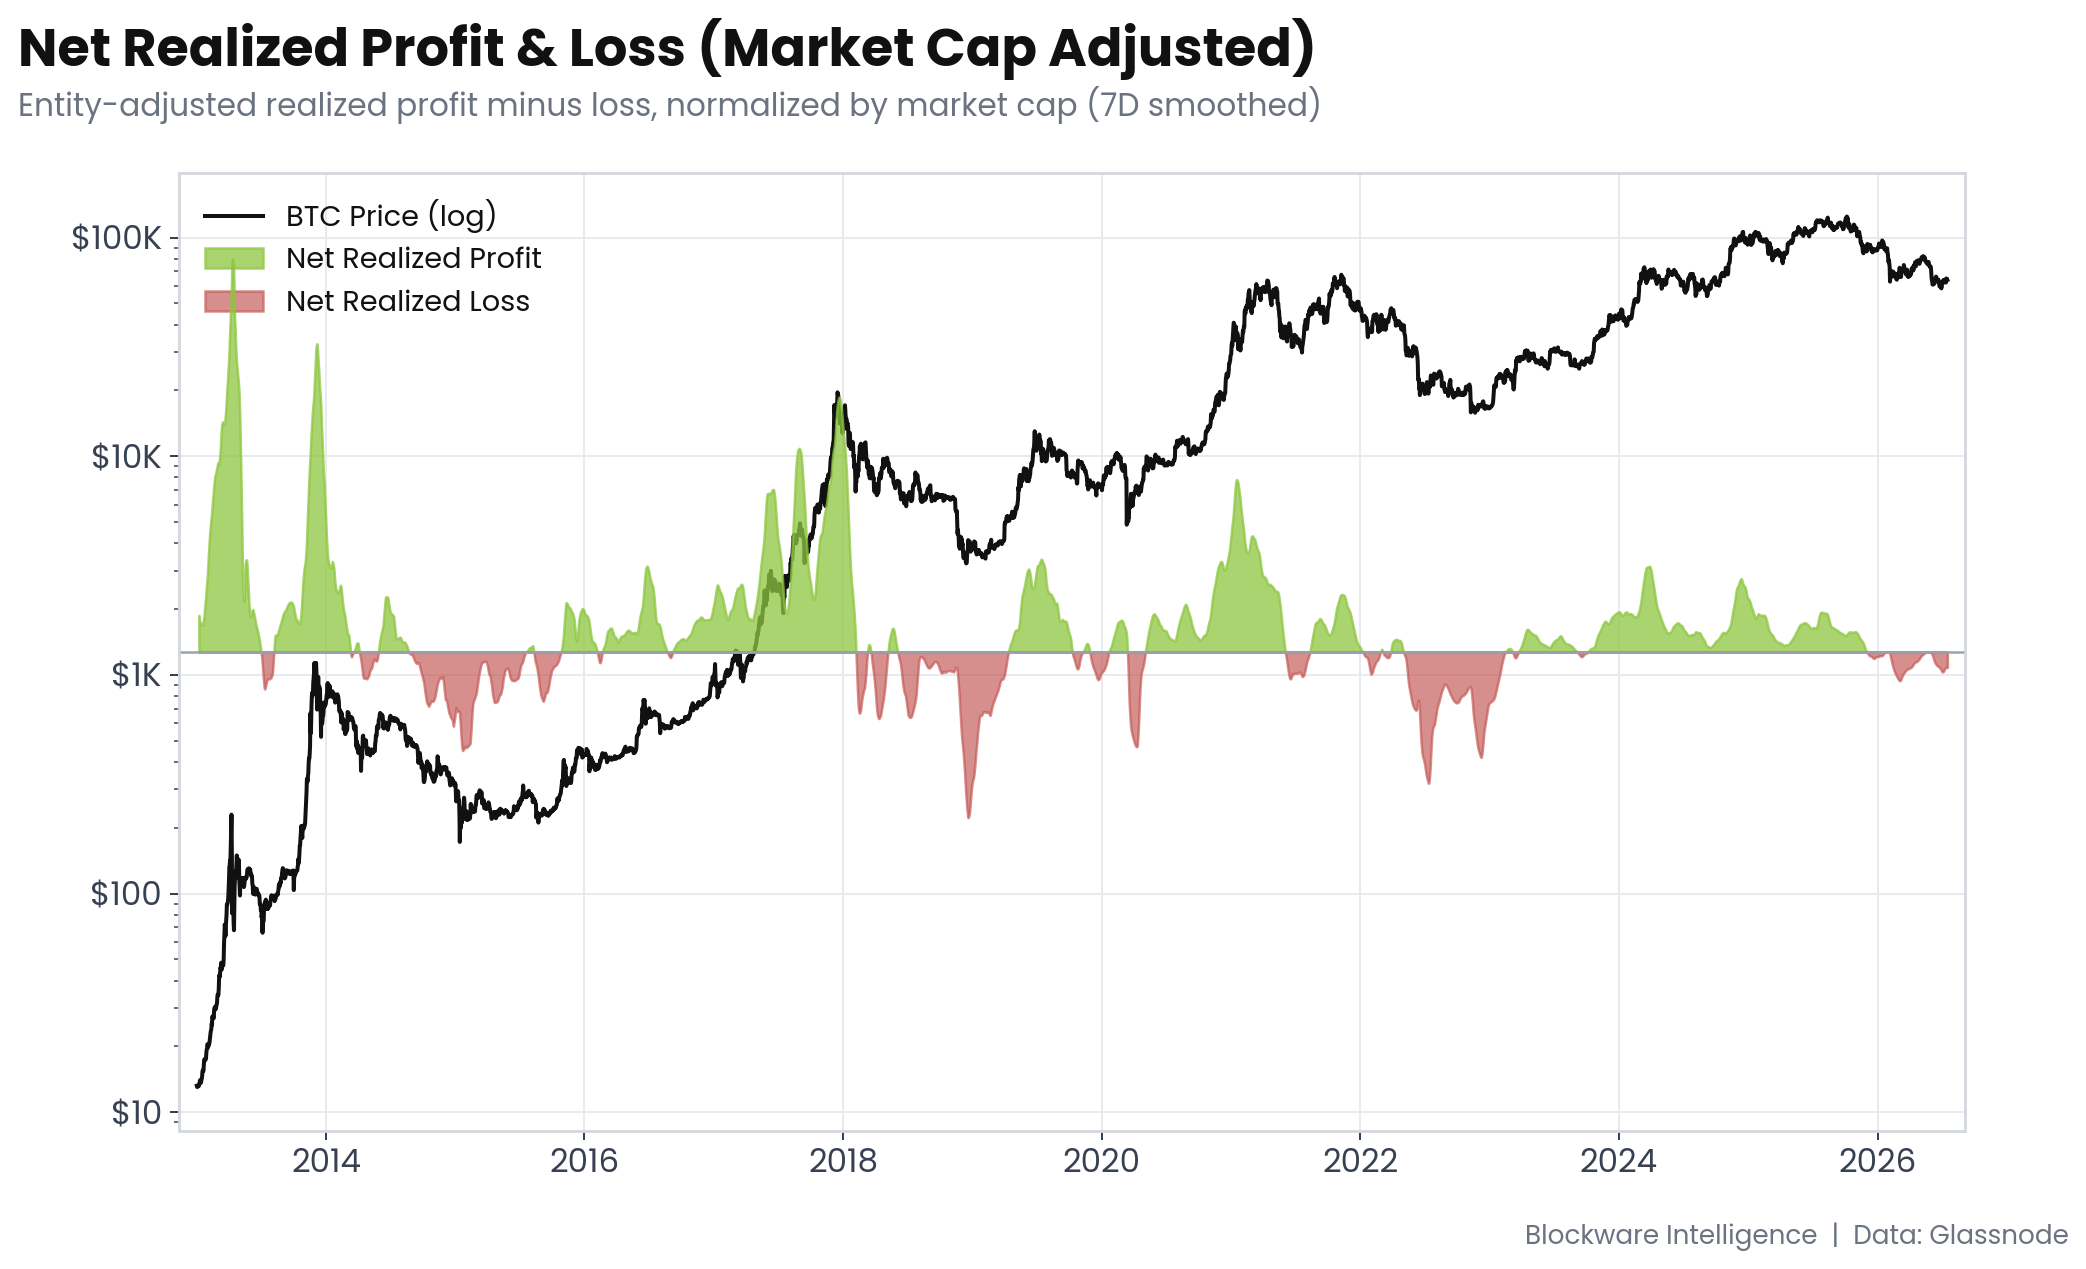
Net Realized Profit & Loss (Market Cap Adjusted)
Net Realized P&L remains in a regime of net losses, meaning the average coin moving on-chain is being spent below its cost basis. The current regime began in late November 2025, and 222 of the 290 days since have printed net realized losses. Prior bears required substantially more pain before the regime flipped for good. The 2014-2015 bear logged 474 total days below zero, including an unbroken 333-day streak. The 2018-2019 bear logged 384 total days with a 314-day streak. The 2022 bear logged 347 total days with a 287-day streak. Call it 350 to 475 days of cumulative loss realization in a typical bear. At 222 days, this market is past the halfway mark of a normal capitulation phase but history suggests a few more months of loss-dominated conditions before a durable regime change.
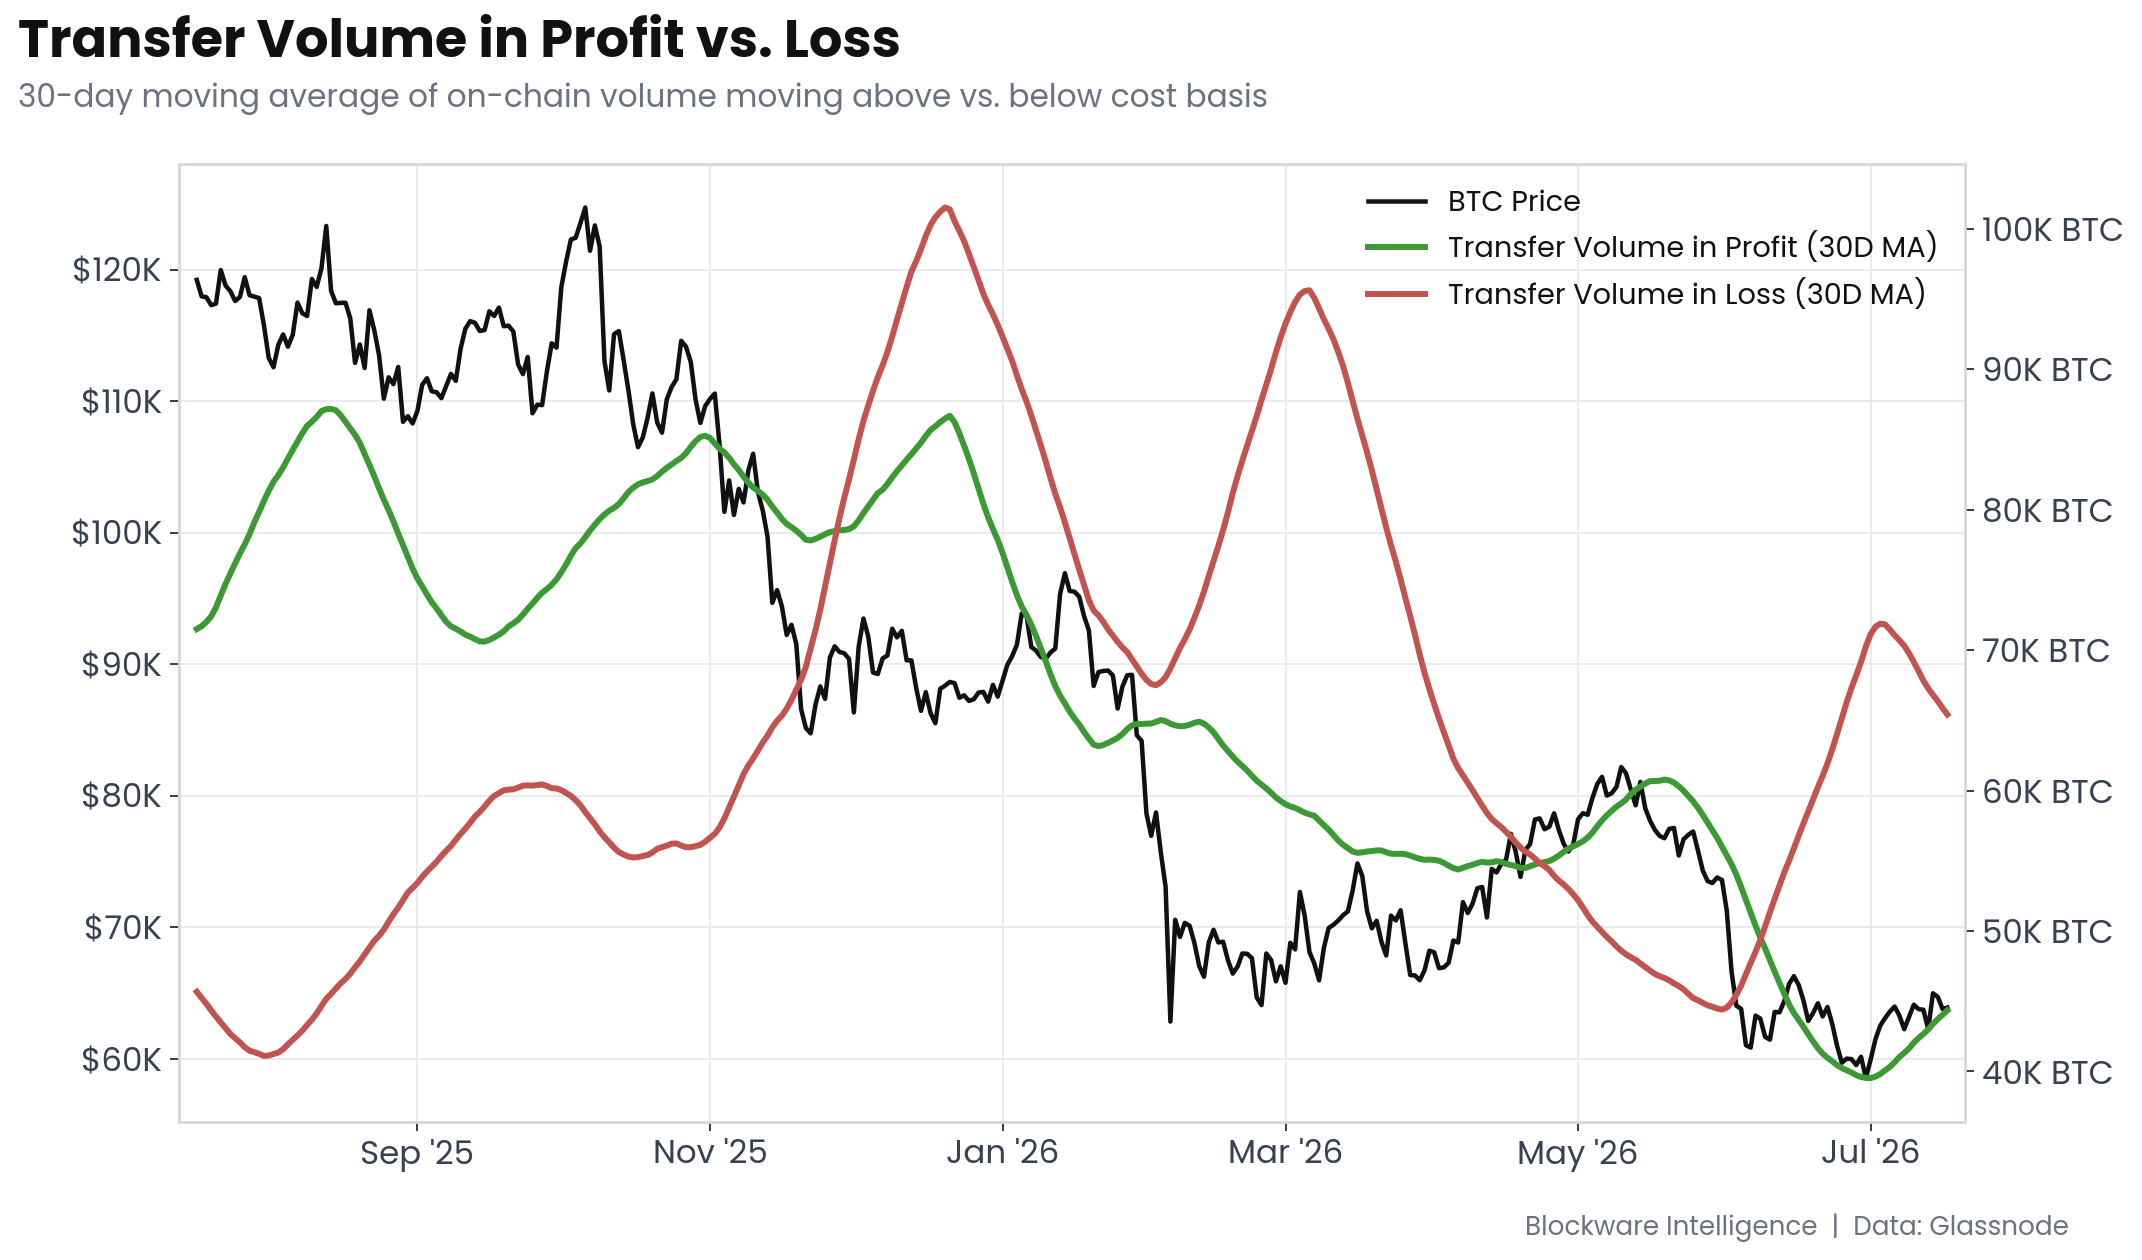
Transfer Volume in Profit vs. Loss
More coin is moving at a loss than at a profit, and the gap is wide. The 30-day average shows roughly 65,000 BTC per day transacting below cost basis against 44,000 BTC above it, a ratio of nearly 1.5, with loss volume dominant since late November. The composition is what matters. Any coin still in profit at $64K was acquired in early 2024 or sooner, so profit-side volume is effectively a proxy for seasoned holder activity, and those holders are barely transacting. The selling pressure is coming from recent buyers capitulating below cost while the cohort sitting on actual gains refuses to distribute at these prices. Holders who have been through a full cycle know these levels are where you accumulate, not where you exit. This is the same on-chain fingerprint that marked prior cycle lows.
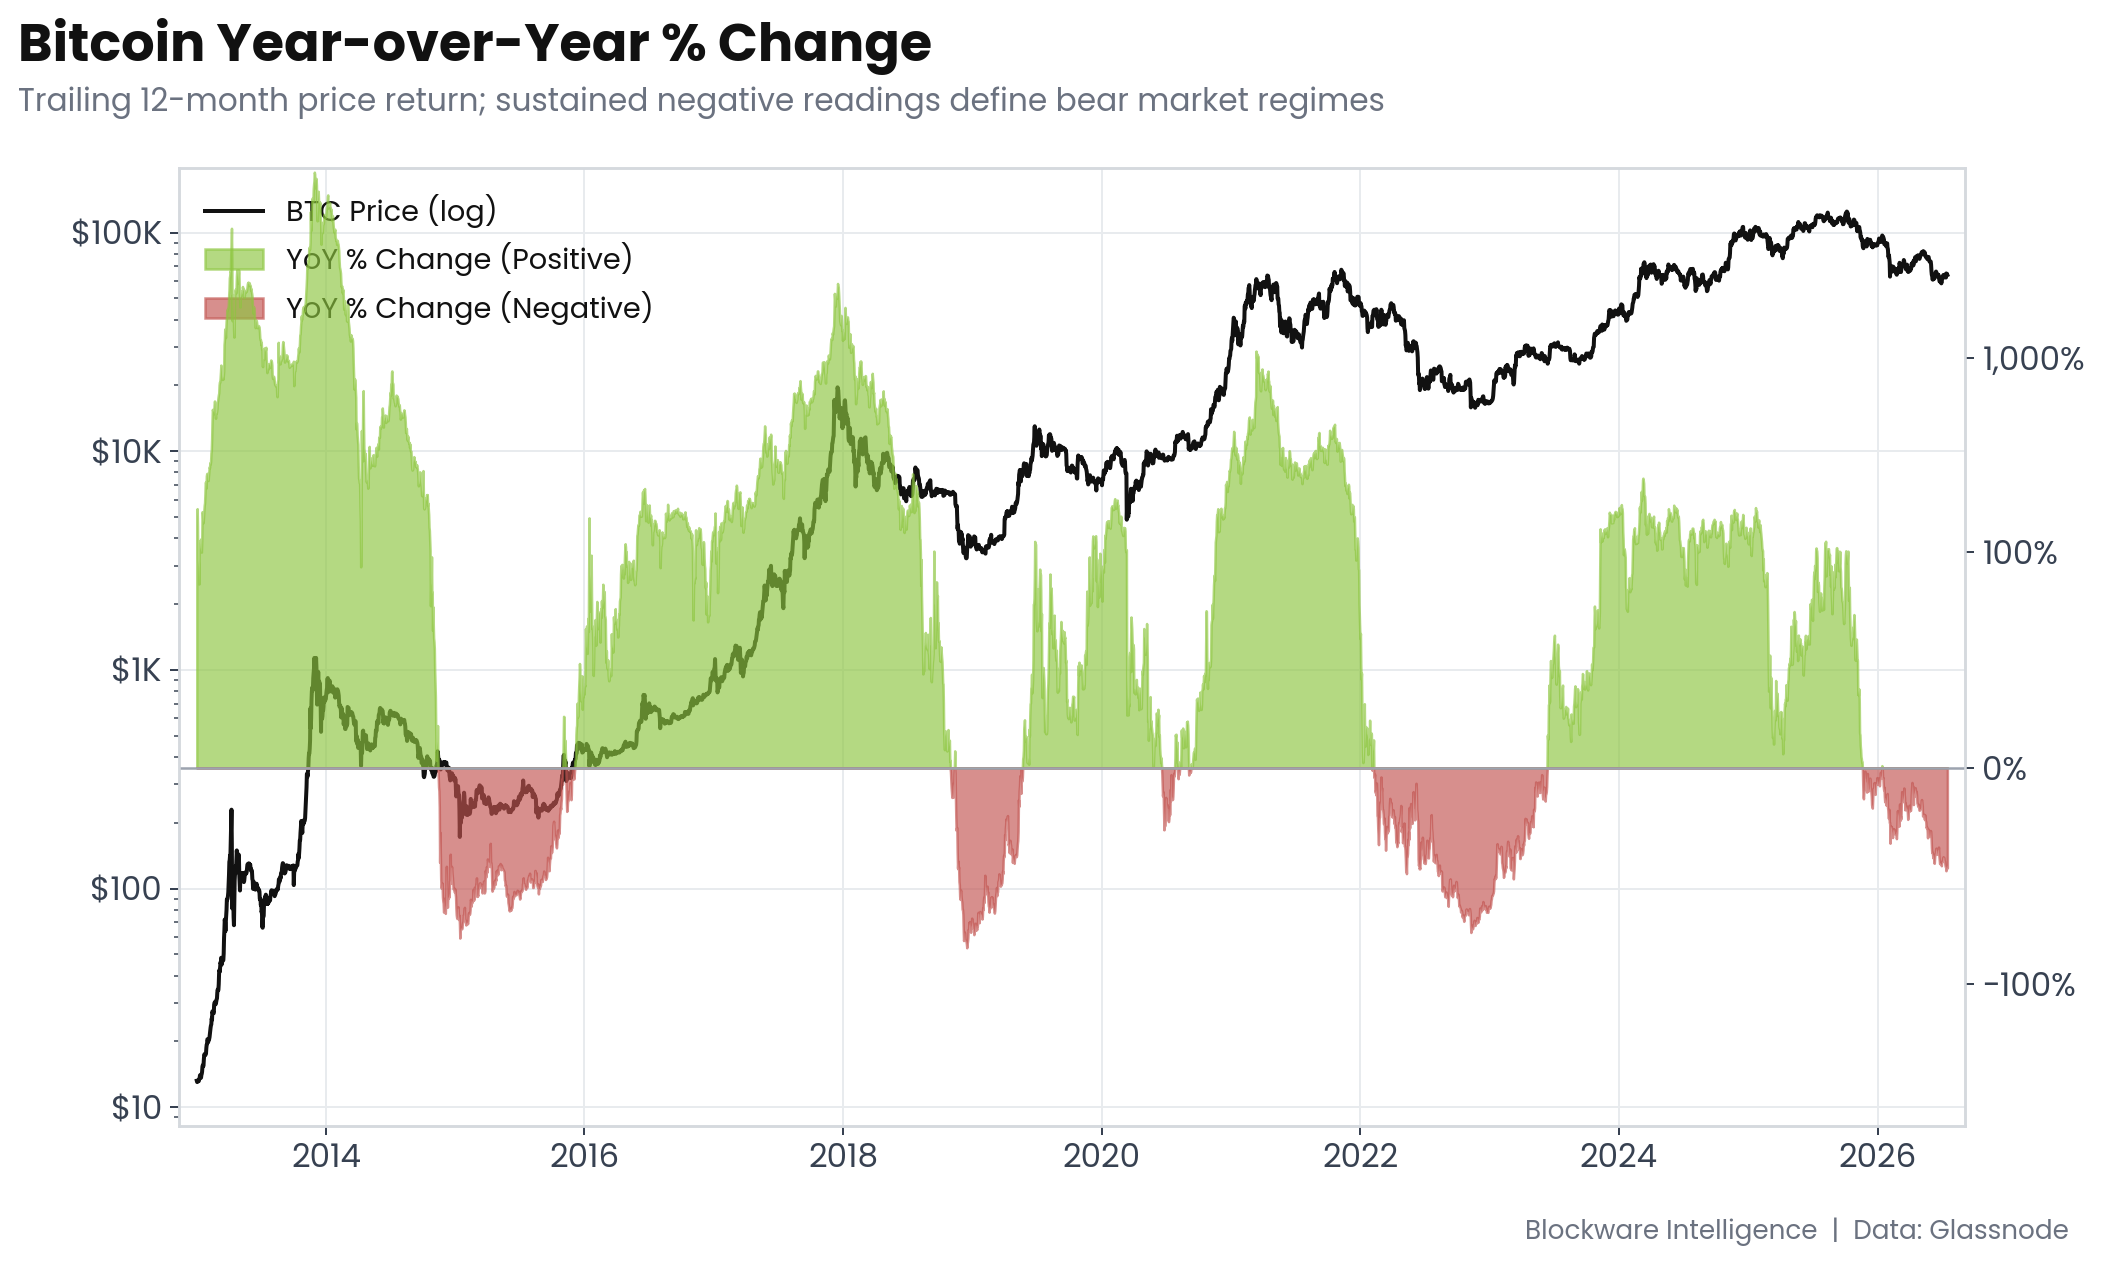
Year-over-Year Price Change
The year-over-year change in price flipped negative on January 15, 2026 and has now been below zero for 184 consecutive days, currently reading -46%. Every prior cycle bottom formed inside one of these negative windows, which makes duration a useful clock. The 2014-2015 bear spent 352 consecutive days negative, 2018-2019 spent 191, and 2022-2023 spent 490. The average across the three is roughly 340 days. At 184 days, this bear has nearly matched the shortest historical window and sits a little over halfway to the average. If this cycle tracks typical duration, the YoY reading flips back positive around year-end, which lines up with the base effect of comparing against the Q4 2025 drawdown rather than the highs.