Blockware Intelligence Newsletter: Week 88
Bitcoin on-chain analysis, mining analysis, macro analysis; overview of 5/20/23-5/26/23
Blockware Intelligence Sponsors
Stamp Seed’s DIY tool kit gives you the ability to hammer the seed words generated from your hardware wallet into commercial-grade titanium plates, using professionally designed metal stamping tools.
By hammering each letter into titanium, your words become one with the metal, meaning no loose pieces or varying materials that could fail under extreme conditions. Our plates are fire-resistant, crushproof, non-corrosive, and will not decay over time, allowing you to HODL for the long haul.
Use code BLOCKWARE15 for 15% off sitewide, valid through May 2023.
Summary:
The clock is ticking for Congress to strike a deal surrounding the US debt ceiling.
Monetary liquidity is becoming a large concern in the US, as the Treasury will need to refill their general account once a deal is struck.
Stock market sentiment had become very overheated in recent sessions, yet the market has shown just how strong buyers are this week.
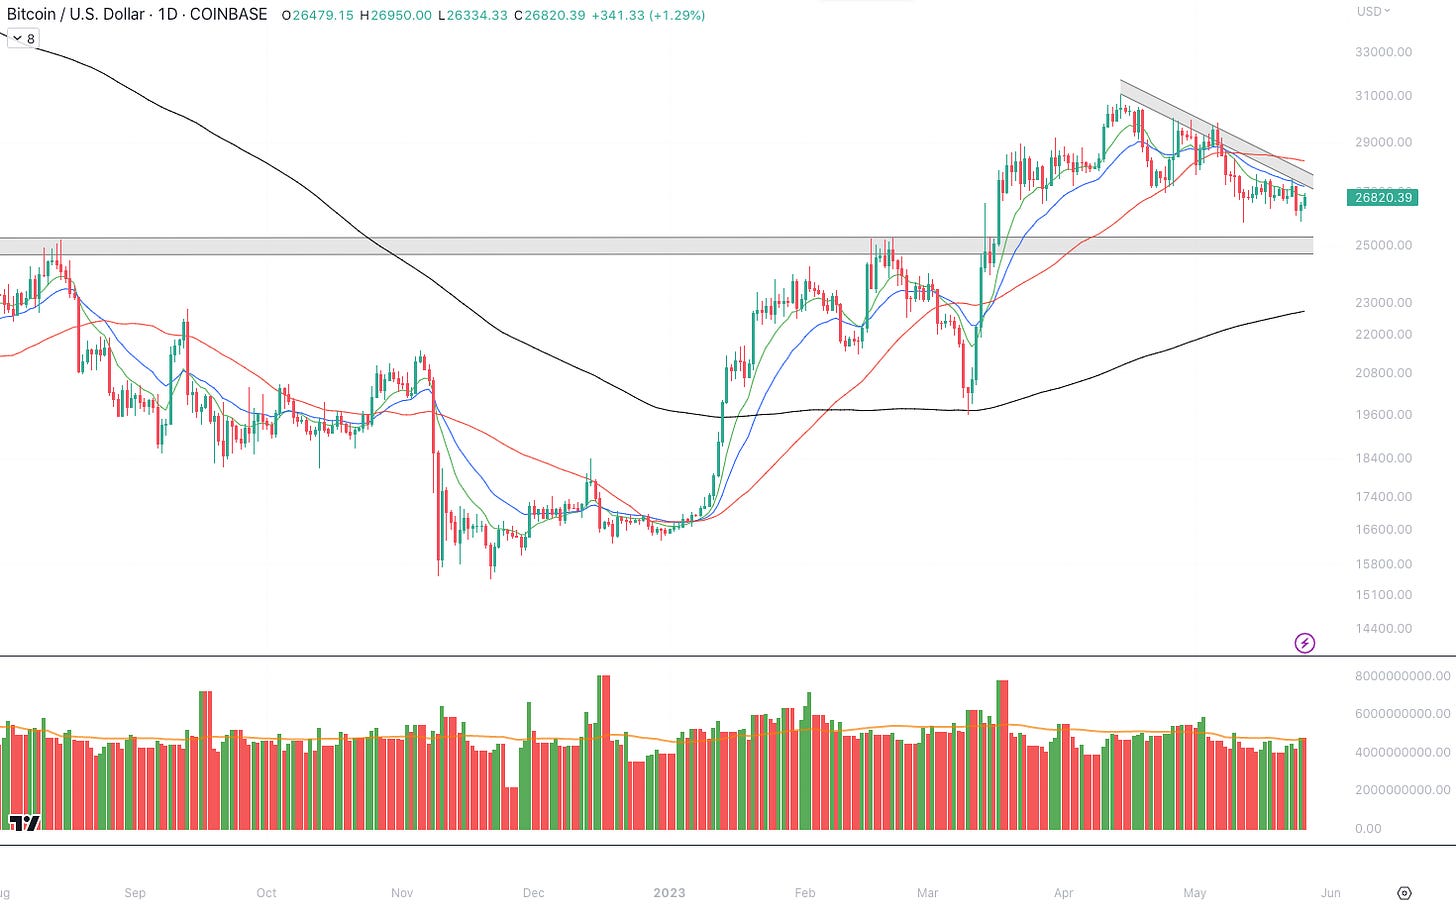
Bitcoin appears to have found support around $25,800, our team has eyes on $28,000 to confirm a new short-term uptrend underway.
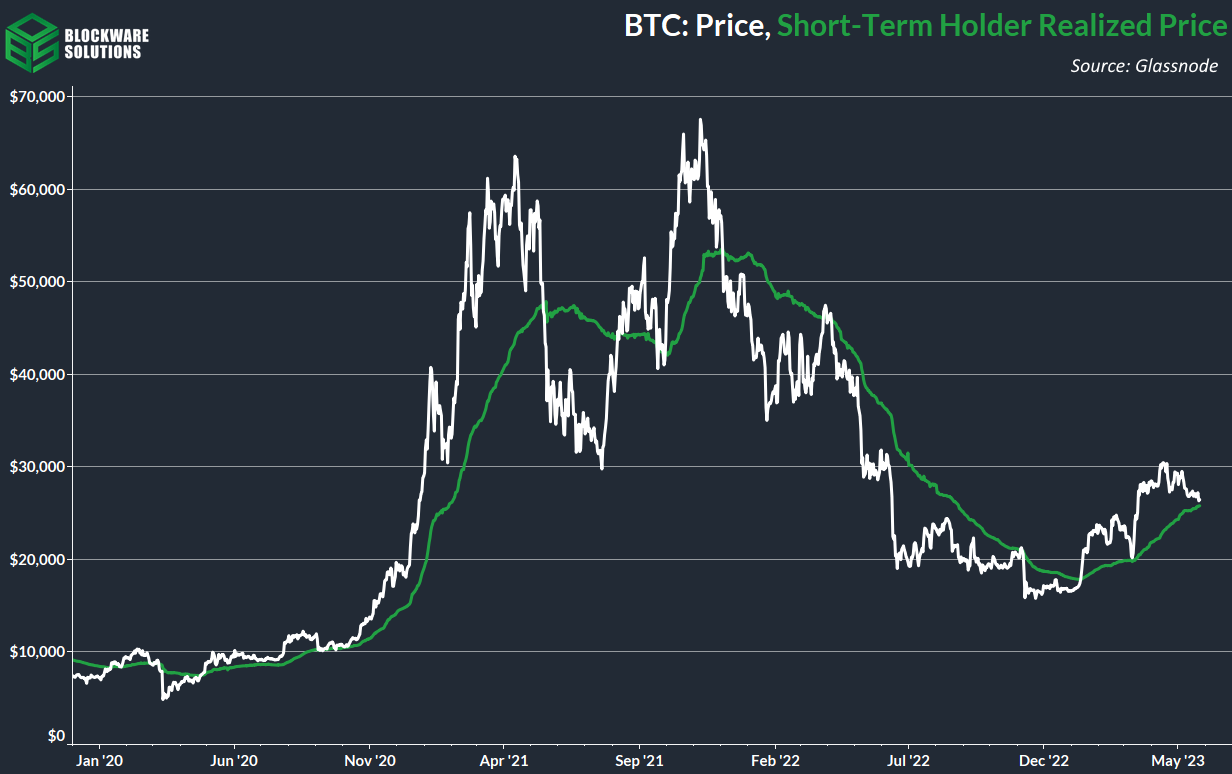
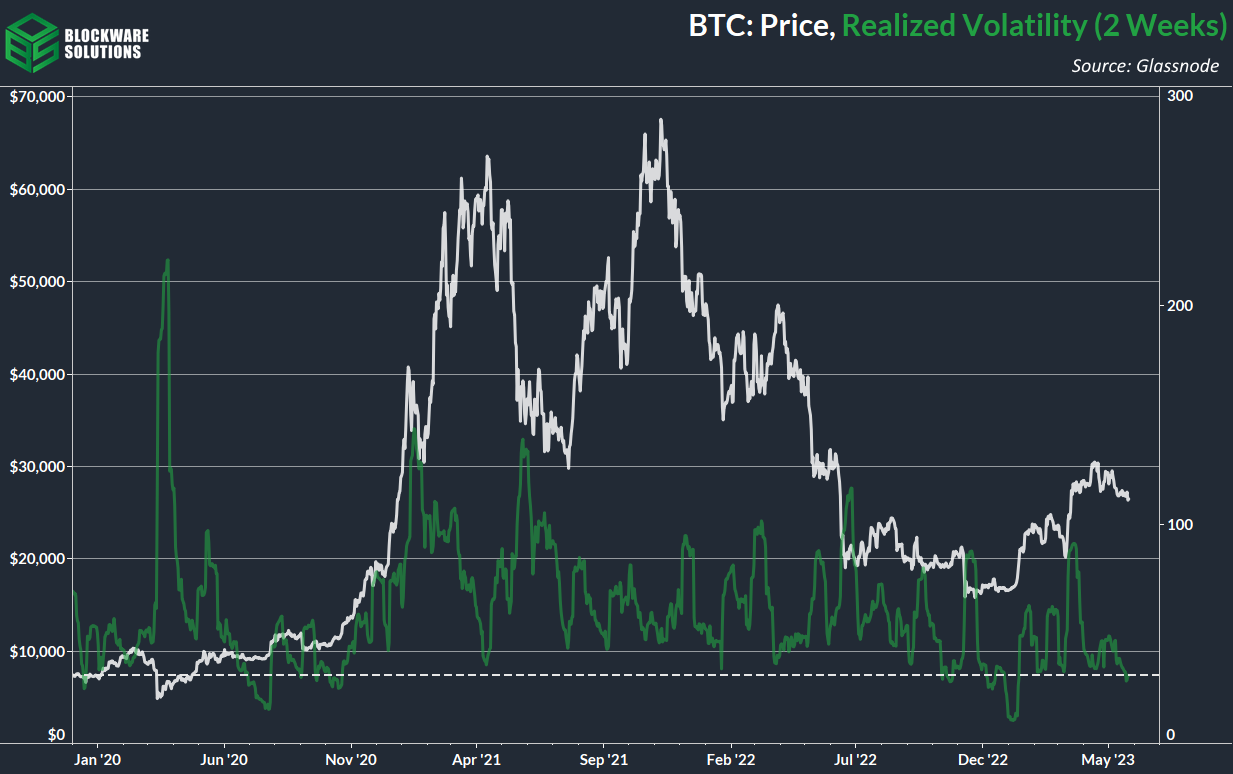
Test of short-term holder realized price and low realized volatility signals that BTC could potentially make another leg up in the near future.
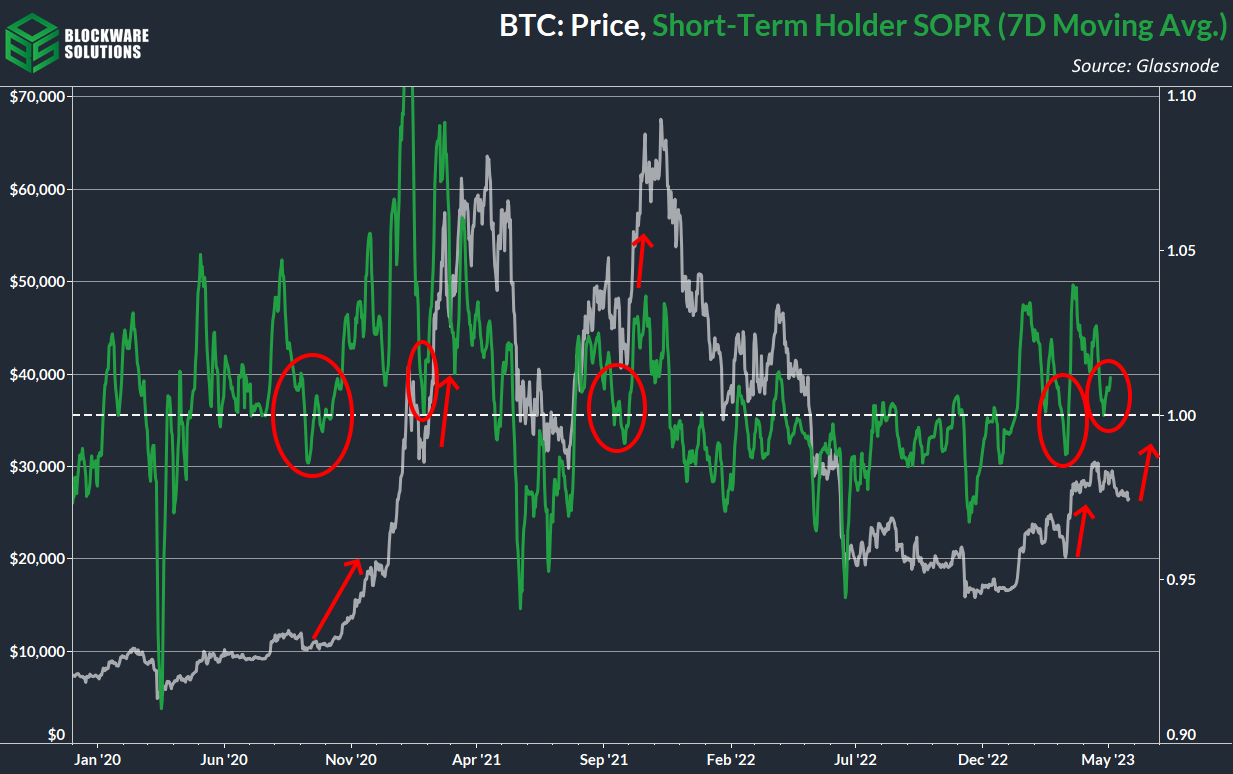
STH SOPR indicates coins are no longer being moved at a loss.
Long term holders continue to accumulate and HODL.
Flat open interest indicates minimal activity in the derivatives market.
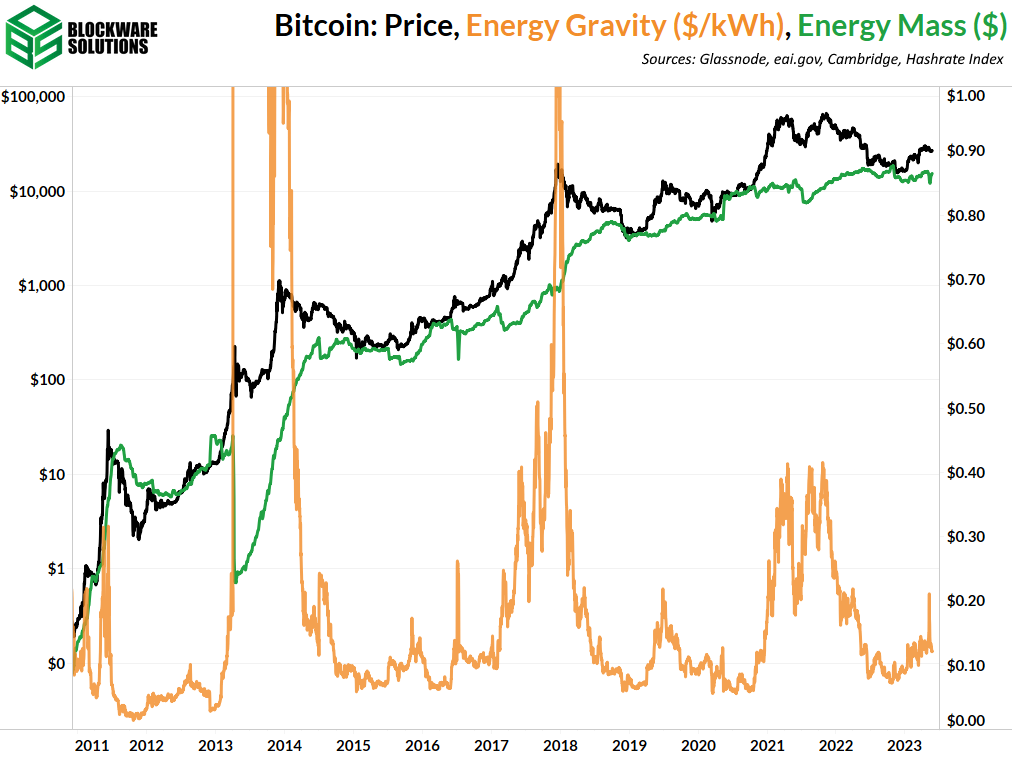
The breakeven electricity rate for a modern Bitcoin ASIC is $0.12/kWh.
At a typical hosting rate today, new-gen Bitcoin ASICs require ~$16,175 worth of energy to produce 1 BTC.
General Market Update
It’s been quite the week across the macroeconomic landscape, so there is much to discuss in this week’s edition of the Blockware Intelligence Newsletter.
Dominating the news cycle has been growing concerns about the state of the US debt ceiling. As I’m sure you know, the clock is ticking for policy makers to strike a deal that gives the Treasury enough room to repay debt obligations.
There are essentially two paths forward for the US to lower the deficit, cut spending or raise taxes. More than likely, the deal struck will incorporate a combination of the two.
While it appears that no material progress has been made, the Treasury reaffirmed their belief that the US will default on their debt servicing obligations on or around June 1st (1 week from yesterday).
This is likely a slightly conservative estimate, and Goldman Sachs iterated that they find the default date to be June 8-9th.
US Treasury General Account Weekly Balance (FRED)
Due to ongoing negotiations in Congress, the Treasury’s General Account held at the Federal Reserve has been depleted quite significantly. The Treasury now has roughly $70 billion in cash remaining in their General Account.
Once this account is depleted, they’ll have no means of paying interest on Treasury bonds, once a single payment is missed they would be classified as in default.
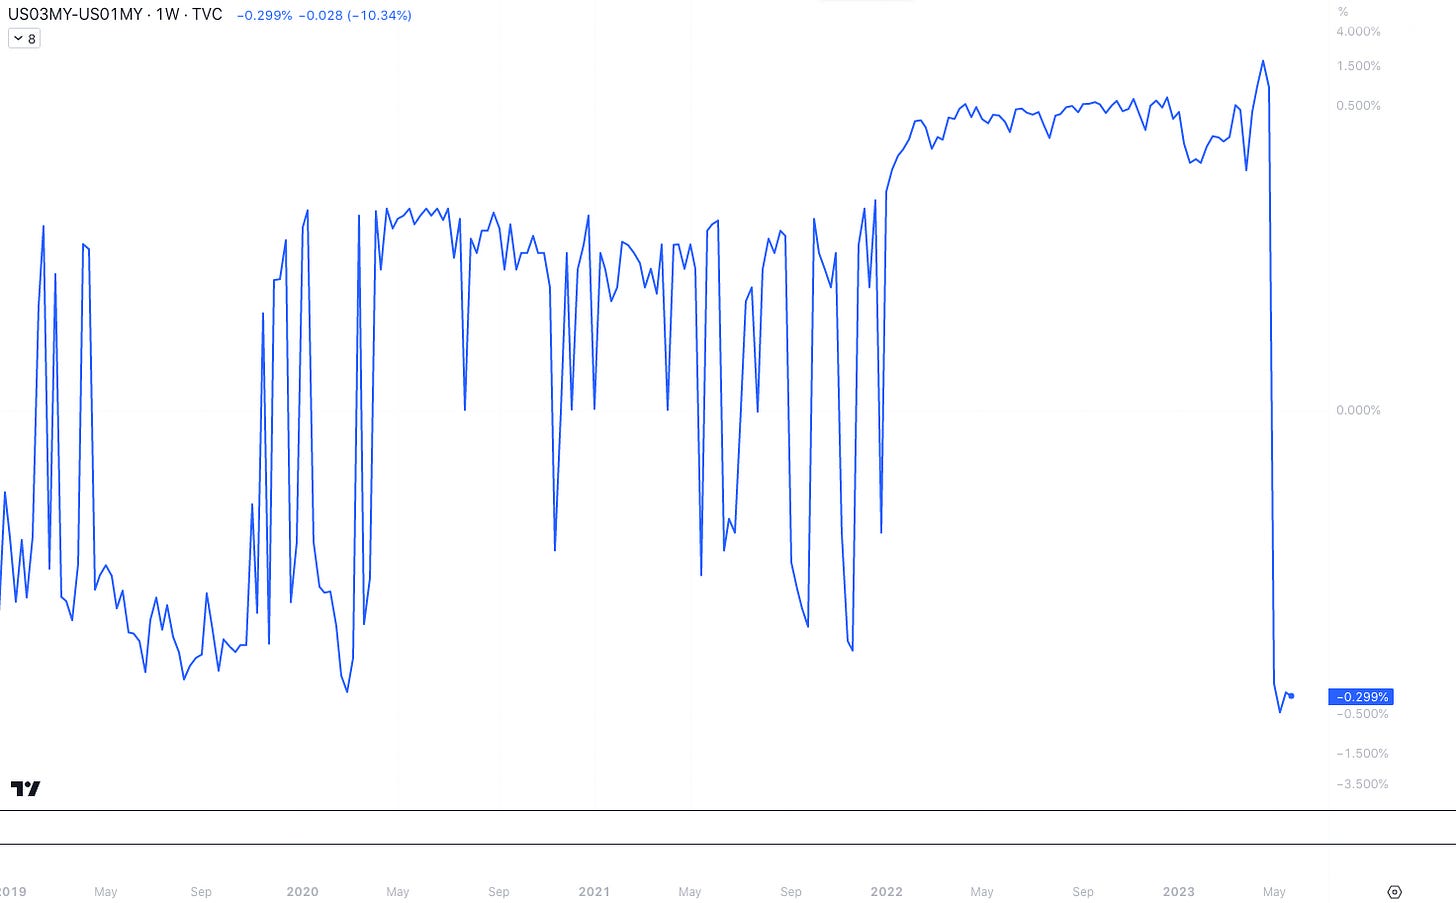
The market has priced this scenario in, to an extent. One way we track this is by looking at Treasury bond spreads.
US 3-Month/1-Month Treasury Spread, 1W (Tradingview)
The chart above subtracts the yield of the 1-month Treasury bill from the yield of the 3-month. In a healthy market, this spread is positive as bonds with longer maturities tend to have higher yield than shorter-dated bonds.
In a default scenario, shorter maturity bonds would be defaulted on first. As you can see above, the yield of the 1-month bill has risen significantly above the 3-month in recent weeks.
This is the market pricing in the possibility of a short-term default scenario. Investors, however, still appear fairly confident that a deal will be struck to raise the ceiling.
The real concern comes when considering what liquidity conditions will look like after a deal is agreed upon. The goal of this deal will be to provide the Treasury with enough room to increase their General Account balance.
So how does the Treasury raise capital? Generally this is through bond issuance.
So when the Treasury issues bonds, who normally buys them? Well in an ideal market, newly issued Treasuries are bought by banks using their reserves. However, in 2023, banks are very low on reserves (think about the ongoing banking crisis).
Those banks with sufficient reserves to buy newly issued Treasuries will do so, thus drawing monetary liquidity from the banking system. The Fed is also in the midst of shrinking their balance sheet at the moment (quantitative tightening), creating a double net-negative effect on liquidity in the US.
US M2 Money Supply Year-Over-Year Growth (FRED)
As of Q1 2023, M2 growth is down to -2.6% YoY, its largest decline on record (data begins in 1959).
Long story short, many signs point towards an extreme reduction in monetary liquidity coming in 2023. Bankers have clearly foreseen this, as credit conditions continue to tighten in recent weeks.
C&I Loans, 1M (FRED)
The chart above shows the amount of commercial and industrial loans outstanding from US banks. As you can see, credit has begun to decline here.
With interest rates being continuously raised over the last ~14 months, credit worthiness has steeply declined. Banks have now begun to offer less credit to businesses and consumers alike.
This combination of tightening credit conditions and decreasing liquidity creates the narrative of a recession looming for the United States. Whether or not this will be avoided is yet to be seen.
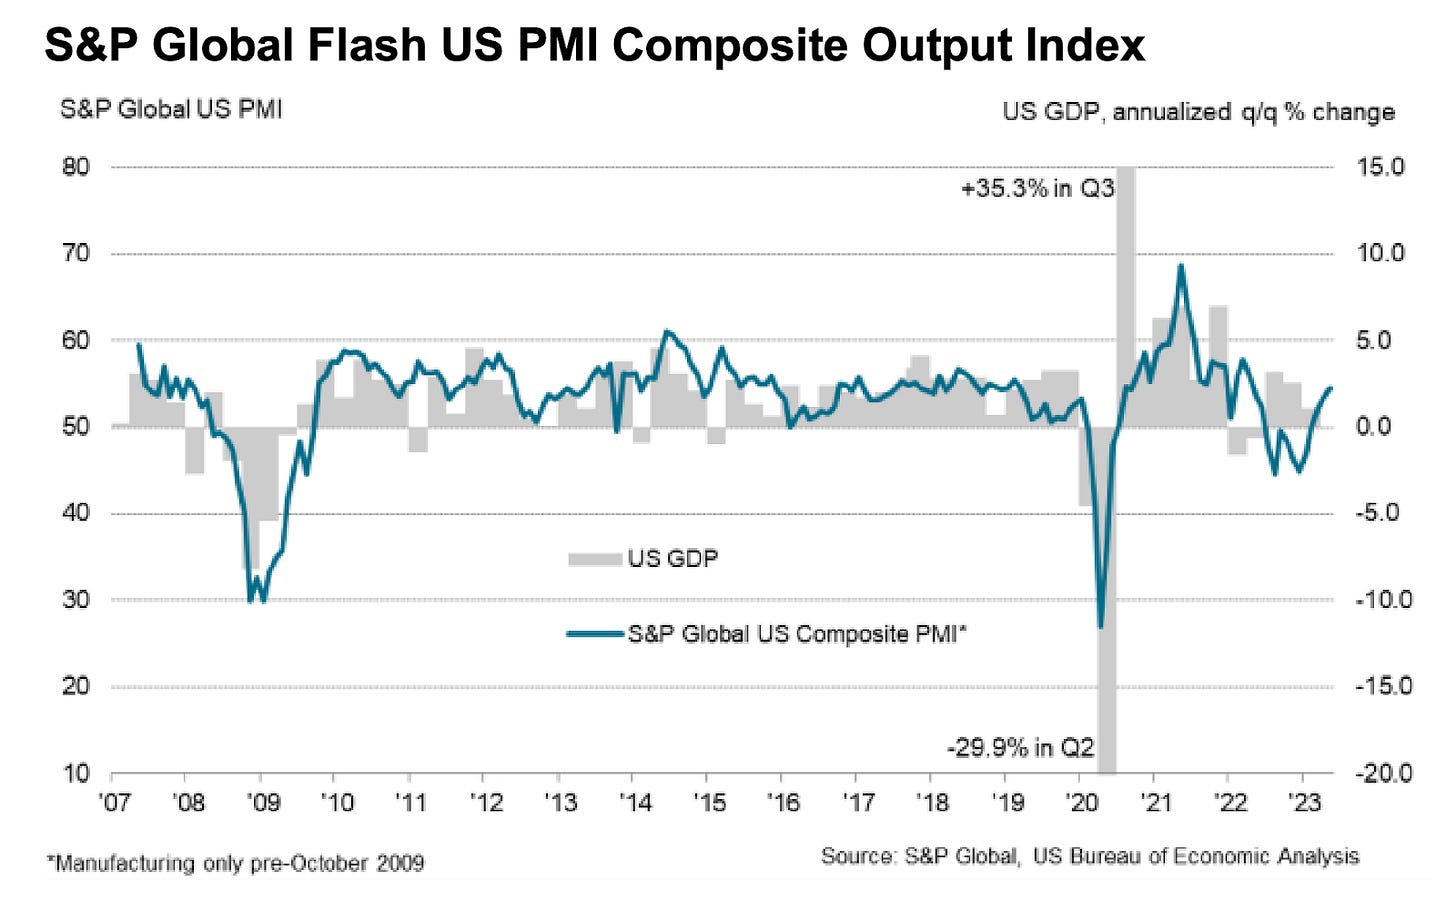
That being said, the Purchasing Managers Index has shown signs of economic conditions improving in the US.
As you can see above, the latest Flash Composite PMI, released on Wednesday, sits at 54.5, well above estimates of 50.0.
This is indicating that private sector output is quite strong as of May 2023, as is certainly not indicating a recession. This growth was driven primarily by the services sector, while the manufacturing side only grew slightly.
Stocks have shown exceptional levels of resilience, despite the clear concerns about liquidity. The Nasdaq is back up through $12,700 for the first time since August 2022.
The Nasdaq has been a leading index of late, as the narrative among institutional investors shifts back towards risk-on attitudes. This has come on the backs of strong earnings from many large cap names.
That being said, the index appears quite extended from several key moving averages. Namely, the index is now nearly 5% above its 50-day simple moving average.
Nasdaq Composite Index, 1W (Tradingview)
This level of extension, paired with overheated sentiment (see below) leads us to believe that we may be nearing a pullback for equities. Furthermore, the index is nearing a very key weekly moving average.
As you can see above, the Nasdaq is only ~1.57% below its 100-Week Simple Moving Average. This is a logical place where we could see strong seller enter the market.
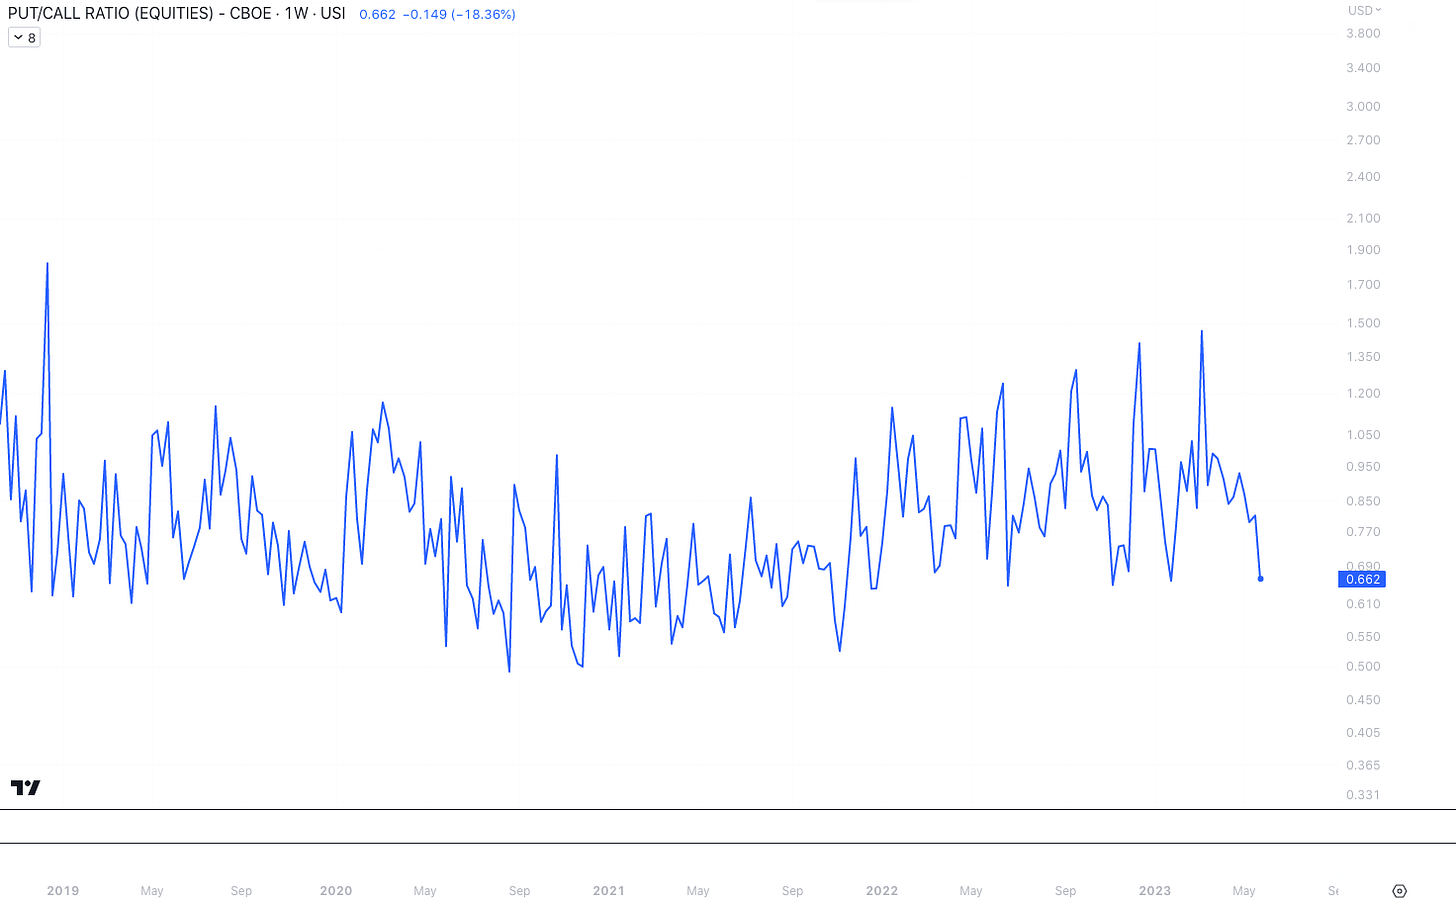
Equity-Only Put/Call Ratio, 1D (Tradingview)
As we’ve just mentioned, sentiment has also grown to be quite overheated as of recently. The equity-only put/call ratio has dipped down to ~0.66, its lowest level since the market began its rally in January.
This shows us that the majority of derivatives trades being placed are on the bull side. While this, combined with climbing yields, does indicate that we’re likely due for a pullback soon, there is still plenty of room for this indicator to move lower.
The age old saying goes, “Just because a stock is overbought doesn’t mean it can’t become more overbought”.
The market showed off it’s strength on Wednesday and Thursday. Wednesday morning the Nasdaq gapped down, yet was able to reverse and close above the 10-day. On Thursday the index gapped up 1.78%, and didn’t look back.
Note that US markets will be closed on Monday in observance of Memorial Day.
Bitcoin-Exposed Equities
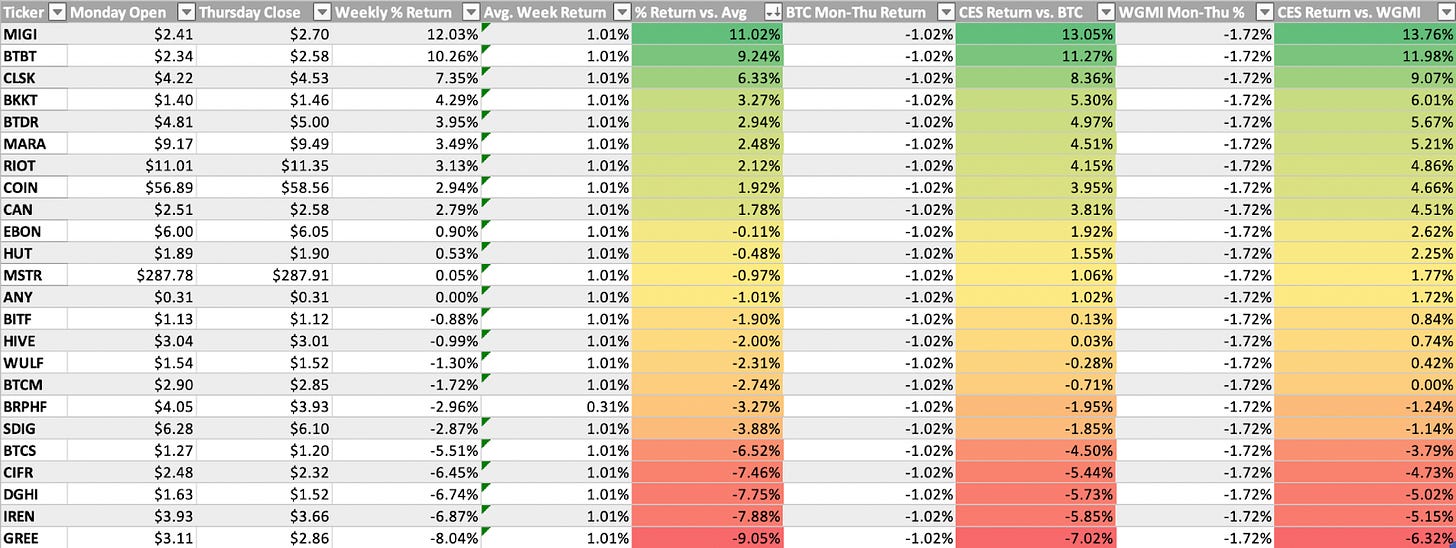
Despite fairly weak price action from spot Bitcoin, several public Bitcoin miners have shown exceptional strength this week.
The names that stand out in terms of relative strength are: CLSK, BTBT, RIOT, and HUT.
Cleanspark (CLSK) has been among the strongest miners, from a price structure perspective, for several months now. This strength continued this week, as CLSK came within just $0.07 of making new YTD highs.
The market is clearly rewarding those miners that have capitalized on cheap ASICs and weren’t overleveraged last year.
It’s very important to pay attention to price action relative to other miners in the group, and Bitcoin itself. Those names showing strong RS are likely to be those who perform the best once Bitcoin really takes off.
Above, as always, is the table comparing the Monday-Thursday performance of several Bitcoin-exposed equities.
Bitcoin Technical Analysis
Following a couple weeks of sideways price action, we saw Bitcoin initially break down below this current range. However, BTC was able to find buyers around ~$25,900 and is so far holding up decently.
Bitcoin / US Dollar, 1D (Tradingview)
Despite ~$25,300 being the more logical support zone for BTC, price seems to have reacted well to the test of ~$25,900. Volume has picked up a touch this morning, as price rallied back up to the 10-day EMA.
Heading into the long weekend, I’d still have my eye on $25,300, but also watch for a clean break above the 10-day. Declining moving averages tend to attract more sellers than buyers, so a break above could confirm a new rally underway.
Full confirmation of a new short-term uptrend would come from a break above the current declining upper-trendline, at around $28,000.
Bitcoin On-chain and Derivatives
After two months of sideways/downward price action, BTC is nearing a test of support for the second time in 2023. In March of this year, BTC found support at short-term holder realized price (cost basis) at the ~$20,000 mark. BTC ripped 40% off of that level in the matter of a week.
Now price and short-term holder realized price are within $1,000 of each other, with a support test looming on the horizon around the $26,000 level.
The cost-basis of short-term holders is an important level because:
Price is set at the margin
Short-term holders have a psychological affinity to buy or sell at their cost basis
As we will get into later in this section (and as we have discussed ad nauseam this year) long term holders are unrelenting in their willingness to HODL. This is indicative of their belief that selling BTC at the current price has a high opportunity cost. The weakest hands have capitulated from the market and a floor has seemingly been established.
On the other side of that coin, a majority of on-chain activity is coming from short-term holders. Examining their behavior can provide clues as to where the price may be headed in the short-term. We’ve already seen the short-term holders defend their cost-basis once this year, the status quo is that they will do it again.
Spent output profit ratio (SOPR) measures whether or not coins are being moved at a price higher or lower than that at which they were first acquired.
Looking at STH SOPR, we can see the aforementioned behavior (defend cost-basis in bull markets, reject cost-basis in bear markets). After a brief stint of coins moving at a loss, STH SOPR is now back above 1. This is bullish for near term price action as it shows capitulation from short term holders is likely complete.
Alongside the impending support test, low realized volatility further signals that price is likely to make a big move soon. Volatility (2 week measurement) has not been this low since right before the jump to $20,000 in January.
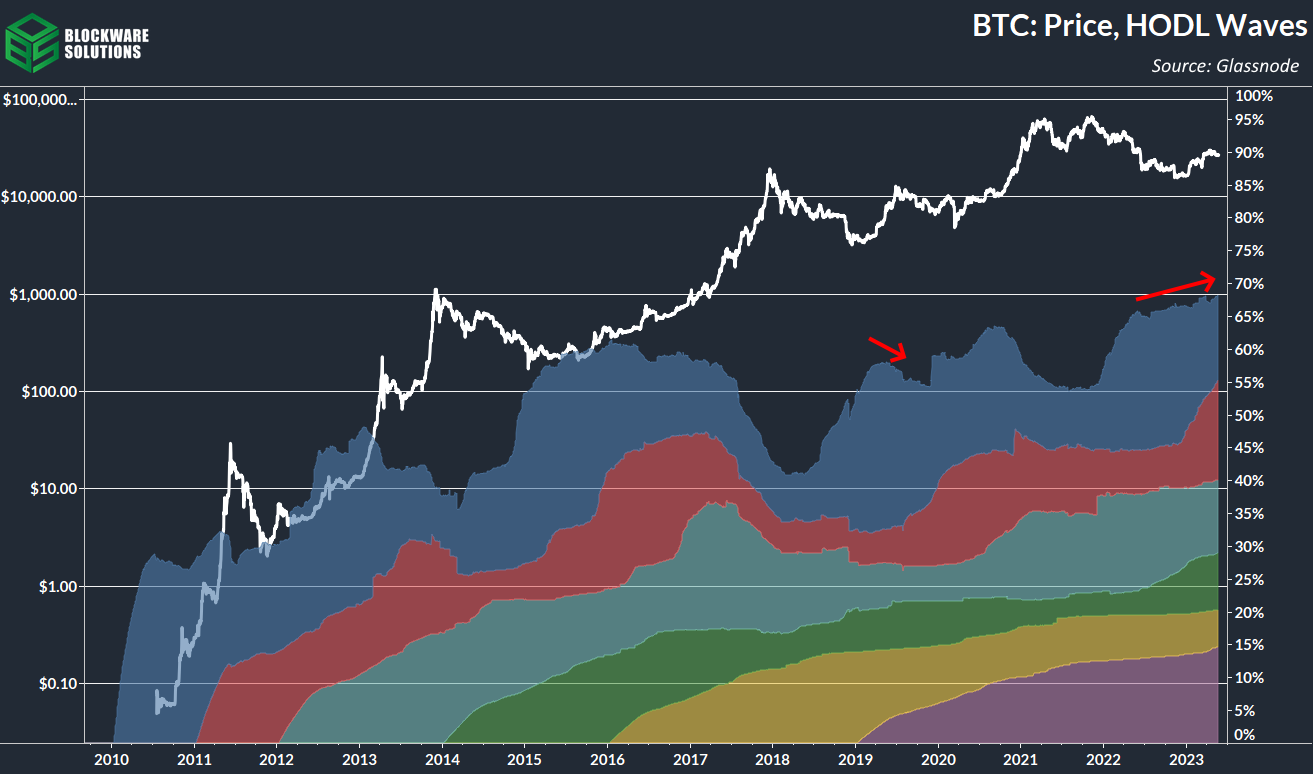
As mentioned previously, long-term holders are absolutely refusing to let go of their coins, keeping supply conditions extremely tight. Contrast this with the 2019 rally in which long term holders distributed into the strength.
As long as supply continues to contract into the hands of users who have verifiably demonstrated an unwillingness to sell at basically any price, there’s little reason to be bearish in the medium to long term.
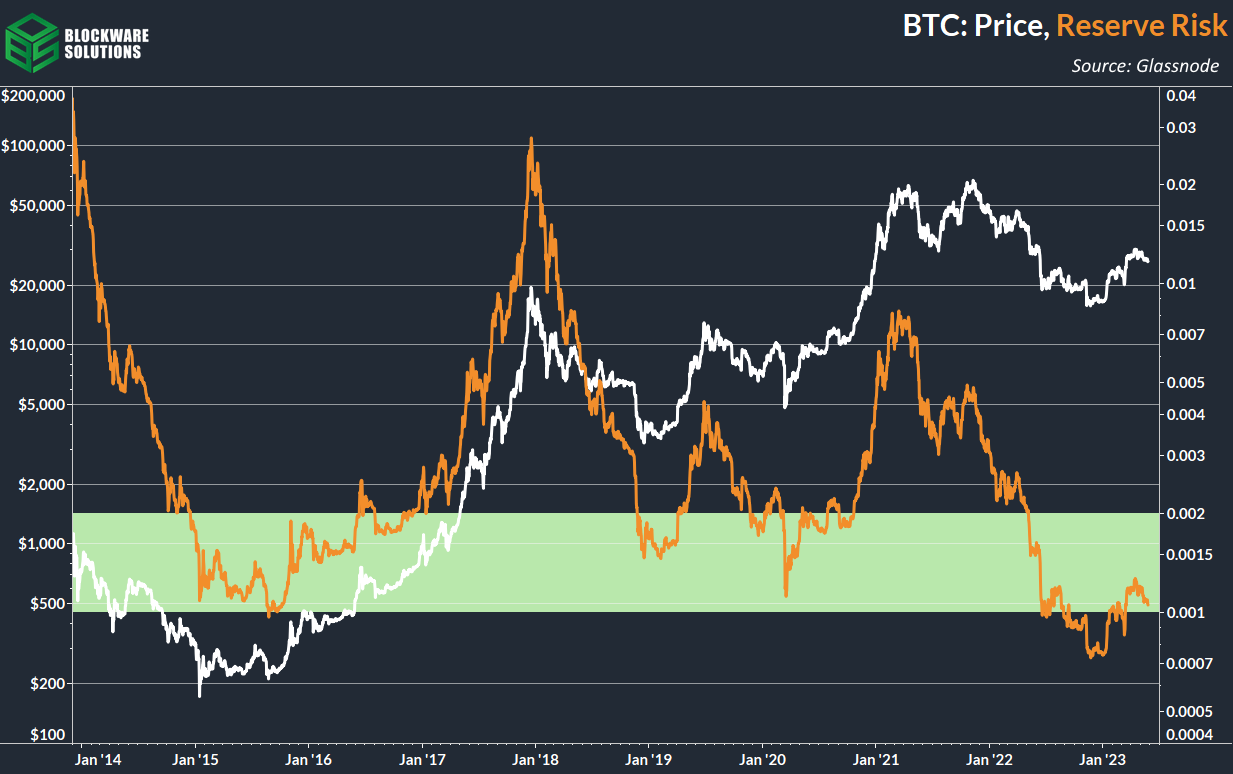
Reserve risk quantifies this effect. At points in which price is down and supply is contracting into price-agnostic holders, it’s a sign of a low risk bottom. You can clearly see the vast difference in market conditions between now and 2019.
The longer that BTC moves sideways without long-term holders relinquishing in their conviction, the more amplified upwards price action will be whenever a bullish catalyst arises, whether that catalyst is macro induced or halving induced.
On the derivatives side of things, there’s nothing concerning at the moment.
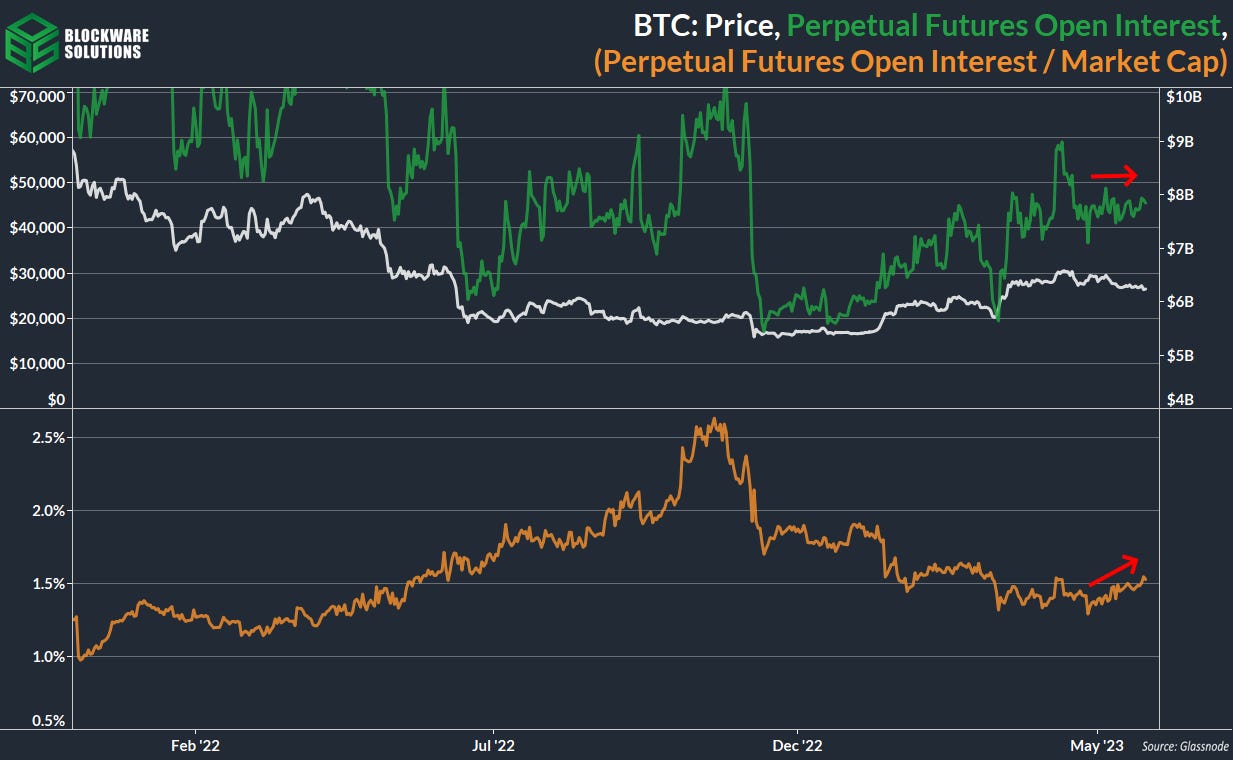
Perpetual futures open interest has moved sideways for the past month. On a market cap adjusted basis, it has trended slightly up during this time, understandably so as price has trended slightly down respectively.
We’re not seeing traders rush in to open up derivatives contracts, a flat open interest, especially during relatively non volatile price action, just signals that existing contracts are remaining open, as these futures contracts are perpetual, they do not have expiration dates.
It’s unlikely that we get a massive liquidation event, catalyzing price in either direction. Don’t get me wrong tho, when there is a catalyst, futures will be liquidated, as they always are. But the liquidations will likely be in response to a catalyst, not the catalyst themselves. It’s possible that volatility could entice an increase in open interest which is something that we will keep an eye on.
Bitcoin Mining
Blockware’s @MitchellHODL Highlights Why He is Bullish on Bitcoin Mining
Mitchell Askew published the following Twitter thread highlighting the inflection point the Bitcoin mining industry is likely currently experiencing. If you are mining Bitcoin or you are interested in mining, this provides a great backdrop for the opportunity ahead.
Mining Pool Fee Market
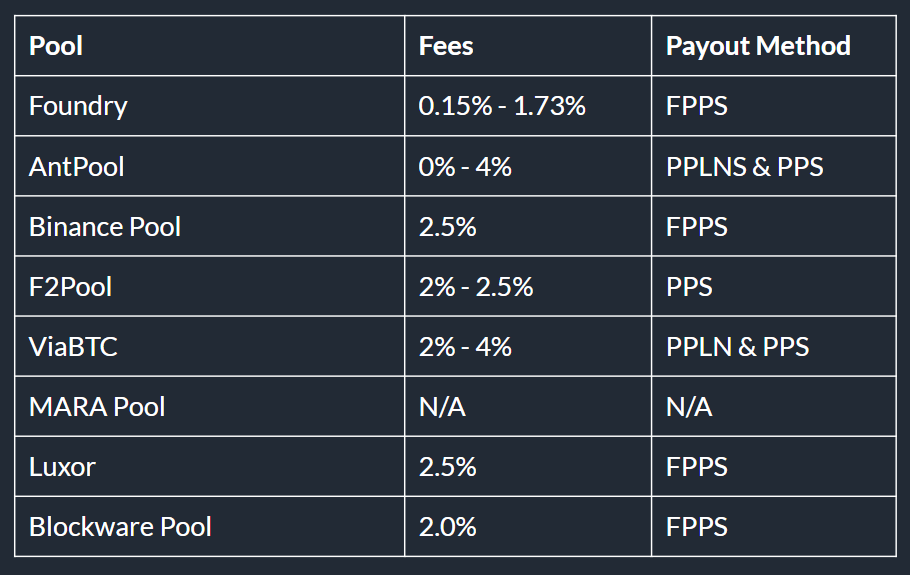
Up until a month or so ago, Foundry was the most popular mining pool for offering 0% fee FPPS (Full Pay Per Share). This means miners received no variability for payouts, Foundry assumed all block luck risk, and Foundry charged a 0% fee for doing so. This recently changed when Foundry increased their fees above 0%.
Over the coming years, it will be interesting to see how the mining pool industry continues to develop. It appeared to be a race to the bottom over the previous few years, but Foundry proved 0% fees are likely not sustainable.
Blockware Intelligence expects industry players to continue developing services around their pool. For example, in order to publish your machine on the Blockware Marketplace, you are required to point hashrate to the Blockware Mining Pool.
Transaction Fees
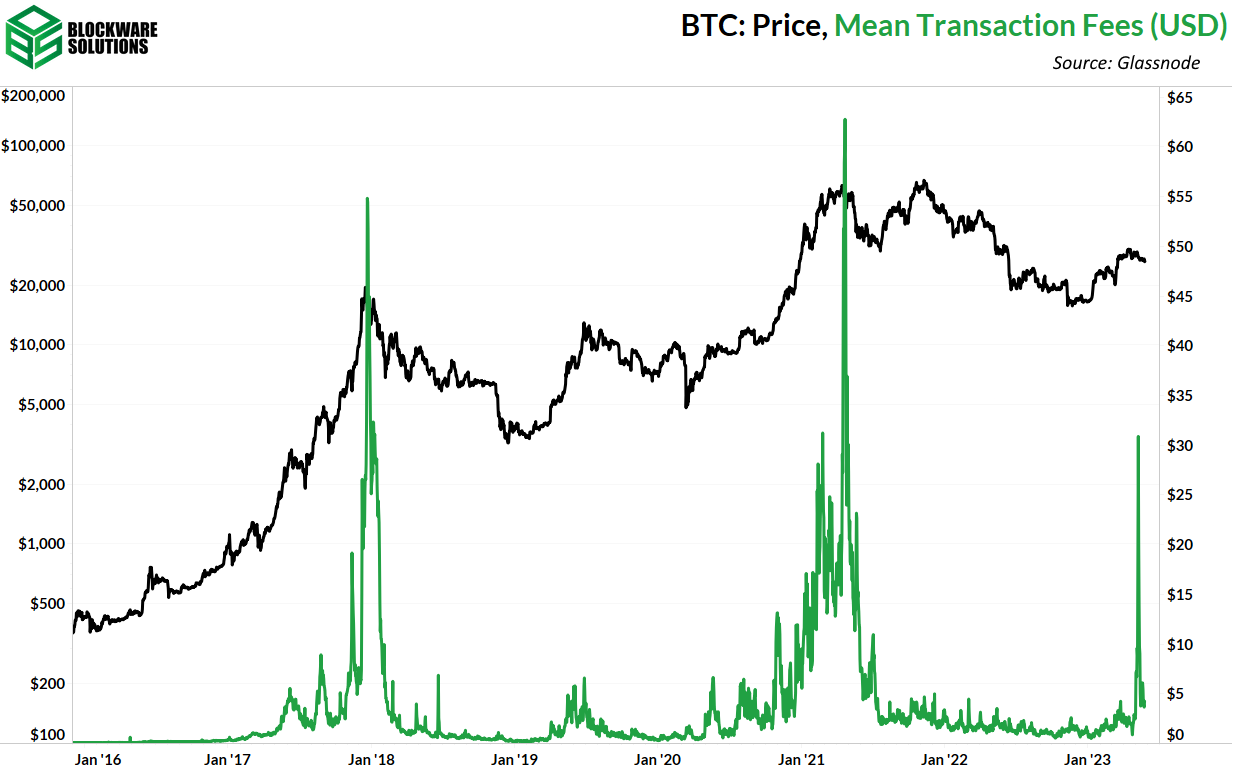
Unfortunately for miners, transaction fees are well off their 2023 peak since the ordinal craze a few weeks ago.
Historically, Bitcoin has seen three massive fee spikes. The first was during the peak of the 2017 bull market, the second was the peak of the 2021 bull market, and the third was the ordinal wave of 2023.
A big question moving forward is what will fees look like for the rest of 2023. Will we see another strong ordinal phase where fees soar again or was that mostly a passing fad? Time will tell, but it appears that the core consistent steady demand for Bitcoin blockspace will likely be BTC transactions, not ordinals.
Energy Gravity
The presented chart, which is based on a Blockware Intelligence Report, depicts the correlation between Bitcoin's production cost and its market price. The model facilitates the identification of overbought or oversold market conditions for Bitcoin, making it a valuable tool for visualizing price trends.
All content is for informational purposes only. This Blockware Intelligence Newsletter is of general nature and does consider or address any individual circumstances and is not investment advice, nor should it be construed in any way as tax, accounting, legal, business, financial or regulatory advice. You should seek independent legal and financial advice, including advice as to tax consequences, before making any investment decision.


