Blockware Intelligence Newsletter: Week 78
Bitcoin on-chain analysis, mining analysis, macro analysis; overview of 3/4/23-3/10/23
Blockware Intelligence Sponsors
Passport is the Bitcoin hardware wallet you already know how to use. With a gorgeous design and familiar interface, Passport makes it easier than ever to self-custody your Bitcoin.
No more sitting at your computer or squinting at tiny screens. Passport seamlessly connects to your phone, empowering you to quickly view your balance and move Bitcoin in and out of cold storage.
Get yours today at:
https://foundationdevices.com/?mtm_campaign=Blockware
Use code: BLOCKWARE for $10 off!
Summary:
Fed Chair Powell stated on Tuesday that we’ll likely see rates end up higher than initially expected.
Initial Jobless Claims saw their largest week-over-week jump in over 5 months.
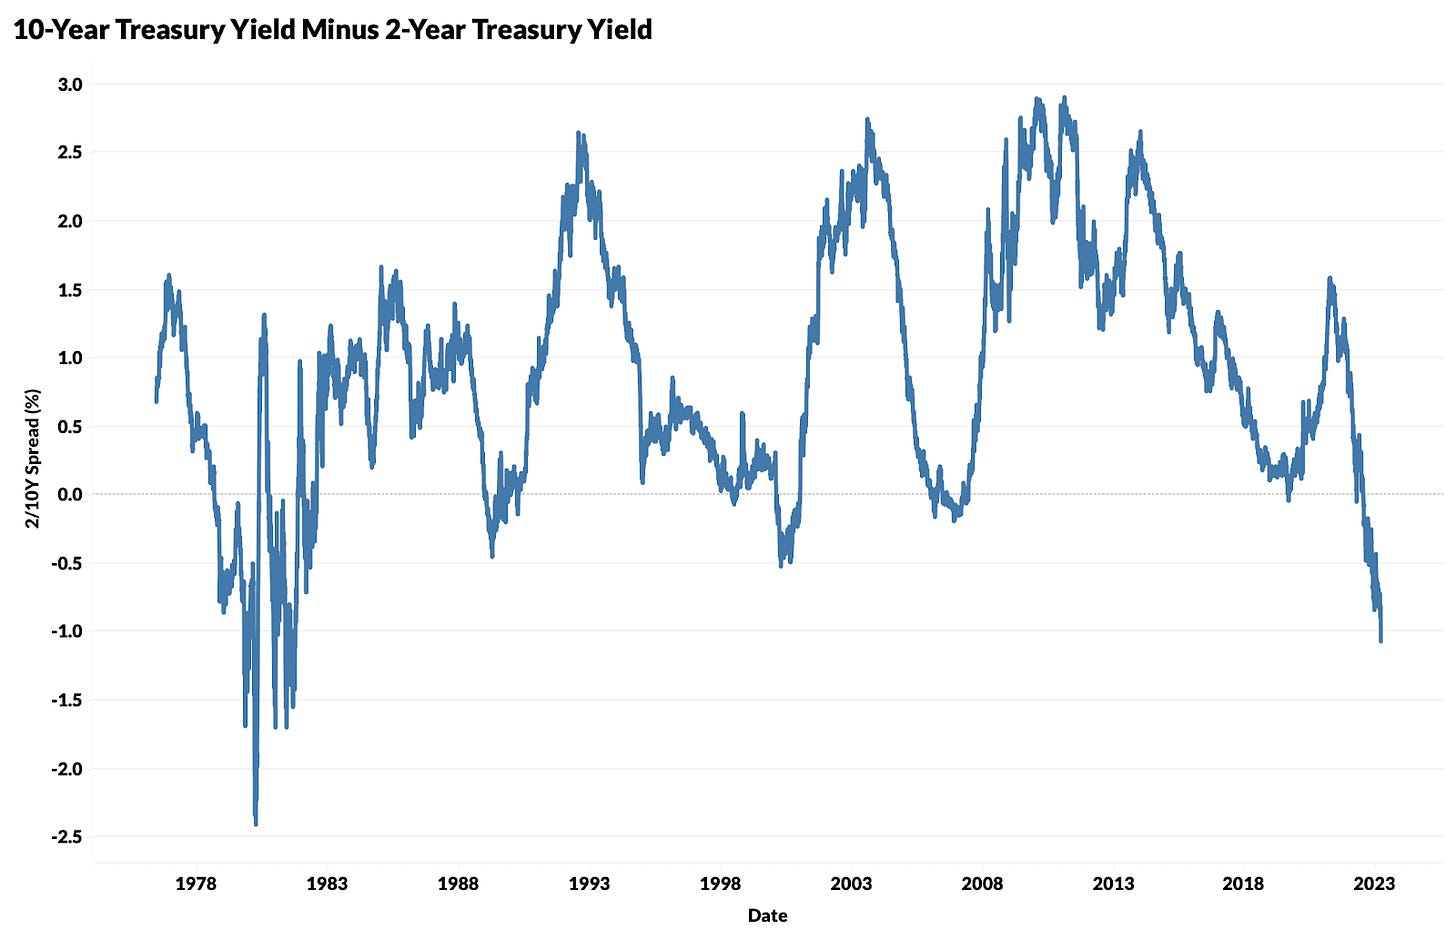
The spread between 2 and 10-year Treasury yields hit -1.0% for the first time since 1981.
Between the liquidation of Silvergate and Silicon Valley Bank, there is increased risk of systemic bank illiquidity.
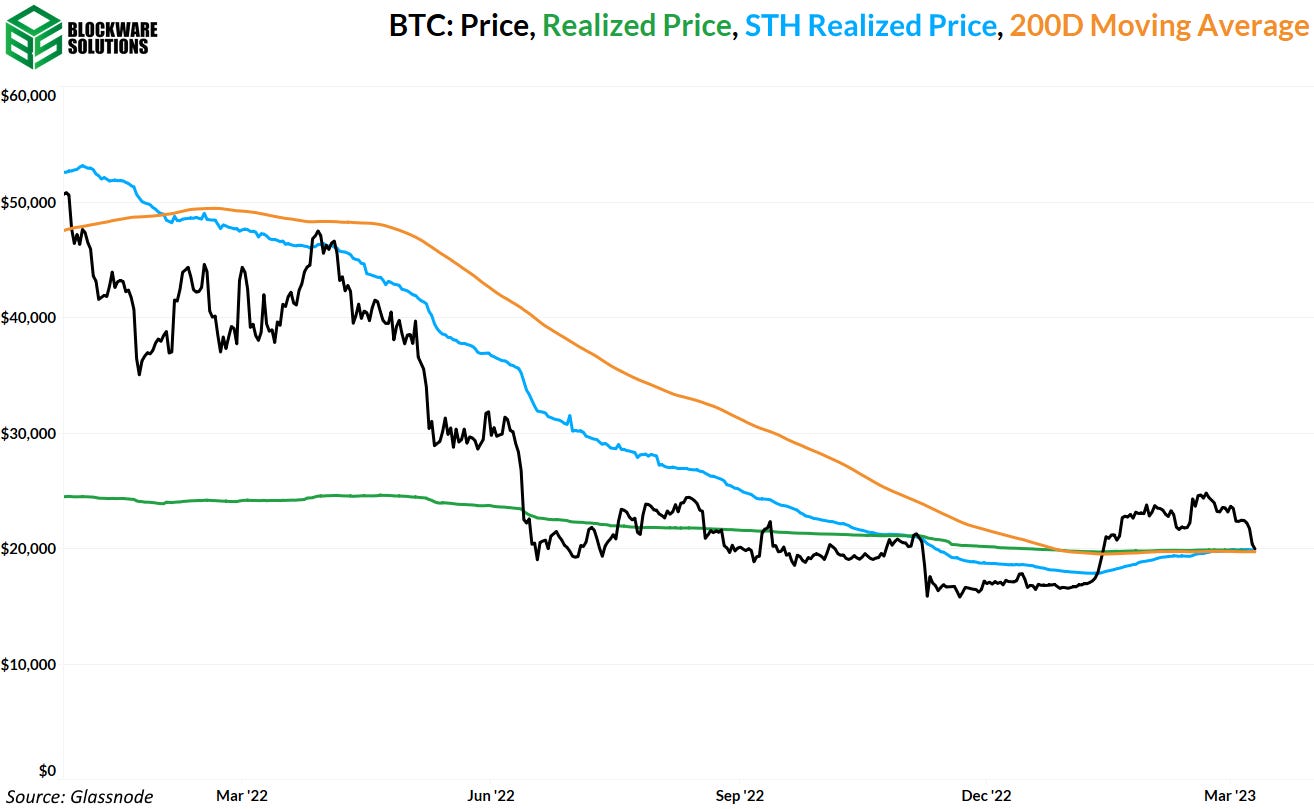
Bitcoin broke below its 2023 YTD AVWAP at 21.4K, but as of Friday morning, has found support around both its 200-day SMA and VWAP anchored from its cycle lows.
BTC is sitting atop the support of short-term holder realized price of $19,700.
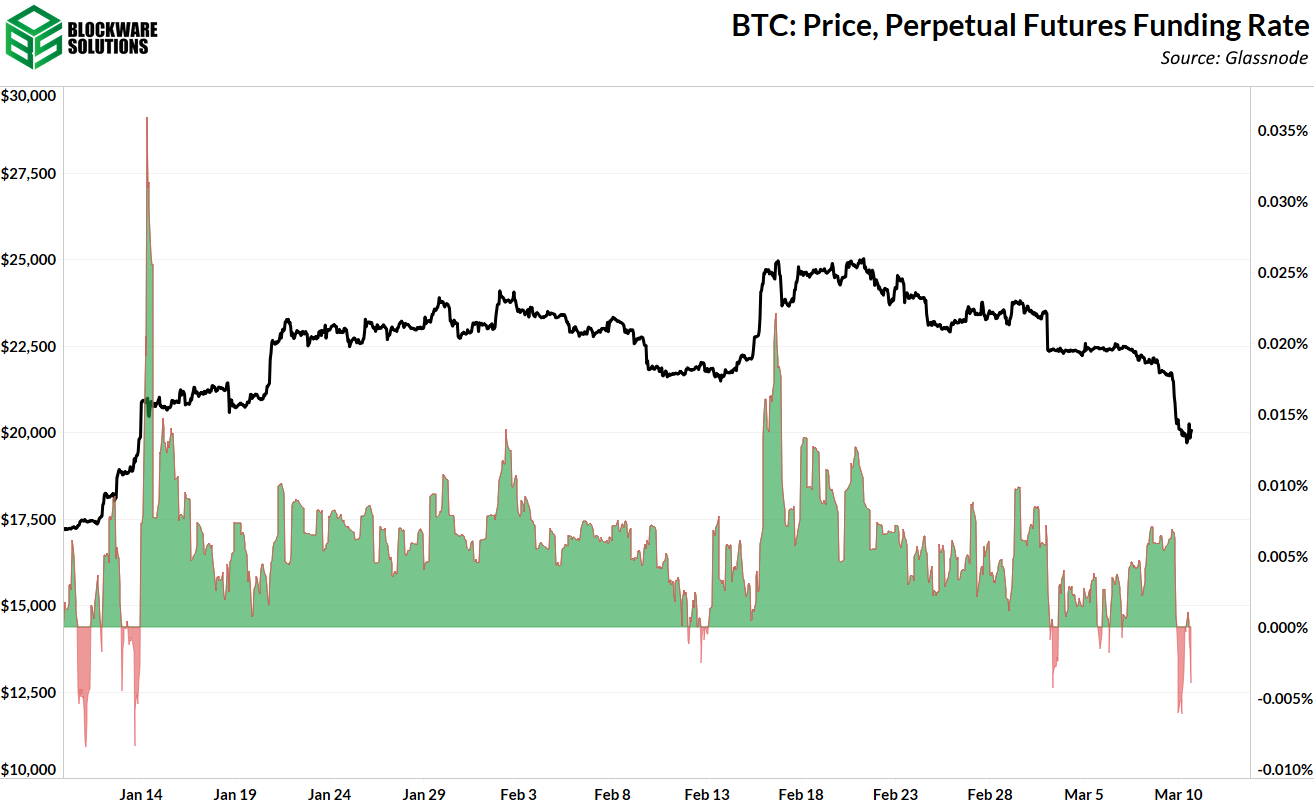
Perpetual futures funding rate has flipped negative.
BTC on-chain has returned to a regime of negative SOPR and net realized losses.
Retail sized entities have accumulated the dip.
Bitcoin’s extreme volatility creates massive opportunities in the Bitcoin mining industry.
Energy Gravity, the breakeven electricity rate for a modern Bitcoin ASIC, is at $0.11/kWh.
The estimated average BTC breakeven price for those operating modern Bitcoin ASICs is $13,366.
General Market Update
Following a fairly quiet week last week, we’ve seen a bit more of a news packed week this time around.
Some major “news” came on Tuesday, with Fed chair Jerome Powell speaking on Capitol Hill.
If you’re a consistent reader of Blockware Intelligence then you’re probably sick of hearing it, but Powell confirmed the exact thing we’ve been discussing for months, rates are moving higher for longer.
Powell’s exact quote was as follows:
“The latest economic data have come in stronger than expected, which suggests that the ultimate level of interest rates is likely to be higher than previously anticipated… If the totality of the data were to indicate that faster tightening is warranted, we would be prepared to increase the pace of rate hikes.”
This was clearly enough to inject some major fear into the market, with the VIX jumping over 5%, the Nasdaq falling 1.25%, and the 2-year Treasury’s yield topping 5.0% (more on this below).
Based on Fed Funds futures data, the market is currently expecting rates to move along the following schedule:
50bps hike to 5.25% on March 22nd
25bps hike to 5.50% on May 3rd
25bps hike to 5.75% on June 14th
Pause hikes on July 26th
Begin cutting rates on January 31st 2024
That being said, remember that these are just estimates, and will almost certainly not be 100% accurate.
Interestingly, the Canadian Central Bank, who generally follows the Fed’s lead, decided to pause their rate hikes this week and leave their market interest rate at 4.50%.
As Powell stated, economic data has largely been coming in stronger than expected, but looking at the job market, we may be seeing some signs of unemployment beginning to rise in the US.
The chart above shows the weekly percent change to Initial Jobless Claims (IJCs), or the number of Americans filing for government unemployment benefits for the first time following job loss.
As you can see, IJCs jumped over 11% last week, their largest week-over-week increase since October 2022. While a 1-week jump isn’t anything to get too concerned (or excited) about quite yet, there is both good and bad here:
Good: Unemployment may be starting to rise which could allow the Fed to pause rate hikes sooner
Bad: More Americans are unemployed and could soon indicate the beginning of a recession
On Friday morning, the February jobs report was released. Interestingly, it showed that employers added 311,000 jobs in February, well above estimates of 225,000. Unemployment rose slightly, to 3.6%, and the labor force participation rate also increased.
Alongside the rise in future rates, mortgage rates have continued rising for the 4th week in a row. As you can see above, the average 30-year fixed mortgage rate in the US currently sits at 6.65%, according to Freddie Mac.
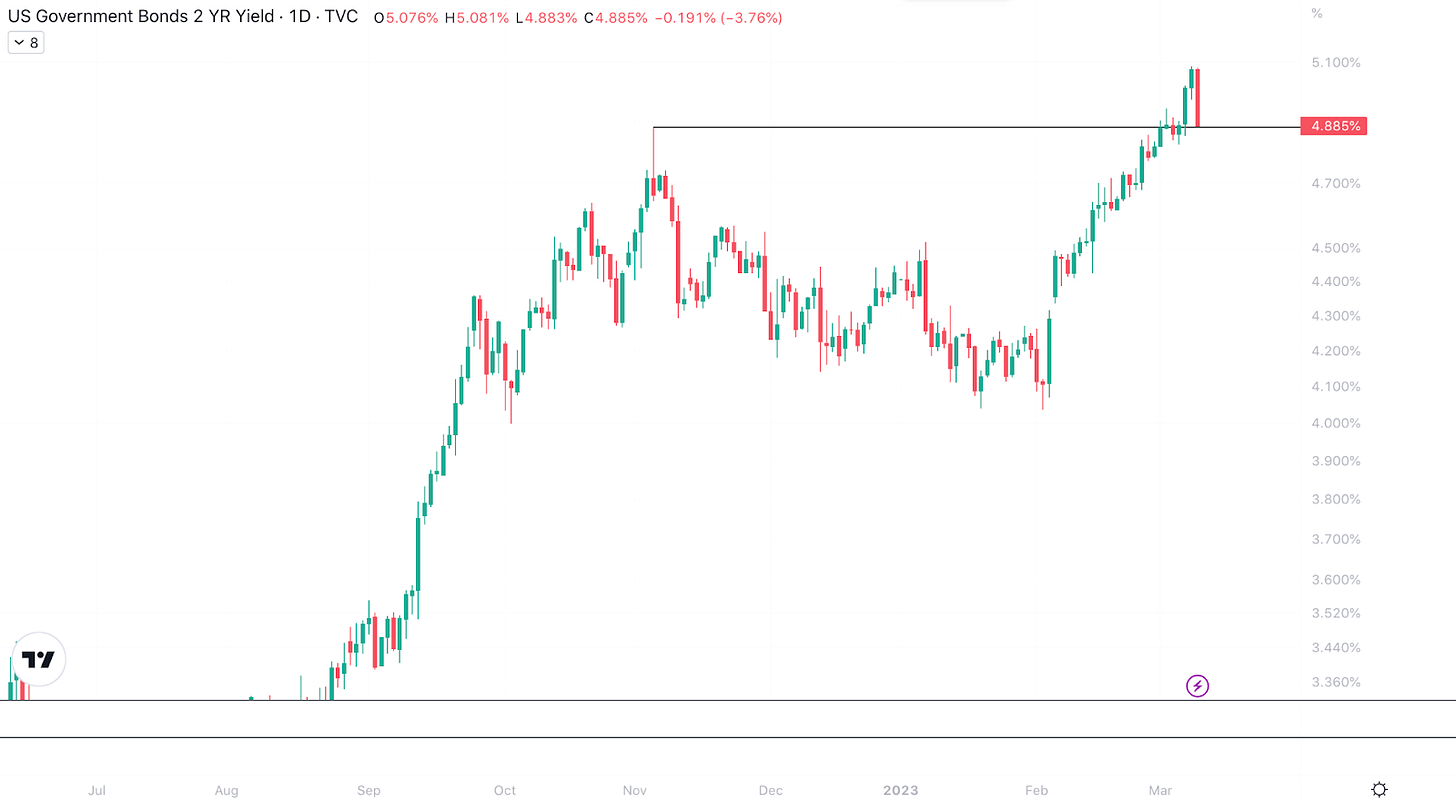
2-Year Treasury Yield, 1D (Tradingview)
As we briefly mentioned before, 2-year Treasury yields surpassed 5.0% on Tuesday for the first time since 2007. As we’ve explained in this newsletter many times before, this is a function of the market pricing in higher future interest rates.
While the large reversal on Thursday will more than likely be short-lived, we could see a narrative of lower yields and lower stock prices take shape. This narrative is textbook recessionary price action.
Generally speaking, during a recession investors flee from risk, which is why bond prices rise while stock prices fall. Whether or not this is what’s occurring is yet to be seen.
2/10Y Yield Spread, 1D (Tradingview)
Even more interesting (or concerning), is that the spread between 2-year and 10-year Treasury yields hit -1.0% on Tuesday. This hasn’t occurred since 1981.
The yield curve tells us a lot about what market participants are currently expecting from the economy in the future. Currently, the “smart money” sees significantly more risk in the short-term, and therefore, there’s a premium to pay to have your money tied up for longer.
As you may know, a 2/10Y spread below 0.0% usually precedes recessions by anywhere from 6-24 months.
For those without much tradfi experience, remember that interest rates and bond prices have an inverse relationship, and bond prices and yields also have an inverse relationship.
Furthermore, yields are used to “discount” the expected cash flows that are to be received from buying and holding a stock. If the yield of Treasuries is rising, it makes equities (and other risk assets) appear less attractive as there are more profitable, and less risky, investment opportunities available.
For this reason, when future rates are rising, we also tend to see a selloff from risk assets, such as stocks, cryptoassets, and corporate bonds.
That being said, we’ve seen surprising strength from both stocks and Bitcoin in recent weeks. But as of Thursday’s close, it appears that bulls are worn out.
Nasdaq Composite Index, 1D (Tradingview)
Following the bank run on Silicon Valley Bank, Powell’s hawkish words earlier in the week, and fears about today’s job numbers, we saw a bloody session on Thursday that left the Nasdaq down 2.05% at the close. This was the second worst day of 2023, behind February 21st’s -2.50%.
The Nasdaq was able to hold right at its 50-day SMA (Red line above) which is also around its YTD AVWAP. With the jump in yields we saw earlier in the week, and the VIX jumping over 18% on Thursday, the most likely short-term scenario is clearly more downside.
That said, prices are fairly oversold here in the short-term. While this doesn’t mean that there won’t be more downside, it does create a scenario where bulls could steal back control in the near-term.
It’s also important to remember that it isn’t a stock market, it’s a market of stocks. Watching the top weighted stocks in the indexes can give us good insights into what the index might do next.
As of Thursday’s close, the price structure of those top weighted stocks, such as MSFT, AMZN, GOOGL, TSLA, does not look bullish.
As this newsletter has been mentioning for several weeks now, there is extreme macro-risk in the short-term for risk assets. Proceed with caution.
Headed into next week, keep in mind that February’s CPI numbers are set to be released before the open on Tuesday March 14th.
Crypto-Exposed Equities
With the breakdown in Bitcoin price action this week, it shouldn’t be surprising to hear that it’s been a rough week for crypto-equities.
Alongside the bearish BTC price action, we’ve gotten some market contagion from the collapse of Silvergate Capital (SI).
For those who might not be aware, Silvergate is a bank that provides services to crypto-related companies, as well as providing the Silvergate Exchange Network for asset transfers.
We discussed Silvergate in this section last week, stating that their insolvency was “all but confirmed”. This week, on Wednesday, Silvergate announced that they would be liquidating the bank and closing down operations.
With the pace of rate hikes moving at an extremely fast pace, bank profits can eventually take a hit as less and less borrowers seek loans. Furthermore, Silvergate is tailored to the crypto industry, where borrowers have defaulted or become insolvent left and right.
All these factors, plus many more, have led to a simple outcome for Silvergate: liabilities > assets.
As we’ve seen historically, with 2008 being the most recent example, bank collapses can have a domino effect. With significantly fewer players in the crypto-banking industry than in traditional banking, it creates a severe risk of a systemic tech-banking purge.
This has already begun to occur with Silicon Valley Bank (SIVB), seeing a massive deposit drain on Thursday. SIVB is a major player in the world of venture capital, and tech startups
Long story short, a compression of liquidity led to SIVB having to sell bonds and raise capital in order to have enough cash to match deposits. Depositors, in fear of insolvency, then piled out of SIVB, exacerbating the liquidity issue.
Once again, proceed with caution.
Per usual, the table above shows the Monday-Thursday price change of several crypto-equities in comparison to their average performance, and that of BTC and WGMI.
Bitcoin Technical Analysis
Following last week’s breakdown below a lower trendline, we’ve seen cascading liquidations this week.
Bitcoin/US Dollar, 1D (Tradingview)
$21,500 was the support zone that we identified last week as a likely spot for buyers to re-enter the market. Buyers were able to defend this level for ~16 hours on Thursday, before sell pressure was finally able to overwhelm.
The result was a cascading long liquidation down to another key support level at $19,500. At the time of writing, BTC is getting a bounce off this level.
The $19.5K support zone is right around the convergence of both its 200-day SMA and its Volume Weighted Average Price anchored off the cycle lows from 11/21/22.
Below $19.5K, our team sees $19.1K and $18.4K as the next two likely support zones.
Bitcoin On-chain and Derivatives
Three metrics that have typically served as support when BTC is crawling out of a bear market: realized price, short-term holder realized price, and the 200-day moving average, are all sitting at ~$19,700. At the time of writing, BTC sits just above that at $19,800.
So far, the hourly candles have tested support and it has held. However, today’s daily close will be important. This is the first test of support for these metrics since price passed them earlier this year and should they hold as support that would be evidence in favor of $15.8k being the bottom. However, if they don’t hold, it’s likely that BTC will retest the previous low.
Perpetual futures funding has flipped negative, which could be a sign of temporary relief. In recent history, negative funding has preceded upwards or sideways price action. In other words, by the time the futures market participants begin paying to go short, the bleeding is done.
If you read this newsletter consistently you already know this, but to clarify for any new readers, negative funding does not mean there are more shorts than longs (it’s always 1-to-1). It means that you have to pay a premium to go short. Inversely, a positive funding rate means you have to pay a premium to go long. This incentivizes market participants to take the less favorable side of the trade, similar to a “spread” in sports-betting.
Short-term holder SOPR has flipped negative, which tends to align with local lows. To put it simply, SOPR (spent output profit ratio) measures the price of coins when they are moved relative to the price when they were previously moved.
Thus, the coins being moved by short-term holders are, on average, being moved at a price lower than their purchase price. However, the first chart in this section shows that the price is still above the average cost-basis of short-term holders; albeit barely. Combining these two pieces of information tells us that the short-term holders moving coins right now mostly consist of those that bought the local top; we know this because the coins are being moved at a loss.
A short-term holder is anyone who has been holding BTC for less than 155 days, so this would still include anybody that bought in the $16,000 range. However, those entities are not the ones selling here because if they were, STH-SOPR would likely be greater than 1.
Looking at SOPR for the whole market (excluding coins with a lifespan of less than 1-hour), we see that we have entered a regime of coins being moved at a loss. While STH-SOPR can provide more short-term signal, aSOPR can provide more information about the broader market trend.
Throughout the bear market of 2022, aSOPR was continuously rejected at zero. We finally entered a regime of positive SOPR this year, yet it was unable to hold. This tells us that it may be too premature to say the bear market is over. We will need to see a prolonged regime of coins moving at a profit before we can make such a declaration. However, this does not exactly mean we are destined to make new lows. As stated in last week's newsletter, the base case for 2023 is sideways price action with volatility. The collapse of FTX was most likely the peak of Bitcoin/”Crypto” native contagion and capitulation.
We can interpret net realized profit/loss similarly to our interpretation of SOPR: the market has returned to a regime of realized losses, typical bear-market behavior.
However, the local peak of net realized losses pales in comparison to what we saw with the collapse of FTX. Lower lows for realized losses is certainly an optimistic sign.
Coin-days destroyed is a measurement of how many coins are moved on a given day multiplied by the number of days since each of those coins were last moved. This can provide a variety of information, what we are looking for here is capitulation and signs of a local bottom.
The notable spikes in CDD circled below were moments of mass capitulation. Juxtapose that with the recent spike and we can confirm that the coins moving right now are younger coins; the long-term hodlers are, yet again, unfazed. We are already seeing CDD begin to roll-over, which could mean we have reached a local bottom.
Previous price dips during this bear market have been highlighted by aggressive accumulation from retail. The supply of BTC held by entities with .01 -1 BTC had its largest single day increase in the past three months; continuing its recent uptrend since the price has drawn down from the local top.
While the accumulation from retail has not occurred with nearly the same intensity as during the moments of peak capitulation in June 2022 and November 2022, the overall pattern of behavior is similar and points to the idea that this may be a local bottom.
Despite all of the noise, the fundamentals of the Bitcoin network continue to strengthen.
Hashrate, total entities, lightning network capacity, and long-term holder supply have continuously pushed all-time highs throughout this bear market.
The network itself, which exists entirely apart from the BTC/USD exchange rate, has never been stronger. The strengthening of network fundamentals make the value proposition of Bitcoin, a scarce digital property that is defended by physical energy and is free from counterparty risk, all the more real; and will make it so that the next bull run, whenever that may be, will be even crazier than what any of us can expect.
Bitcoin Mining
Mining through BTC’s Volatility
Bitcoin is the only asset in the world that has experienced six 70%+ drawdowns in less than 15 years and came back stronger setting new all-time highs.
2010
2011
2013
2014
2018
2020
2022 (soon)
This is how Bitcoin adoption cycles play out:
1. Someone discovers BTC is better money
2. BTC price increases
3. Price going up attracts more people to learn about BTC
4. Price goes to an unsustainable level
5. Price crashes
6. Price falls to a level where demand finally matches supply again
7. Remaining demand comes from step 1
I expect this cycle to continue repeating until a large majority of the world recognizes Bitcoin is objectively the best money humans have ever discovered due to Bitcoin’s superior monetary properties.
As more individuals use Bitcoin as savings technology and newly mined supply decreases relative to the circulating supply, the price of BTC will continue to increase over time.
Billions of dollars worth of new BTC will be mined in 2023, but eventually that will trend to 0.
The volatility around the price of Bitcoin speeds up adoption.
Massive price increases bring in more speculators and encourage education.
Massive price declines wipe out all of those who don’t understand Bitcoin is now the best money.
As the price of Bitcoin declines 70%, 80%, or 90%, the only people left buying BTC are those that have a high conviction that BTC is the best money.
Significant declines enable people to purchase more coins, locking up additional supply, and providing kindle for the next bull run.
This volatility is quick and ruthless.
However, it speeds up adoption as both bull and bear markets encourage the adoption of Bitcoin as a savings technology (money).
Mining Failures
Bitcoin’s intense volatility has wiped out some of the largest players in the game. Core Scientific is one of the largest names entering a restructuring. This volatility is exactly what has enabled some to win big and some to lose big.
Mining Successes
The CleanSpark model was very successful.
Bull market: Build out infrastructure and sell all mined BTC.
Bear market: Buy cheap rigs.
In the future, CleanSpark can improve its strategy further.
Bull market: Build out infrastructure, sell all mined BTC, and sell all machines with hosting at a market rate. With revenue from turn-key rig sales and hosting, CleanSpark can continue building out even more infrastructure.
Bear market: Buy cheap rigs.
More capital allocators are going to attempt to capitalize on Bitcoin’s volatility and as mining rigs become a more liquid market, that brings in new opportunities.
Energy Gravity
The following chart is based on a previous Blockware Intelligence Report that models the relationship between Bitcoin's price and its production cost. The model makes it easy to visualize when the price of Bitcoin is overheated or bottoming.
Energy Gravity, the breakeven electricity rate for a modern Bitcoin ASIC, is at $0.11/kWh. The estimated average BTC breakeven price (Energy Mass) for those operating modern Bitcoin ASICs is $13,366.
All content is for informational purposes only. This Blockware Intelligence Newsletter is of general nature and does consider or address any individual circumstances and is not investment advice, nor should it be construed in any way as tax, accounting, legal, business, financial or regulatory advice. You should seek independent legal and financial advice, including advice as to tax consequences, before making any investment decision.


