Blockware Intelligence Newsletter: Week 46
Bitcoin on-chain analysis, mining analysis, macro analysis; overview of 7/8/22-7/15/22
Blockware Intelligence Sponsors
If you are interested in sponsoring Blockware Intelligence email: sponsor@blockwaresolutions.com.
Blockware Solutions - Buy and host Bitcoin mining rigs to passively earn BTC by securing the network. Don’t buy the dip, mine the dip.
Know someone who would benefit from concierge service and world-class expertise when buying Bitcoin? Give them one year of free membership in Swan Private Client Services ($3000 value) -- email blockwareHNW@swan.com and we’ll hook it up! (And yes, you can give it to yourself 🤣)
Summary
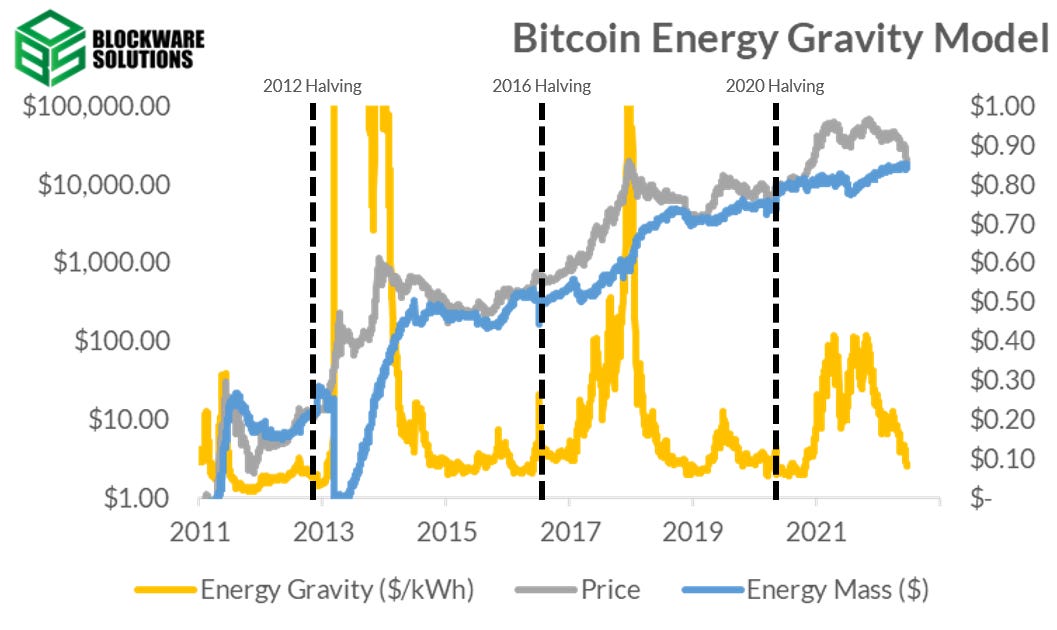
New Blockware Intelligence Report: Bitcoin Energy Gravity models the relationship between the price of Bitcoin and its mean operating cost of production for modern mining rigs.
With headline CPI coming in at 9.1% YoY, we examine the components of CPI to see why headline CPI is rising at an increasing rate while core CPI has fallen for 3 months in a row.
Alongside rising CPI comes an increased likelihood of an even more aggressive response from the Federal Reserve. We discuss one of the most fundamental relationships in finance to break down how the market could respond over the next 2 weeks.
This news appears to be hitting small cap equities disproportionately hard, with large-cap tech propping up the major equity indexes.
Bitcoin Energy Gravity Report
Key Points
1. All Bitcoins are acquired at one of two market prices: $ / BTC or watts / BTC. Both prices are increasing over time, but not necessarily at the same rate. The prices of Bitcoin grow due to increasing scarcity (time, halvings, and mining difficulty) and more users joining the monetary network due to Bitcoin being the most superior monetary technology.
2. Bitcoin Energy Gravity is the maximum USD price ($ / kWh) modern mining rigs are willing to buy electricity at to make a profit. From this maximum bid price, it is possible to get a better understanding of when the price of Bitcoin is overextended and when the price may be approaching a bottom.
3. Money itself is fascinating. For something to become money, it needs to be both scarce and well distributed. This is a paradox, and Bitcoin solved this with a predetermined Proof of Work distribution schedule that exponentially decreases over time.
4. During times of historically high energy gravity (the cost of production and the price of Bitcoin are severely disconnected), market participants act in their own self-interest to close this arbitrage opportunity.
5. When Energy Gravity decreases and the price of Bitcoin goes below some miners’ cost of production, the weakest miners purge their Bitcoin treasuries and shut off their mining rigs. Capitulations historically mark price bottoms because this large increase in temporary sell pressure (the bottom) ends with a significant reduction in day-to-day sell pressure.
6. Bitcoin is an ultra-unique commodity (due to it being actively monetized from 0) where miner operating margins regularly explode higher. This will continue occurring and Bitcoin mining will continue to be one of the fastest-growing industries in the entire world. The challenge, as always, will be able to outsurvive the weaker miners.
Read the full report here.
Bitcoin on-chain and Derivatives
Not much has changed compared to the last few letters, in regards to market valuation, momentum, etc. so wanted to switch things up a bit this week and focus on a few specific topics. The first of which is the dynamics around miners.
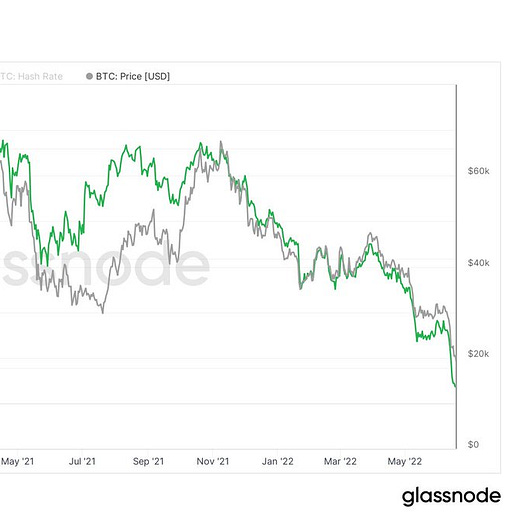
Miners are very pro-cyclical forces in the Bitcoin market. They hold their Bitcoin in the bull market and place orders for more machines that have a delay from when they’re bought to when they’re plugged in for a variety of reasons including manufacturing/shipping times and building out shelf capacity for the machines to operate. Due to this, hash rate’s cyclical peak has historically lagged the peak in Bitcoin’s price peak.
You can think of miners as being short hash, difficulty (a bi-product of hash), and energy costs; while being long Bitcoin’s price. As this ramp-up of new machines being plugged in takes place and Bitcoin’s price draws down, miners’ margins (especially those who are the least efficient) get compressed.
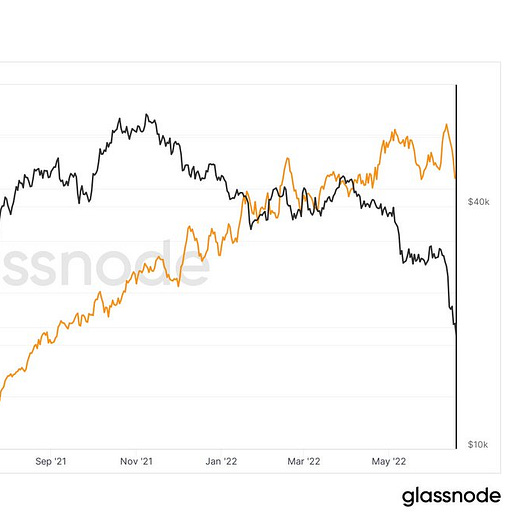
This same effect is taking place now, as machines continued to be plugged in at an aggressive rate throughout late 2021 and into early 2022, but Bitcoin spot price has declined by roughly 70%. On top of that, there’s a new variable adding to the compression which is the increased energy costs driven by supply chain issues.
We discussed these dynamics as they began to unfold about a month ago:
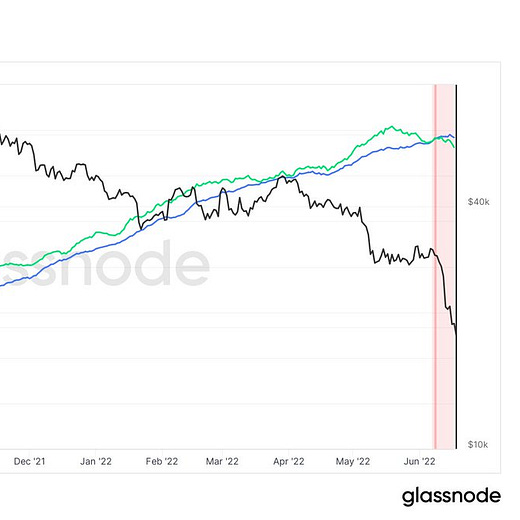
One way to look at hash rate in an actionable manner is by looking at hash ribbons. Hash ribbons juxtapose the 30-day and 60-day moving average of hash rate to create a proxy for momentum moves in miner dynamics. When the 30DMA crosses below the 60DMA it is a bearish cross; indicating machines being unplugged at a rapid rate (or miner capitulation), thus also reducing the energy cost to mine 1 BTC. A bullish cross is a cross of the 30DMA back above the 60DMA (look at late summer 2021 as an example). Currently, we have seen a bearish cross take place, indicating we are indeed in a period of miner capitulation.
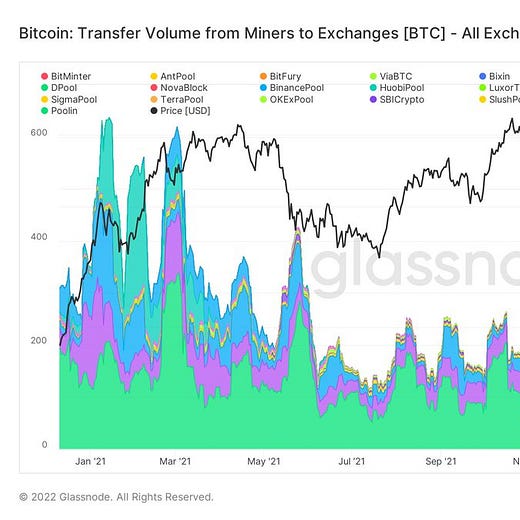
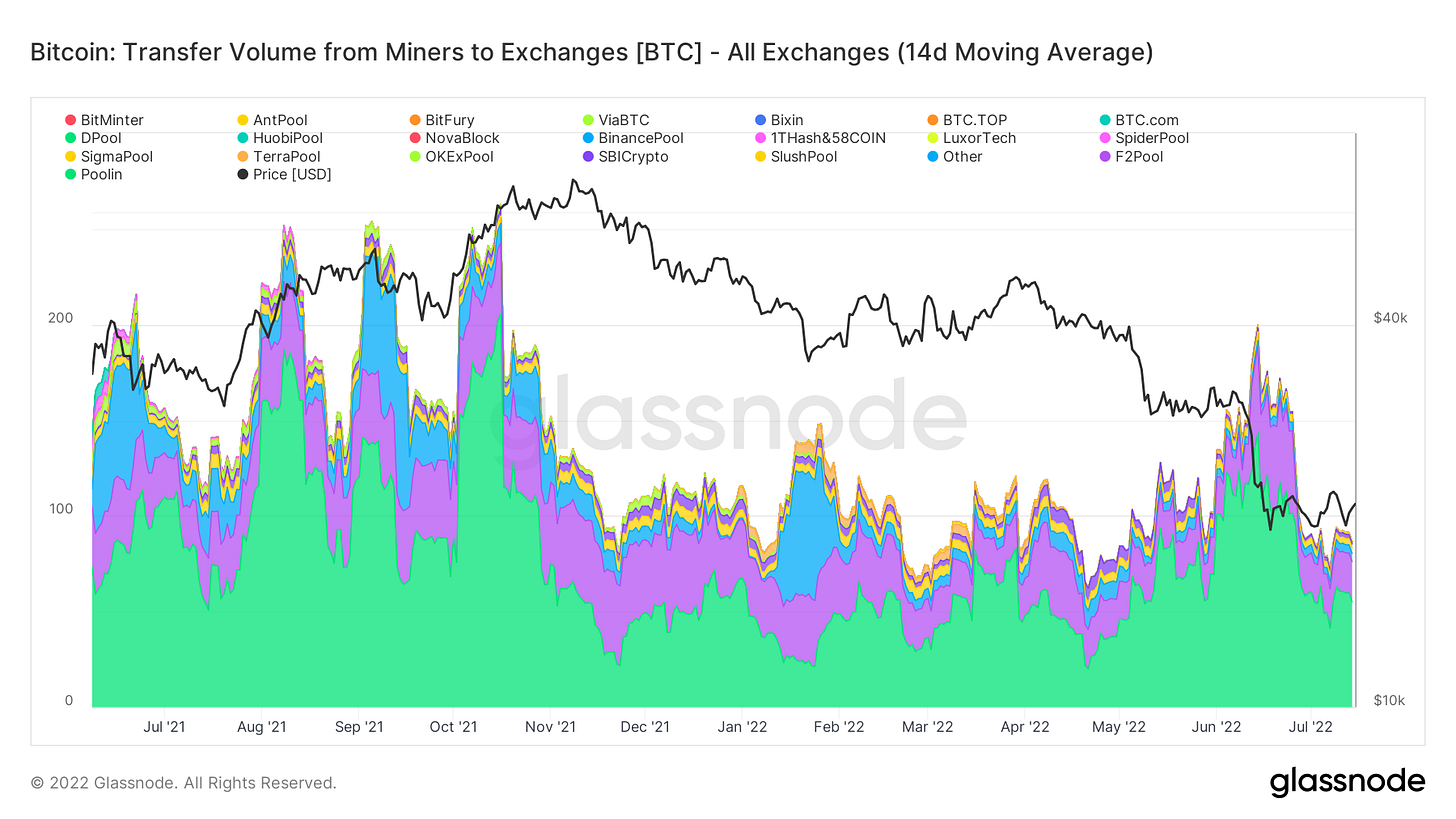
In an event of margin compression, miners may shut off their rigs that are no longer operating at a profitable first, then as last resort sell some of their rigs or even Bitcoin holdings depending on their individual situation and strategy. In addition to the hash rate decline, we have in fact seen some miners selling from an on-chain perspective as well as inflows of BTC from miners to exchanges. This behavior has cooled off a bit since, but this doesn’t mean they still aren’t under stress and could potentially have to trim off more; especially if BTC price either goes significantly lower or stays at these price levels for significantly longer.
Ultimately, we should expect the miners that do survive this bear market to come back even stronger; (as well as the Bitcoin network) including some likely acquisitions of weaker/less-conservative operations. For now though, the public market has punished mining stocks. At these depressed prices, it may not be a terrible idea to pick up some higher beta BTC exposure via these mining stocks, depending on their balance sheets.
General Market Update
It was a big week of macro headlines with the announcement of the June CPI data point on Wednesday.
In case you somehow missed it, headline CPI for June came in at 9.1% and core came in at 5.9%. While headline CPI made a 41 year high, we saw the 3rd straight month of declining core CPI.
Core CPI is CPI without counting food and energy costs, which are the most volatile components of CPI. So because core has been steadily dropping since March, while headline is climbing at an increasing rate, it's obviously that energy costs are the reason why the consumer price index is increasing.
CPI Major Category YoY Change (Bureau of Labor Statistics)
The bar chart above gives us a great visual of the 3 major components of CPI. As you can see in green, core CPI is quite low, relatively speaking. Energy costs are what are truly driving our inflationary cycle.
Much of this can be chalked up to the price of oil which is up about 27% YoY. Furthermore, at this time last year we saw oil top out and fall about 20% in about a month.
CPI is a backward looking metric, which measures price changes over the last year. If oil continues to fall in July, as it has the last month, it will only be falling roughly in line with the way it did in July 2021.
This means that CPI’s energy costs would only stay roughly the same, as oil is a major input to many forms of energy production. Furthermore, if oil stops declining, or moves sideways, we would see an increasing gap between present prices and prices from 1 year ago.
But, of course, CPI takes into account more than just oil prices and anything is possible, but just by examining the world's largest form of energy, I find it hard to believe that we don’t continue to see higher CPI values.
CPI: Energy in US City Average (FRED)
Another way to visualize the aggressively rising energy prices is to look at CPI of just energy prices in US cities. As you can see above, this index is at all-time highs and is almost 23% higher than its previous peak in July 2008.
But as I like to mention here, CPI has a plethora of issues in its methods of calculation, as you can read in this thread. So while it may not be an accurate representation of how the prices of goods have risen in aggregate, it is used by the Federal Reserve, trading algorithms and financial institutions, so its impacts on the markets go without saying.
CPI is just one tool that the Fed uses to gauge how effective their monetary policy is working to complete their objective. With higher CPI for June values despite the largest Fed Funds Rate hike since 1994, we could see an even more aggressive Fed in July.
FedWatch Tool (CME Group)
The Fed Open Market Committee meets in 2 weeks (July 27) to determine the next rate increase. Based on Fed futures contracts, CME Group is predicting a roughly 81% probability of them implementing a 100bps (1%) hike in the FFR. One week ago, CME gave it a 0% chance of happening.
That would be the largest hike since 1988 and the effect on the markets would likely be massive.
That being said, Fed policies are backward looking, as they are largely based on lagging data, while the financial markets are forward looking. As we’ve explained numerous times before in this newsletter, the market for investment vehicles immediately begins to price in all news, rumors and expectations as market participants become aware of them.
Furthermore, CME data is an estimate, and has certainly been wrong before. We can make predictions and speculate on what the Fed will do but only time will tell. The decision made by Powell to move from 50 to 75bps last month was clearly not an easy one, so to abandon 75bps in favor of an extremely aggressive hike so quickly could be less likely than futures data implies.
That means that while the chances of us seeing a 100bps FFR hike are significant, the market will likely price this information in over the next 2 weeks, to an extent.
QQQ 1D (Tradingview)
Above is a chart of the NASDAQ ETF QQQ with the May CPI and June FFR hike dates highlighted. Last month, with hotter than expected CPI coming in just 3 sessions before FOMC met, there was extremely limited time to price in the increased likelihood of an increased hike.
This month will be different, as there will be 2 weeks to price in the new information, but last month is an excellent example of how forward looking tools work. Unfortunately, we at Blockware Intelligence do not have the magic crystal ball and have no idea what the market will do over the next 2 weeks.
But if the market is going to price in a 100bps hike then lower prices are more likely than not. The reason for this has to do with one of the most fundamental relationships in finance.
When interest rates rise, it makes the interest that is paid by owning bonds appear less attractive because the market interest rate is higher. Due to this fact, when interest rates rise, we usually see bonds sell off.
When bond prices are falling, their yields rise as it becomes more profitable to buy that bond and hold it until maturity. As we’ve discussed here many times, Treasury bond yields are used as the discount rate for valuing equities.
So when interest rates rise, bond yields rise, which makes the present value of individual equities lower. Therefore, if the market is expecting to see interest rates rising at an even greater rate, we would expect to see bonds and stocks pricing this in through lower prices.
But as of Thursday, this isn’t what we’re seeing. Of course, 2 days of price data is not enough to make a quantifiable decision about how the market will react to this news, but unlike last month we’re seeing some strength in the indexes.
QQQ 1D (Tradingview)
Yesterday the NASDAQ gapped down roughly 2% after the hotter than expected CPI numbers were released before market open. But essentially straight off the open, we saw a fairly strong bid that pushed the index to essentially flat on the day.
Furthermore, we saw the index able to hold the lower limit of its current wedge. Seeing institutional support instead of a break through this level is certainly not bearish.
Markets love to climb walls of worry as price action tells market participants something they refuse to believe. This is what happens at market bottoms and provides the market with the sidelined capital to go on sustained runs.
So do we believe this is the market bottom? The short answer is probably not. As we’ve mentioned in this newsletter throughout the last 8 months (and been right about) is that the market is much more likely to continue its trend than it is to break it.
Generally speaking, not getting sucked into counter-trend rallies is a good thing. You don’t have to be first to make a fortune.
Furthermore, it’s more likely that big short sellers that moved prior to the CPI announcement are fueling this run higher. Counter-trend rallies are common in bear markets, and at this stage we are, so far, simply range trading. Keep an eye on the 50-day SMA ($293.70 for QQQ) as a resistance point to signify continued chop.
While trying to find reasoning for every market move is normally a losing game, it appeared that the price action from Monday and Tuesday had priced in higher CPI values. If you opened CNBC, WSJ or Twitter all you saw were discussions of why we would see high CPI and how the market would react.
Generally, when a large number of market participants believe something is going to happen, the market will do the opposite, especially in a bear market. Because there was so much discussion about high CPI, many people sold their positions or sold short leading up to the announcement.
When the data was released, and the market’s opinion was validated, most people had already sold, leaving buyers able to push bids higher and squeeze out shorts. Furthermore, on Thursday, we saw Christopher Waller, a member of the Fed Board, state his opinion that another 75bps hike would be more appropriate. The market rallied on this news intraday.
One thing to note is that on Wednesday and Thursday, QQQ ran into sellers at its 10-day EMA (green MA above). On Friday, bulls would like to see this moving average turn into support.
IWM 1D (Tradingview)
But while the NASDAQ was able to hold its lower trendline on Thursday and close green, small cap equities were down, in aggregate, as we can see above with the Russell 2000 ETF, IWM.
When we look at the biggest market cap names in the NASDAQ (AAPL, MSFT, GOOGL, AMZN, TSLA), it’s no surprise that the index has held up. These names have held up well in comparison to the largest names in the Russell (OVV, CHK, AR, CAR).
One encouraging sign was that IWM put in an upside-reversal candle and managed to close back above its lower trendline.
But the relative outperformance of the NASDAQ further emphasizes the flight of capital away from growth into safer areas. While NASDAQ names are certainly not risk-free, the largest cap tech companies are likely not going anywhere and institutions are clearly capitalizing on the opportunity to buy them on sale, more so than smaller market cap names. We can say the same about Bitcoin.
With new CPI data comes the opportunity to examine real metrics, or data points adjusted for inflation. One of the most shocking (or not) is real wage growth, or the YoY growth in average wages compared to CPI inflation.
CPI Adjusted YoY Wage Growth (Bloomberg)
As you can see above, the spread between YoY CPI growth and YoY wage growth is at an extreme negative value. This value is in line with the mass layoffs of 2008-09 and The Great Inflation of the 1970’s and early 80’s.
While we haven’t seen the decline in employment levels that’s needed to declare a true recession, American’s are clearly hurting financially. Furthermore, if we look at the purchasing power of US consumer dollars, it’s no shock that consumer confidence is at its lowest in over 10 years, according to the University of Michigan.
CPI: Purchasing Power of Dollars in US Cities (Tradingview)
As the prices of goods rise, the amount of “stuff” that $1 can buy declines, and because real wages are declining, American’s are clearly unable to keep up with rising prices.
This likely will, or already has, trigger the destruction of demand that the Fed is aiming for. The question now will be if demand destruction will hurt profits enough that companies are forced to lay employees off in order to preserve margins.
We’ve begun to see this, to an extent, with tech giants like Microsoft, Tesla, Alphabet and Meta announcing layoffs in the last couple weeks. As we move into late July, we’re back into earnings season. It will certainly be interesting to see how earnings have changed this quarter and the approach companies are using to navigate these waters.
While this is certainly not a good thing that tech giants are laying off employees, it would be more concerning if we saw some of the largest employers in the country, like Walmart and Amazon, begin firing folks. So far we haven’t seen this.
US Initial Unemployment Claims (FRED)
As you can see above, unemployment levels are slightly ticking up but the job market is strong overall. Certainly this is a key metric that the Fed is watching when deciding monetary policy. After all, the first role listed in the Fed’s mandate is to “...promote effectively the roles of maximum employment…”.
Crypto-Exposed Equities
This week we’ve seen a continuation of relative strength in a select few crypto-equities. This allows us to judge which names are seeing relatively stronger bids and predict which names may perform best when the market turns around, whenever that is.
A few of these names appear to be: MSTR, RIOT, BTBT, MARA and CAN, at the moment.
Other than a handful of names showing relative strength, there isn’t too much to get excited about in this group of stocks. With spot Bitcoin range bound, it’s no surprise that these names haven’t made much progress. If we continue to see Bitcoin tick higher, keep an eye on those high RS names for price outperformance.
Interestingly, we've seen the correlation between Bitcoin and the equity markets reach a 1 month low.
BTCUSD 1D (Tradingview)
Above you can see the 40 day correlation coefficient (CC) between Bitcoin and the NASDAQ ETF QQQ. While the declining correlation is a trend that we would like to see continue in order to mark a full decoupling of BTC from risk assets, this likely isn’t that.
We tend to see the CC decline when the markets decline, as BTC is generally more volatile than broad based market indexes. Although they may be moving in the same direction, the larger rate of change of Bitcoin causes the CC to decline.
While a continuing decline in the CC could be a signal that the markets are getting ready to roll over again, price action is significantly more important. Current price action would indicate that we’re likely to see continued sideways price movement in this range, but of course anything could happen.
Above, as always, is the table comparing the Monday-Thursday price performance of several crypto-equities in comparison to their average, Bitcoin and WGMI.
All content is for informational purposes only. This Blockware Intelligence Newsletter is of a general nature and does consider or address any individual circumstances and is not investment advice, nor should it be construed in any way as tax, accounting, legal, business, financial or regulatory advice. You should seek independent legal and financial advice, including advice as to tax consequences, before making any investment decision.


