

Blockware Intelligence Newsletter: Week 84
Bitcoin on-chain analysis, mining analysis, macro analysis; overview of 4/15/23-4/21/23


Blockware Intelligence Sponsors
Blockware Marketplace - Buy, sell, and trade hosted Bitcoin mining rigs.
Passport is the Bitcoin hardware wallet you already know how to use. With a gorgeous design and familiar interface, Passport makes it easier than ever to self-custody your Bitcoin.
No more sitting at your computer or squinting at tiny screens. Passport seamlessly connects to your phone, empowering you to quickly view your balance and move Bitcoin in and out of cold storage.
Get yours today at:
https://foundationdevices.com/?mtm_campaign=Blockware
Use code: BLOCKWARE for $10 off!
If you’ve thrown your hands up trying to run a lightning node, relax, you’re not an idiot, It’s not intuitive and manual management means you won’t survive.
These guys are friends of the newsletter and have a limited private beta for readers to trial automated LND operations like rebalancing and channel fee management.
Email paul@encryptedenergy.com and mention us for personalized onboarding.
Summary:
The market is now pricing in another 25bps hike from FOMC on May 3rd.
Keep an eye out for “Ranking Public Bitcoin Miners: 4th Quarter 2022 Update” coming soon!
Relative to the halving and price cyclicality BTC is in a similar situation to 2019 but with a few notable differences that signal there is likely more upside to come.
High on-chain volume from young coins signals that new demand is entering the market, but old coins have little interest in selling.
Market Cap adjusted realized profits signal that the entities realizing profits are those that bought the bottom, not those that have been around for years.
Exchange balances have seen a mild increase over the past ninety days.
Stablecoin buying power relative to the Bitcoin market cap remains incredibly high.
Arkansas passed the ‘Right to Mine’ bill.
The breakeven electricity rate for a modern Bitcoin ASIC is $0.13/kWh.
At a typical hosting rate today, new-gen Bitcoin ASICs require ~$15,500 worth of energy to produce 1 BTC.
General Market Update
In terms of economic data releases, it was a pretty quiet week.
Although this week was a bit contrarian, we’ve generally seen a recessionary narrative grip the markets of recent.
Textbook recession price action is generally dictated by falling stock prices, falling bond yields (rising prices), and strong demand for gold. In 2023, this has been the playbook.
This week Bank of America announced that, according to a survey of global fund managers, the allocation ratio of stocks to bonds fell to its lowest level since 2009. This means that investors are holding high levels of bonds instead of stocks.
While this confirms a recessionary outlook, this could be bullish for risk assets. As stocks have already been sold aggressively for the last ~1.5 years, and a Fed pause is looming, we could see a resurgence of demand for risk.
FedWatch Tool, May 3rd FOMC (CME Group)

Speaking of a Fed pause, the market is now pushing back this narrative and sees one more 25bps hike in the cards. This week we saw several banks announce earnings, which were largely stronger than expected.
As you can see above, the market is pricing in a May hike with an 86% probability. This is up from ~39% just a month ago. This is why we’ve seen a rise in bond yields this week.
2-Year Treasury Yield, 1D (Tradingview)

This week we saw the 2-year yield jump by ~0.075% amid expectations of higher rates to come.
Rising yields are generally bearish for risk assets, as we saw this week. Interestingly, the Nasdaq held up quite well despite the Treasury sell off.
Nasdaq Composite Index, 1D (Tradingview)

On Tuesday, the Nasdaq attempted to move higher but ultimately ran into sellers around YTD highs. Despite gapping down on Wednesday and Thursday, price action was pretty flat on the week.
A break above the trendline shown above on strong volume would be excellent confirmation of a potential new bull market forming. Next week, keep a close eye on that level.
Bitcoin-Exposed Equities
Back by popular demand…

Next week we’ll be releasing an updated version of “Ranking Public Bitcoin Miners”, which was originally released in February using Q3 2022 data. You can read the original version here.
This report uses data pulled from public miner’s balance sheet and income statement to rank each firm based on their liquidity, solvency and profitability.
This version will be updated using Q4 data that has been released by these firms over the last month or so. Keep an eye out for it!
Bitcoin Technical Analysis
After a couple weeks of strength, we have seen a retracement underway for Bitcoin price action the last few days.
Bitcoin / US Dollar, 1D (Tradingview)

Although we would’ve preferred for BTC to hold $29,000, as discussed last week, this retest hasn’t been anything outside of the ordinary (so far).
Our team sees this $28,000 spot as a likely one for BTC to hold, however below that, we could also see support being found at the 50-day SMA (~$26,800).
Bitcoin On-chain and Derivatives
In this week’s on-chain/derivatives section I am going to juxtapose this bear market recovery with the 2018/19 bear market recovery. Bitcoin has historically exhibited cyclical behavior, so analyzing where we are at in the present cycle relative to the past cycle can provide signals.
Firstly, we are 1,074 days removed from the last halving. This aligns us with the ‘bear market recovery’ phase of previous cycles.

Secondly, the current recovery is happening at a slower pace, and with less volatility, than the last cycle. This isn’t necessarily a good or bad thing, however, Bitcoin does not tend to experience low volatility for extended periods of time, which means it’s not unreasonable to expect further price recovery.
The chart below shows the percentage increase in price from the bear market bottom. The vertical line in 2019 indicates the same number of days since the 2018 bottom as we are from the presumed 2022 bottom.
Below that is the chart of six month realized volatility. Typically in this newsletter we have looked at shorter duration measurements of volatility (1 month or shorter), but this time we are juxtaposing the broader phase of recovery. The past six months have been much less volatile than the bear market recovery of 2019.


Both bear market recoveries have involved a surge in the number of on-chain transactions. The increase in demand is what propelled the price upwards as sellers became exhausted.

Coupling ‘coin days destroyed’ with the aforementioned chart of on-chain volume provides valuable signal about market behavior, a key difference between this bear market recovery and the last.
Coin days destroyed is a measure of the number of coins moved multiplied by the number of days since those coins were last moved. It essentially shows on-chain volume with an increased emphasis on old coins. Large spikes indicate capitulation or euphoria.
In 2019 coin days destroyed trended upwards during the recovery, signaling that much of the heightened on-chain volume was coming from older coins selling into the rally. Conversely, coin days destroyed has remained relatively flat throughout the 2023 recovery phase in spite of a high base transaction count. Therefore we know that a majority of the transaction volume is coming from young coins; not older coins selling into the rally. The old coins are continuing to HOLD, solidifying the foundation of supply scarcity that set the floor of the bear market to begin with.

Examining realized profits adjusted for market cap and entities further illustrates the point about older coins.
Older coins tend to have a lower cost basis, thus when they are moved, a higher amount of profits are realized. On a market cap adjusted basis far fewer profits are being realized now than during 2019.

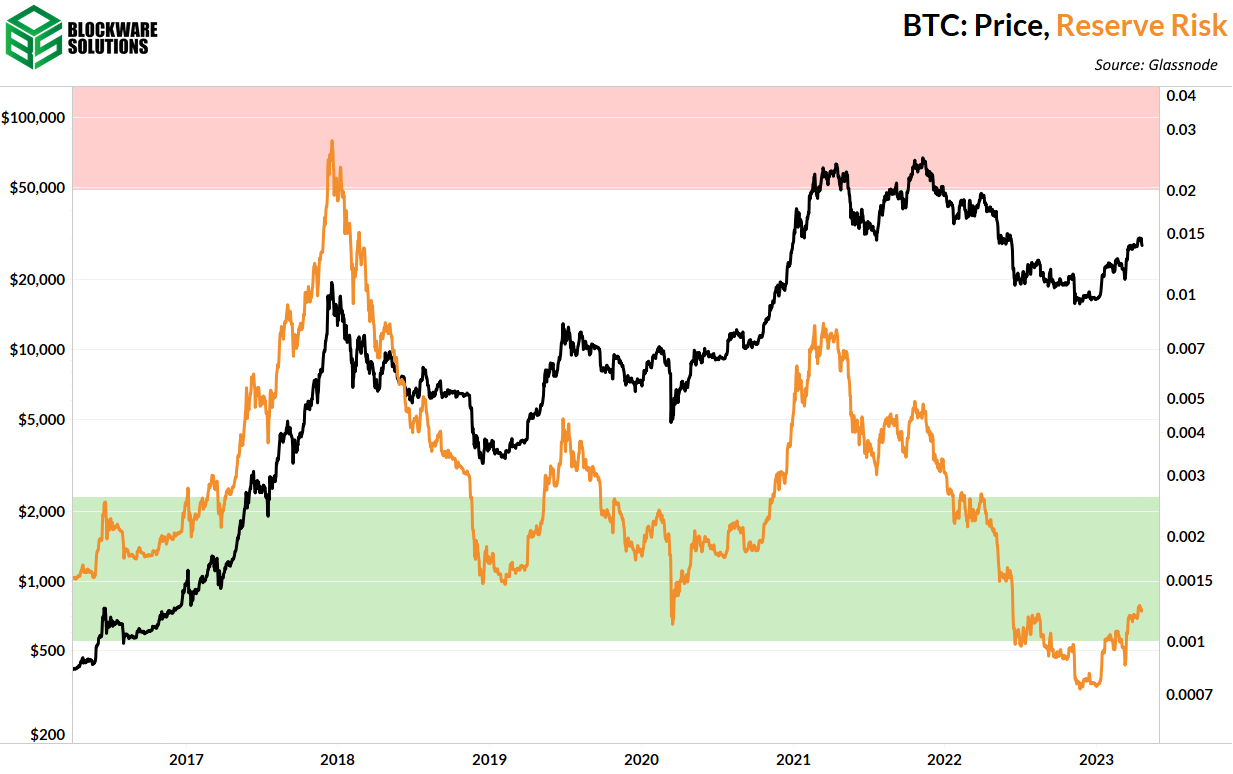
Reserve risk quantifies the risk/reward ratio of BTC at any given time based on recent price action as well as the confidence of long term holders (assessed by their willingness to sell). Low willingness to sell indicates high confidence from long term holders (opportunity cost of selling is too high to them).
The recovery phase of 2019 brought reserve risk to a level that signaled a high/risk low reward buying opportunity. Unlike then, BTC is still in a historically favorable position in terms of a risk/reward opportunity.
So far in 2023 there has been a slight net influx of BTC onto exchanges but it pales in comparison to the influx of 2019. 2022 featured the largest net exodus in exchange balances of all time. The previous largest next exodus in 2020 preceded a parabolic bull run.

Looking at the chart of total stablecoins on exchanges shows how much that market has increased. The growth of the stablecoin market means that there is more capital interested in digital assets in general. As such, it is reasonable to expect that a large amount of stablecoins will be used to accumulate BTC during a bull run.

The stablecoin supply ratio quantifies the relative buying power of the stablecoin market in regards to Bitcoin. Lower values indicate more stablecoin buying power (think of it as more kindling/dead brush ready to ignite a forest fire). Note that this chart is in log scale and the buying power of stablecoins has increased by multiples in the past four years.
The deployment of stablecoins has certainly contributed to this rally, just as it did in 2019. However, the point remains that there is far more capital in stablecoins, eagerly waiting on the sidelines for the next bull run.

Bitcoin Mining

Will hashrate drop this summer?
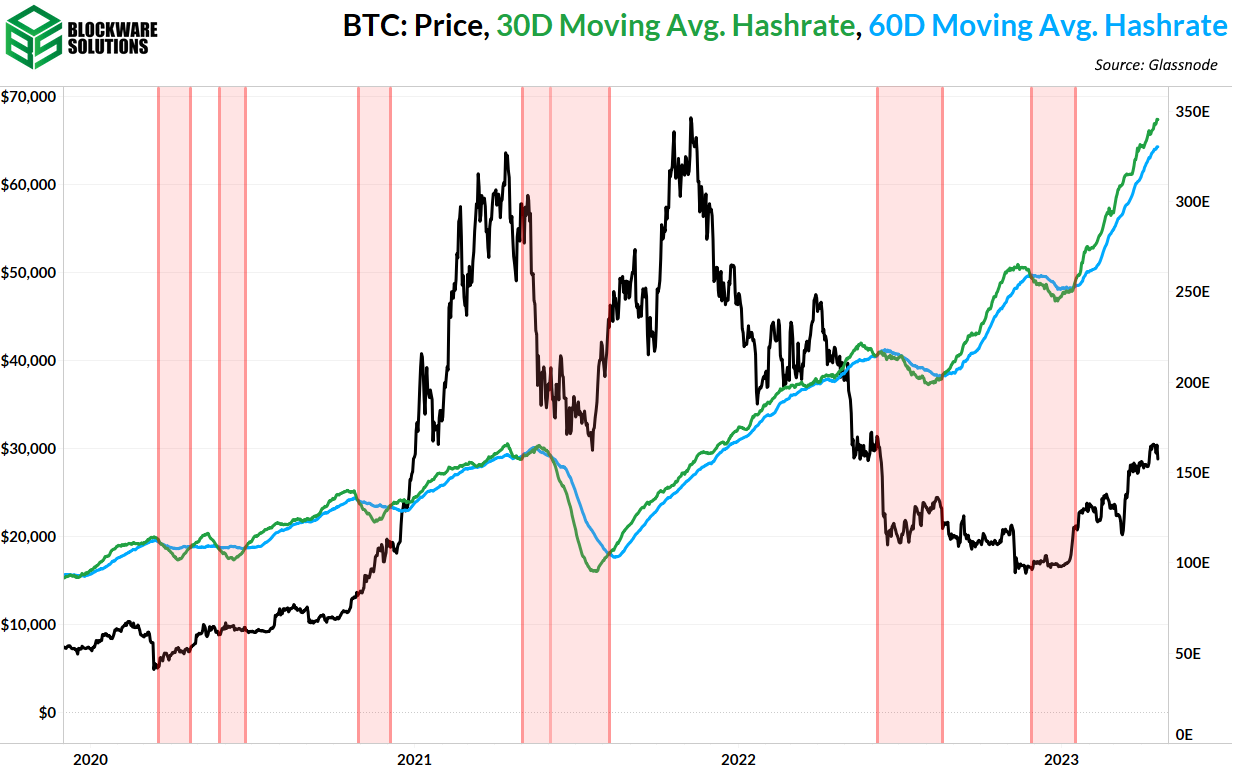
For all of 2023, Bitcoin’s network hashrate has been relentlessly trending upwards. This has been driven by new ASICs being plugged in and insolvent miners' rigs being sold and redeployed by the remaining growing miners.
However, it is important to note that network hashrate may stall or even drop in the upcoming summer months due to the demand response miners in Texas and other parts of the world turning off as people use air conditioning to combat the heat. The high temperatures in Texas during summer cause electricity prices to occasionally surge, which may make it unprofitable for some miners to continue operating for short periods of time. This situation can lead to a decrease in hashrate in the network.
The stalling of hashrate can be beneficial for incumbent miners who can continue operating. With fewer miners on the network, the competition decreases, allowing existing miners to earn more BTC rewards per unit of hashrate. This situation presents an opportunity for established miners to strengthen their positions in the market.
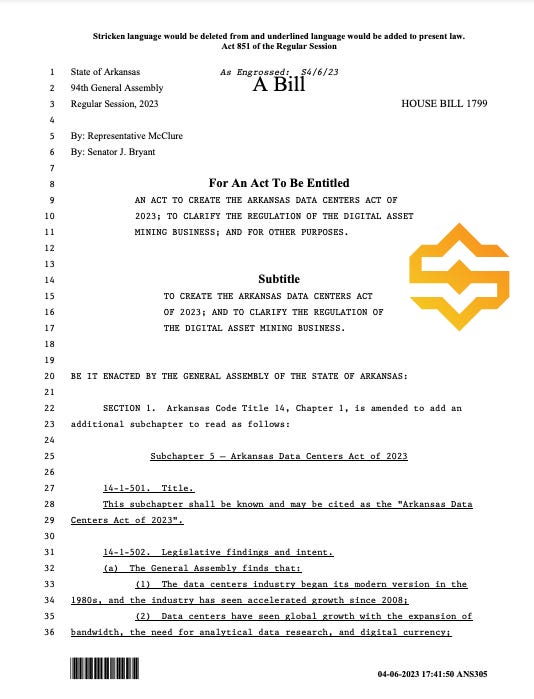
Arkansas’s ‘Right to Mine’ Bill Passed
As New York tries to ban Bitcoin mining, states like Arkansas are passing data center bills that protect the local right to mine Bitcoin. This bill was passed in the house and senate on April 6th, and it is a huge step forward for any existing or incoming miners in Arkansas.
This is a trend we will continue to see play out. Some political jursidictions will shun mining and miss out on jobs, economic growth, and tax revenue. Other political jursidictions will embrace mining and do all they can to attract this rapidly growing industry.
Energy Gravity
The following chart is based on a previous Blockware Intelligence Report that models the relationship between Bitcoin's price and its production cost. The model makes it easy to visualize when the price of Bitcoin is overheated or bottoming.

All content is for informational purposes only. This Blockware Intelligence Newsletter is of general nature and does consider or address any individual circumstances and is not investment advice, nor should it be construed in any way as tax, accounting, legal, business, financial or regulatory advice. You should seek independent legal and financial advice, including advice as to tax consequences, before making any investment decision.