Blockware Intelligence Newsletter: Week 47
Bitcoin on-chain analysis, mining analysis, macro analysis; overview of 7/15/22-7/22/22
Important Announcement from the team:
We’d first like to begin by thanking every reader of this newsletter. We’re coming up on 1 year of releasing this weekly research piece and it has been incredible to see the growth in subscriber numbers and positive response that the Blockware Intelligence team has received.
Providing the highest quality analysis and data each week does not come without expenses. In order to cover the costs of external data sources as well as to further expand the research team in the future, we will be transitioning to a paid newsletter. Starting Friday, August 5th, weekly access to the Blockware Intelligence Newsletter will require a subscription fee of $9.99 per month; with discounts available for annual subscribers as well as subscribers paying with Bitcoin.
Since launching the Newsletter last August, the value and insights have increased in quality and quantity; transitioning to a paid newsletter will allow this growth to accelerate. Moreover, a subscription based revenue model grants us the flexibility to be far more selective with potential sponsorship opportunities, which in turn will allow our content to be more transparent and unbeholden to sponsors who may have a vested interest in presenting certain narratives.
What content will remain free?
Free subscribers will still have access to the weekly Newsletter summaries as well as access to the full length Newsletter on the last Friday of each month, along with an accompanied Twitter Space. All YouTube content including the Podcast, Clips, Crypto-Equity Investing Tutorials, as well as a new series that is in the pipeline, will remain business-as-usual. The Blockware Intelligence Dashboard and the Blockware Intelligence Research Reports are unaffected as well.
Summary
We’ve seen a strong bounce across the board from risk assets this week, including equities, Bitcoin and high-yield fixed-income securities, but also Treasury notes.
This rally is likely being aided by the declining US Dollar index which signifies a falling value for the world’s unit of account.
Rising asset prices could incentivize the Fed to raise the market interest rate even higher next week, as rising investor wealth does not provide the demand destruction they’ve set out to accomplish.
Crypto-exposed equities have seen their best week in months, and with Silvergate Capital reporting strong earnings, we could see the market pricing in an over-reaction.
According to the hash ribbon metric, Bitcoin is now 45 days into a miner capitulation. The end of a miner capitulation historically marks a bear market bottom.
Mining difficulty just adjusted down 5.1% enabling remaining miners to earn more BTC.
Is hash price bottoming? It’s now back to $0.11.
General Market Update
Following last week’s hotter than expected headline CPI announcement, not many would have foreseen the extent of strength we’ve seen in the equity markets so far this week, myself included.
As discussed in this newsletter last week, it would appear that this was a “sell the rumor, buy the news” type event. In case you missed this section last week, we discussed the sell off in the major market indexes in the 2 days prior to the announcement on rumors of higher than estimated CPI.
The market almost never does what the masses are expecting, and while the overwhelming consensus among market participants is that higher CPI inflation would cause equities to crater, the market clearly had other ideas.
Equities love to climb walls of worry.
As a countertrend rally begins to pick up steam, we tend to see shorts enter and folks sell their positions for a quick gain. But if the rally has some serious legs behind it, we’ll see those same investors forced to cover their shorts or FOMO back into their positions.
QQQ Open Short Volume (Nasdaq.com)
That is exactly what we saw this week. As the rally continued, we saw upticks in short interest on the Nasdaq ETF QQQ. As you can see above, open short volume declined on Thursday as these traders were forced to take their losses and buy shares to cover their shorts.
But these changes in short volume have been relatively small this week. So while this is worth noting, there are a few other factors that have contributed to this week’s rally, as we’ll discuss below.
The underlying fear that investors have by telling themselves “there’s no way this is the bottom” is the wall of worry that stocks tend to climb at bear market bottoms. This allows the market to see steady influxes of sidelined capital as market participants finally begin to believe the price action as prices tick higher.
But now, is this the true bottom? The short answer is, I have absolutely no idea. What I do know is that markets are much more likely to continue their trend than they are to break it.
The fact that this week we’ve seen major index prices breaking multi-month downtrend lines, shorter moving averages crossing back above longer ones, individual names breaking out of sideways ranges, and T-note yields staging downside reversals makes me believe that this could be more than the short counter trend rallies we’ve previously seen in this cycle.
That being said, the 2000-02 bear market had 6 rallies of >10%, and 2007-09 had 4. The 2000 bear cycle even had multiple rallies of >50%. The market is very good at getting traders to ignore their disciplined approaches and FOMO into positions.
Although price action appears to be quite strong, it is still relatively unlikely that this is the bottom. But nobody knows, this is why if we are starting long positions here, risk management is extremely important.
Nasdaq Composite 1D (Tradingview)
On Monday, the Nasdaq attempted to break out from a multi-month downtrend and clear above the 50-day SMA (red MA above). Midway through the session, on news that Apple would be slowing hiring and suspending spending on certain projects, the index staged a downside reversal that left the index to close below that key 50-day average and trendline.
But this reversal was on relatively light volume, compared to the 50-day average volume. As the market opened on Tuesday, we saw strong upside validation as the index was able to clear through a key resistance level around $11,700. This rally has, so far, been unencumbered through Thursday’s close.
But as of Friday, we are now very extended over areas of support, such as the horizontal level highlighted above, or any key moving averages. It would appear that a retest of previous resistance at $11.7K would be likely as this area aligns with the 10-day EMA, at the moment.
Of course, the market could continue higher, but bear market rallies generally see sellers step in fairly quickly. Following a break above resistance, stocks (and indexes) love to retest those pivots and shake out weak hands. Be on the lookout for this next week moving into, or around, FOMC.
Although it is impossible to determine if equities are out of the woods, this rally does confirm a short-term rotation of capital into risk assets.
IEF/HYG 1D (Tradingview)
By comparing the prices of Treasury notes to high-yield fixed-income securities we can begin to understand exactly how tolerant investors are feeling about risk assets, at the moment.
Following bond yields is extremely important for investors of nearly all markets. We’ve discussed how bond yields affect equity valuations and prices numerous times in this letter. The bond market is the largest financial market in the US, so understanding the sentiment of the “smart money” bond traders can give us key insights into what may be to come in other assets.
IEI is an ETF that tracks lower maturity Treasury notes, specifically those ranging from 3-7 years. These securities are considered risk-free assets as the issuer is the United States government, who is extremely unlikely to default on their debt (AKA miss an interest payment due to lack of capital).
HYG is an ETF that tracks high-yield corporate debt. These are bonds that have been issued by companies in need of capital, and are rated as speculative or non-investment grade by Standard & Poor’s or Moody’s due to the fact that there is a high likelihood of the company missing a coupon payment. With the added risk of default, these bonds offer larger interest payments to incentivize investment.
High-yield securities, also known as junk bonds, are risk assets. Therefore, by comparing the prices of (or demand for) these bonds to that of risk-free Treasury securities, we can gauge the current trend in risk on vs. risk off behavior.
As you can see in the chart above, the spread between IEI and HYG has been steadily declining for over 3 weeks now. This means that we’re seeing a proportional larger influx of capital into risk assets compared to risk-free ones in the bond market.
As of Thursday, this is the strongest week for junk bonds since May, in aggregate, and is likely propelling the stream of sidelined capital into the equity markets.
Treasuries generally perform well in periods of declining economic output, as their “risk free” nature causes them to act like a sponge, soaking up capital from risk asset markets. But in inflationary bear cycles, these securities can be treated almost like a risk asset, especially longer maturity notes such as the 2yr, 5yr, 10yr, 30yr etc.
This is because in periods of high inflation, the future cash flows of these securities are being actively devalued. Why would you want to receive a bi-yearly coupon payment if you knew that the purchasing power of that capital is being stripped away?
The fact that we’ve seen declining Treasury yields (higher prices), alongside even more aggressively falling junk yields and rising equity prices is a good sign for investors who prefer risk assets, such as Bitcoin and growth stocks.
That being said, this could push the Fed to push interest rates even higher next week with a 100bps FFR increase. But we’ll discuss this more below.
DXY 1D (Tradingview)
Furthermore, we’ve seen the US Dollar Currency Index begin to cool off over the last week. The US dollar is the primary unit of account for global trade, therefore when its value is rising, it makes US exports more expensive, existing American debts more valuable, commodities more expensive in non-dollar countries, and the US government budget deficit increases in value.
DXY measures the value of the US dollar by comparing it to an index of other foreign currencies. When DXY is rising, USD is becoming comparatively more valuable than other fiat currencies.
Equities price in the above information through lower prices, as investors recognize the adverse effects of the rising USD index. This week, as DXY has declined, it appears that this has only added to the short-term renewal in confidence.
The biggest story this week, and one of the main drivers of higher index prices, is the Tesla earnings that were reported after the close on Wednesday. While at first glance these earnings show declining profitability, the market clearly did not care. TSLA reported 57% YoY earnings growth compared to 246% last quarter, 42% YoY revenue growth compared to 81% last quarter, and the first downtick in quarterly vehicle deliveries since Q1 2020.
So why am I sharing this? TSLA is the 4th largest name in the Nasdaq Composite by market capitalization, and even though AAPL, MSFT and AMZN are larger, the index tends to follow TSLA price action pretty closely.
On Thursday, the stock was up nearly 10% on +50% 50-day average volume and was able to gap above resistance around $760. This clear strength in price action dragged the indexes higher and likely ensured some investors that this rally could be very significant.
Now that all being said, we need to remember to look at the markets through the macro lens, as this environment is extremely macro driven. The current objective of the Fed is to bring down inflation by destroying aggregate demand. Higher stock prices do not help in this goal as more consumer/investor wealth generates more spending.
In this current environment, heightened asset prices only provide the Fed with more reason to aggressively push market interest rates higher. The Fed Open Market Committee meets next week on Wednesday to determine the next FFR hike.
FedWatch Tool (CME Group)
CME Group’s FedWatch Tool is currently predicting a roughly 73% probability of a 75bps hike next week. While this week’s market rally also indicates that investors are expecting another 75bps increase, the 5% jump in the Nasdaq (as of Thursday) could embolden the Fed in their decision making process.
A 1% hike in the FFR would likely bring this rally to a grinding (or potentially explosive) halt, so it absolutely is something to be mindful of going into next week’s meeting.
Crypto-Exposed Equities
What a week it was for the crypto-exposed industry group. The general illiquidity of these names means that the influx of capital we saw caused significant jumps in market price.
Volume is trending very high compared to weekly averages in many of these stocks, so this combination of relative illiquidity and high volume accumulation is what generated aggressive upside moves in several of these names.
Some of the strongest performers this week were MARA, SI and HUT, who have returned 68%, 52% and 43%, respectively, as of Thursday’s close.
While much of this move can be attributed to general market factors and preferences towards risk assets this week, we are also now in the heat of earnings season. On Tuesday, Silvergate Capital (SI) reported their Q2 earnings and the market clearly liked what they had to say with SI up over 16% on Wednesday.
SI reported nearly 41% growth in net income from Q1, and 85% growth YoY. Silvergate’s primary crypto product, the Silvergate Exchange Network (SEN), handled over $191B in transfers which was growth of 34% QoQ. Interestingly, SEN leverage commitments were actually up on the quarter from $1.1B in Q1 to $1.4B in Q2, this is in comparison to $256M in Q2 2021 (330% growth YoY).
The bullish numbers and reaction we saw from SI’s earnings call certainly helped pave the way for higher prices throughout the industry group. It’s possible that these equities are pricing in an overreaction to the poor earnings investors have been expecting from these names in 2022.
But SI is the first of the major crypto-exposed equities to report Q2 earnings, one data point is certainly not enough to make any conclusions on how these companies will have performed last quarter. Furthermore, every company is different, no matter how similar their operating objectives are.
Above is the weekly Excel table comparing the weekly performance of several crypto-native equities.
Bitcoin On-Chain and Derivatives
Reclaiming the 200WMA, this week has been Bitcoin’s largest weekly candle since April when the Luna Foundation Guard built-up their Bitcoin reserves.
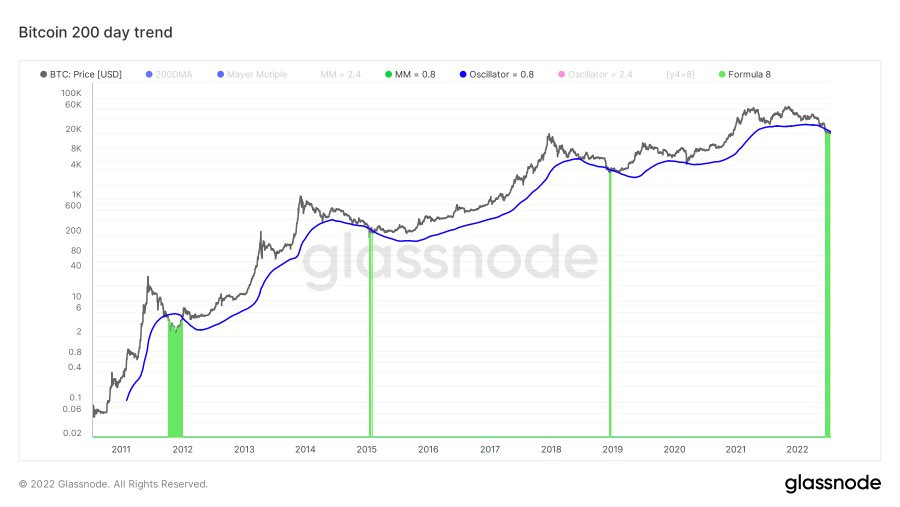
Bitcoin has seen one of its furthest deviations from its 200 day trend in history, the only times its ever been this far below are highlighted below in green:
From a daily price structure perspective, BTC has pushed above the range its traded in for the last month and retested both the point of breakout as well as the 200WMA. At the time of writing, price looks good for continuation to the levels above, but invalidation of this idea would be price going back inside the range (below the blue box) thus making this a failed breakout. Failed breakouts/breakdowns can often be just as powerful of a signal as true breakouts/breakdowns.
28K as resistance would also align with an underside retest of short term holders’ cost basis; an occurrence we saw 4 times in 2018 on the way down. The psychology of this is that whenever the cost basis is retested market participants who are underwater will look to exit the market at break even. This confluence makes 28k an even more important price level IMO.
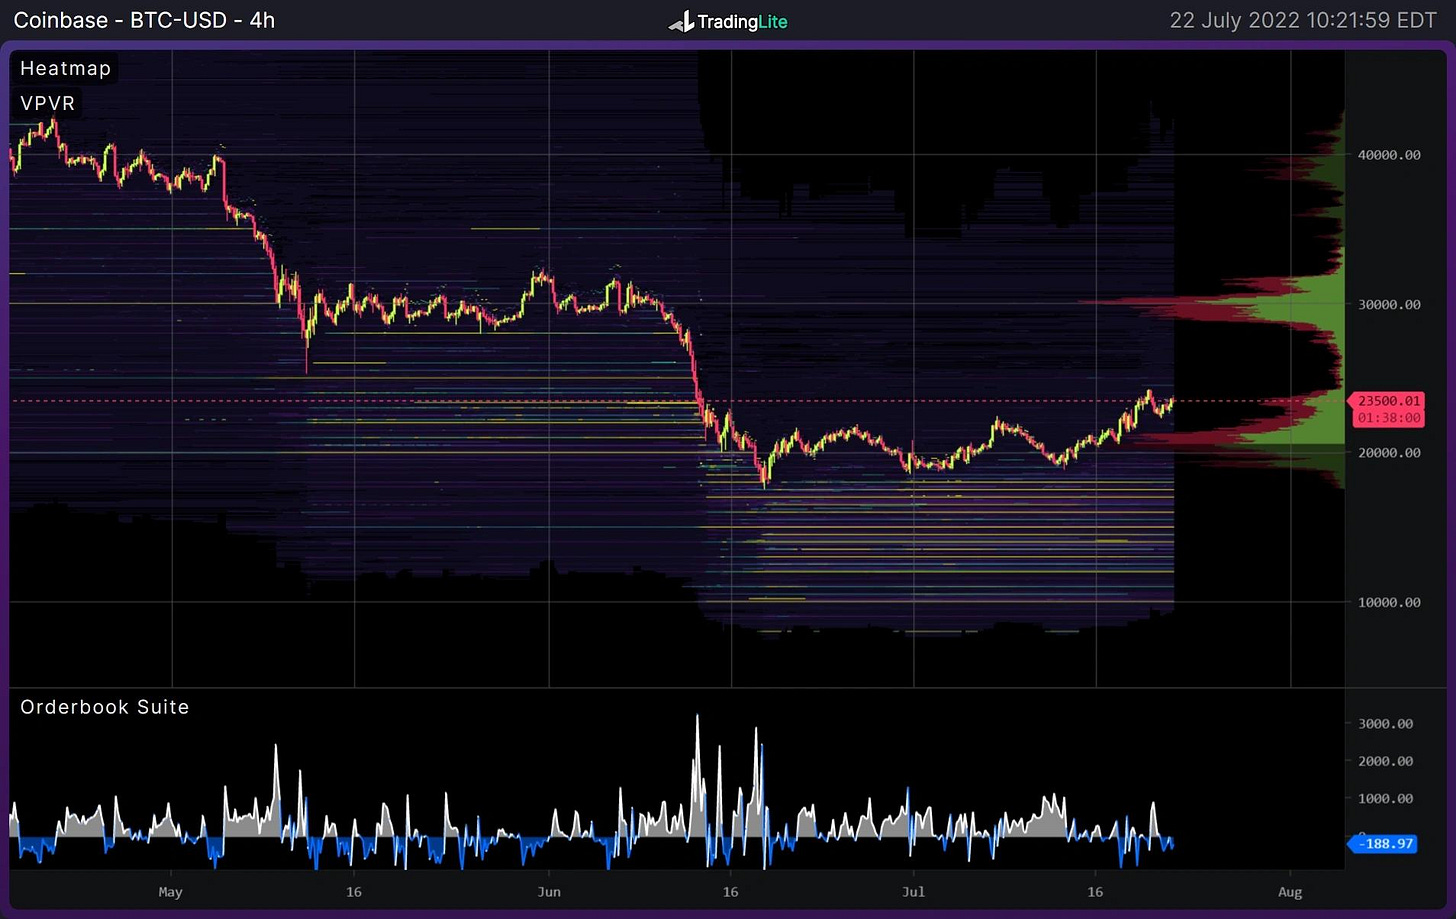
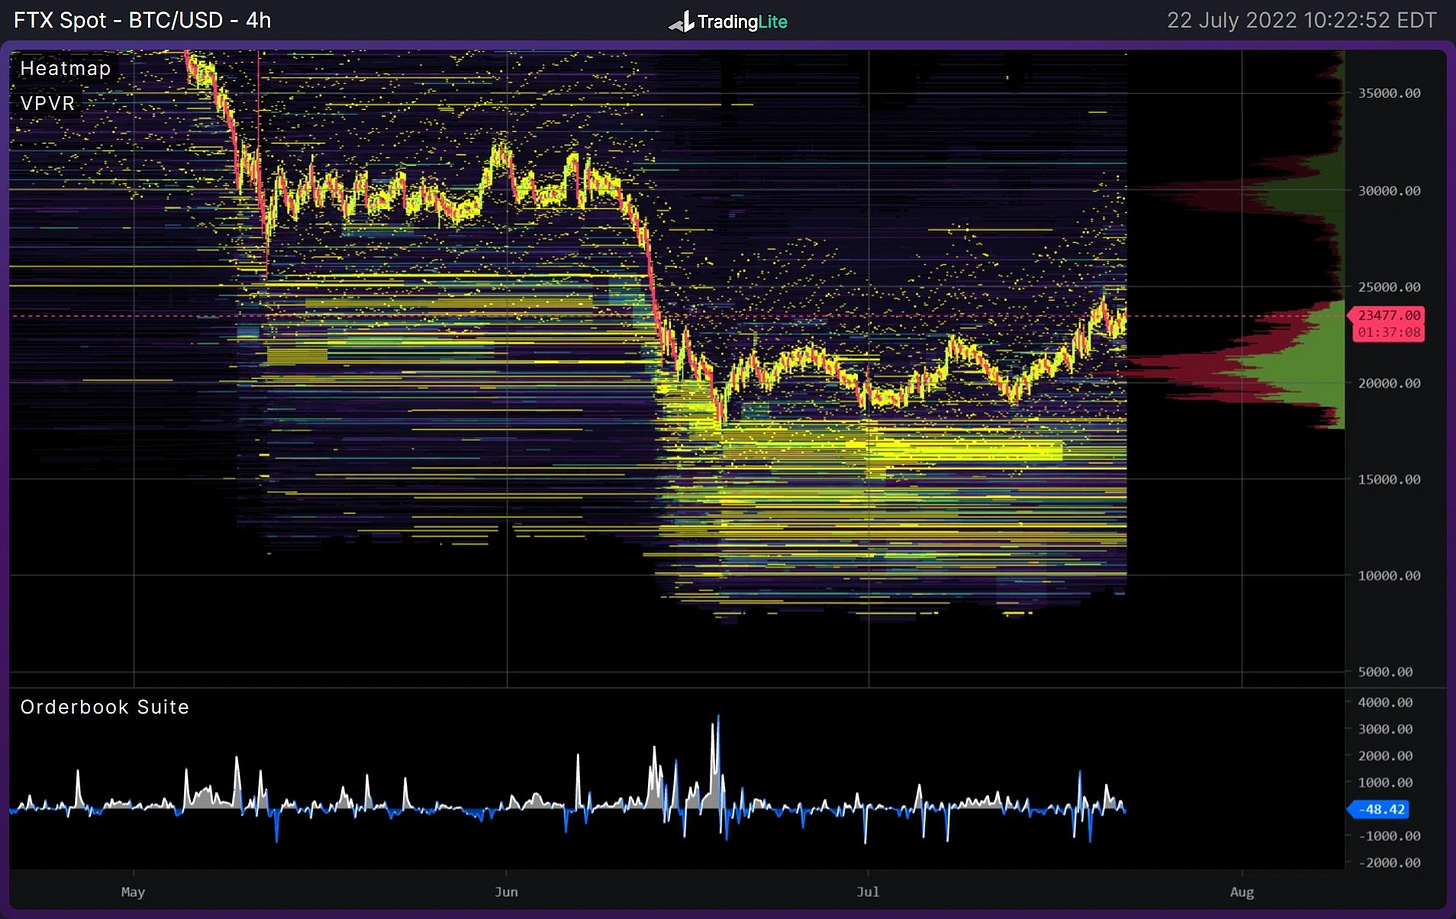
Looking at the orderbooks, Coinbase is clearly skewed to the bidside, with bids stacked down from 20k down to 10k, but no major visible clusters of asks above. Also note the volume profile between current price levels and that 28k area we talked about with the charts above. This gap in volume shows the selling on the way down was very inefficient (forced selling) and thus there is not much overhead supply in that area.
FTX spot shows a very similar profile.
On the derivatives side of things, perpetual swap open interest continues to climb in both absolute and relative terms (OI/Market cap); indicating a decent sized build up in futures contracts over the last few weeks.
When we look at funding rates as a gauge for positioning aggression, we see a mixed regime for the last month indicating a lack in conviction of expectations from the market in aggregate. In the last week funding has skewed slightly positive. With this in mind, a push back inside the range, thus making everything above a deviation and trapping longs, will likely cause a wipeout of OI. Though again, IF price can remain above that point of breakout ($22K) expectation of continuation is still in play.
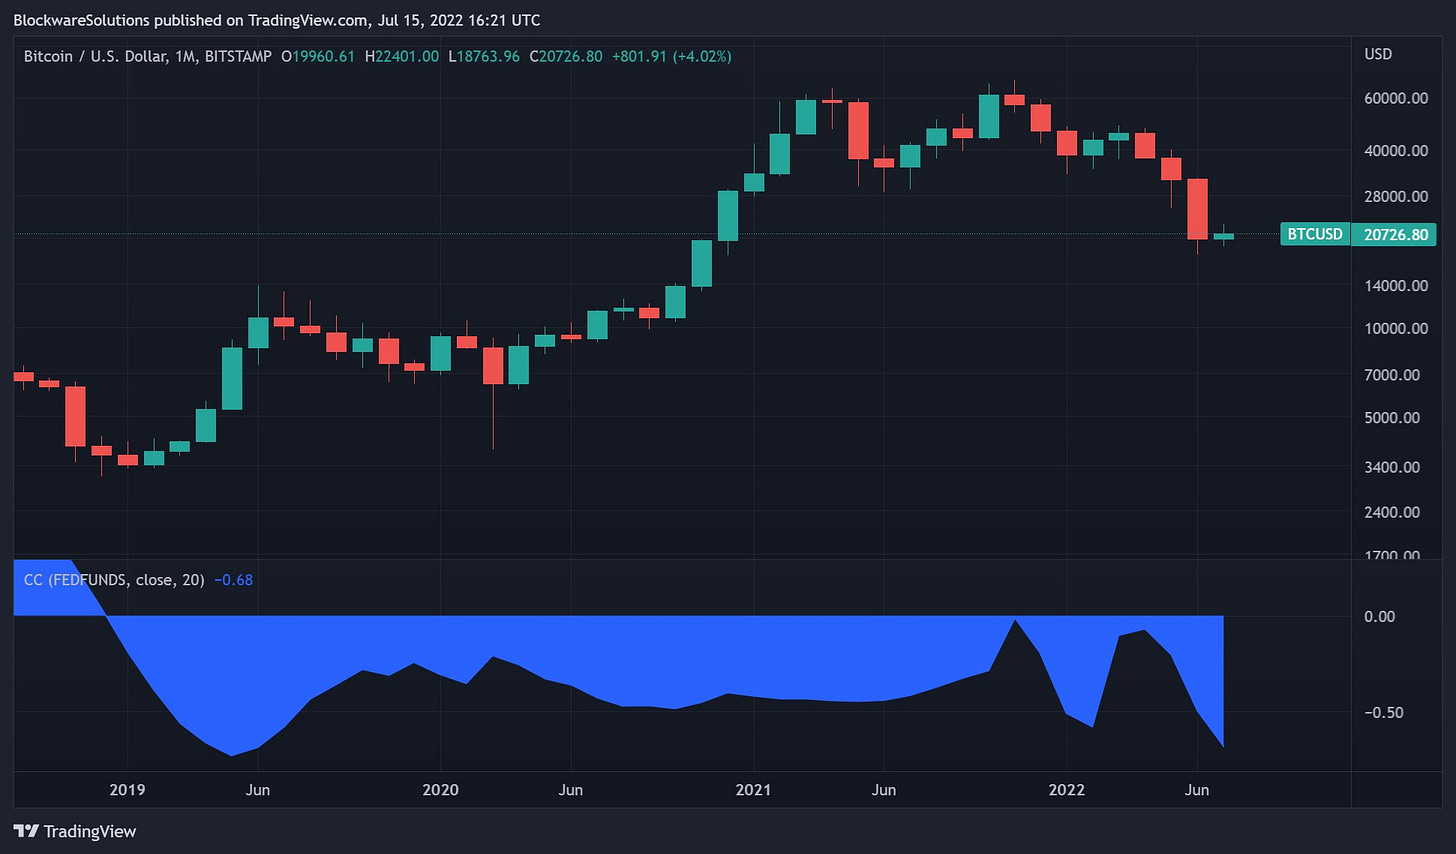
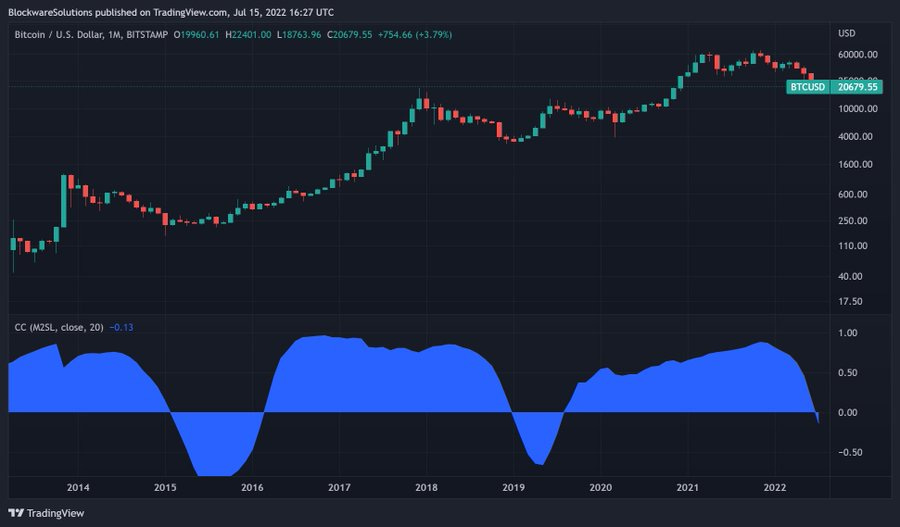
Bitcoin’s correlation to the Federal Funds Rate maintains to be almost perfectly inverse, pairing this with its correlation to M2 money supply highlights how Bitcoin is a hedge against monetary debasement
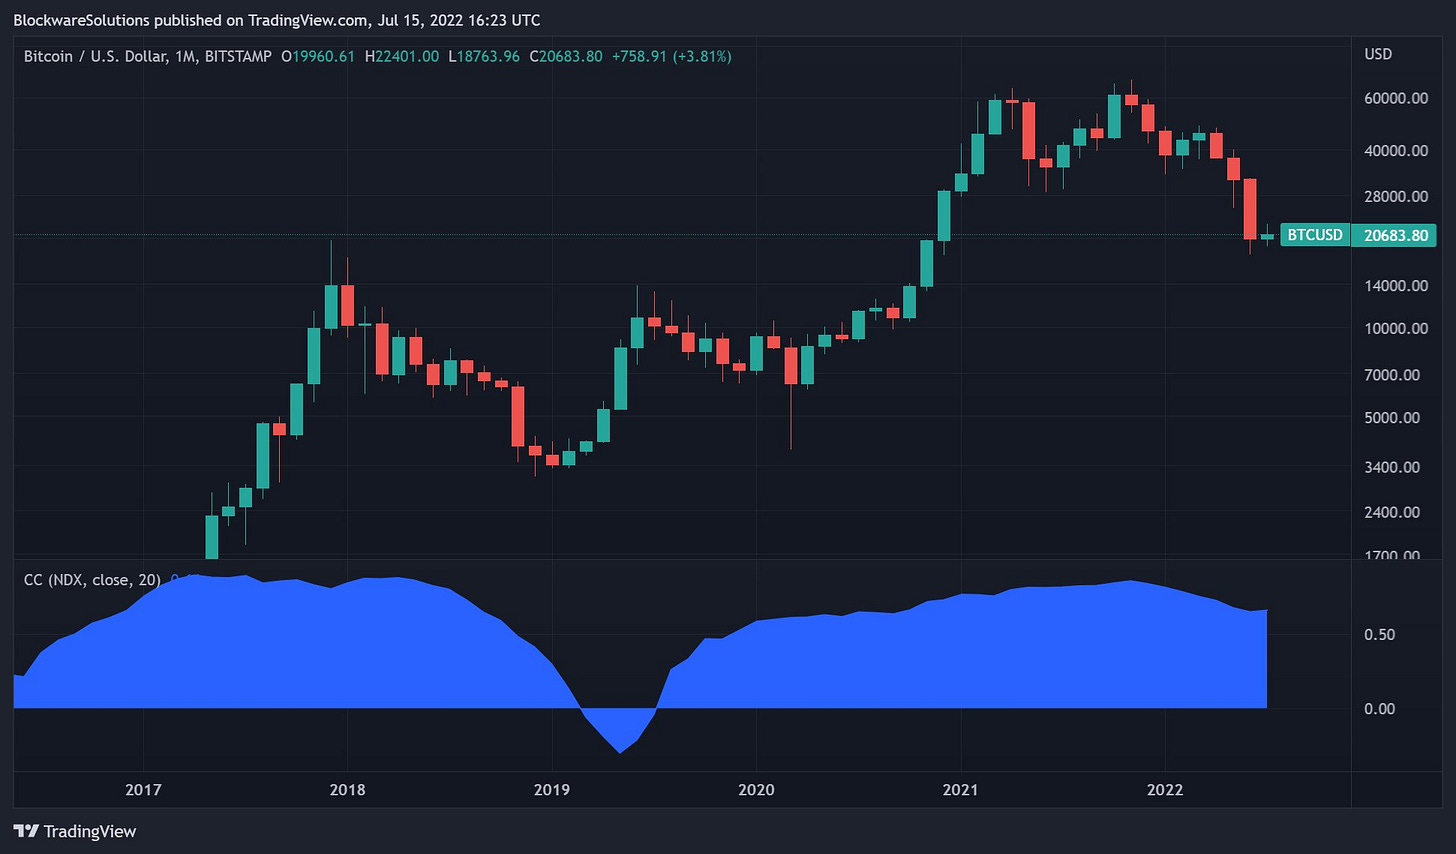
Bitcoin’s correlation to the Nasdaq also remains high.
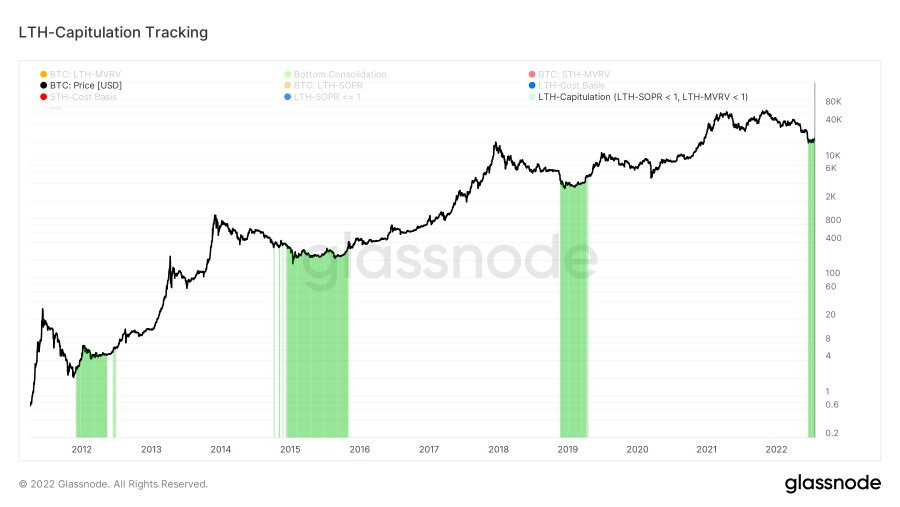
From the on-chain side of things, one metric we haven’t talked about over the last few weeks is long-term holders. Long term holders are under pressure to a degree that has only taken place a few times before: 2012 bear market, 2015 bear market, 2018 bear market. I’m defining this as when price is below long term holders’ cost basis and when coins are being spent by long term holders below the price that they were acquired.
Another we haven’t really touched on the the ratio of stable coins (USDC and USDT) market cap relative to the aggregated crypto market cap. Whenever the lower bound of this trendline is tagged, it shows that a lot of capital has been deployed into the market and there are few new marginal buyers left. Conversely, whenever the ratio reaches the top of the channel it has indicated macro bottoming/accumulation levels. So far the ratio has worked well and is starting to roll over, indicating that crypto market cap is growing faster than stables on a relative basis.
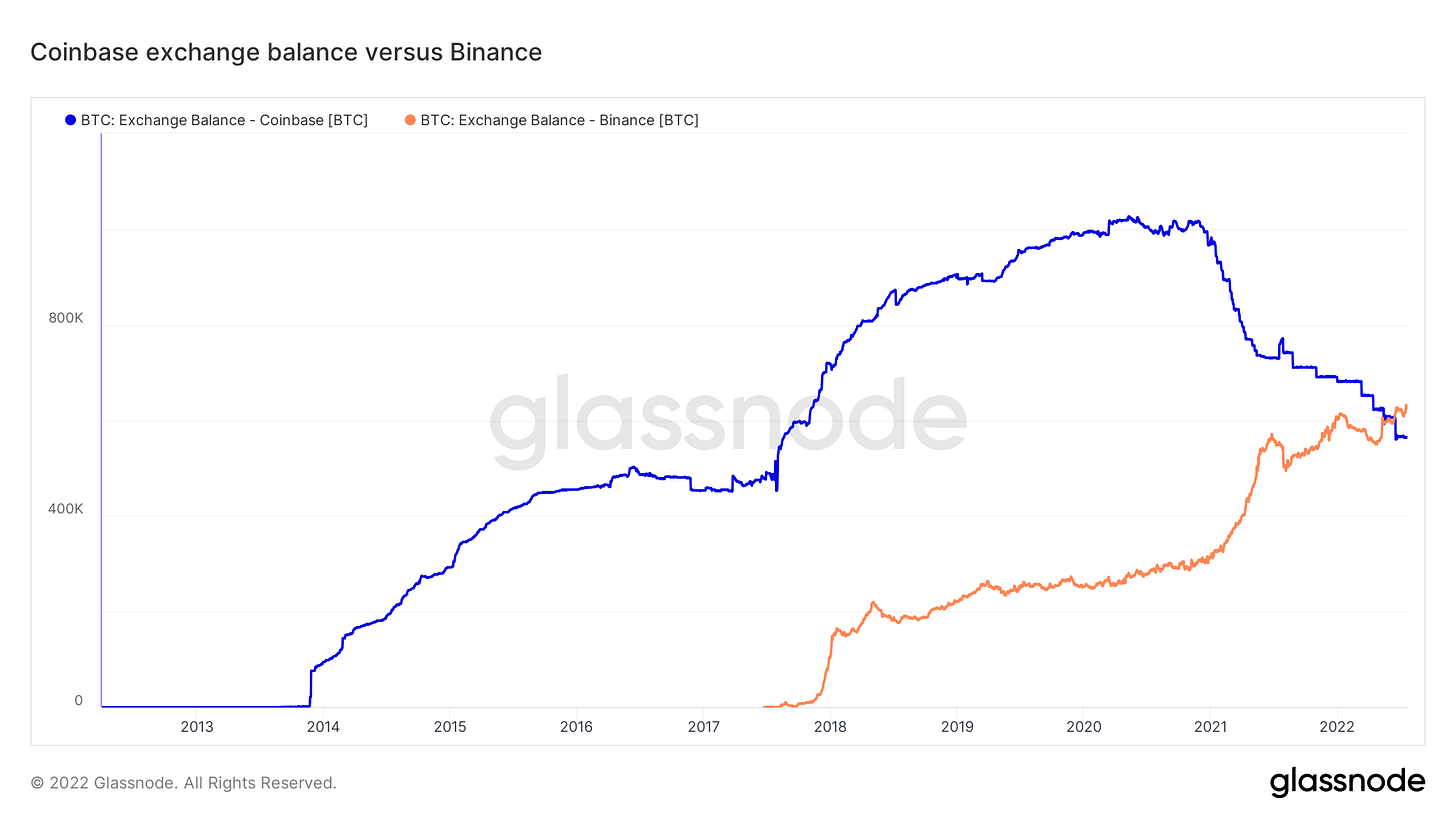
One interesting event this week has been the exchange flippening: according to Glassnode, Binance now has dethroned Coinbase for having the most spot Bitcoin on their platform.
Bitcoin Mining
45 days into the Miner Capitulation
As mentioned in previous Blockware Intelligence Newsletters, hash ribbons (chart below) indicate whether miner capitulations are occurring. Miner capitulations are when a significant net % of miners turn off machines over an extended period of time.
What looked to be a potential end of this capitulation at the start of July has only turned worse. With that said, there are many reasons to think the capitulation might not have too much further to go.
If there are no new lows in Bitcoin, we should expect the miner capitulation to end in September or October at the latest.
Difficulty Adjusted Down 5.0%
Yesterday, July 21st, Bitcoin mining difficulty adjusted down 5.0%. This was the largest downward adjustment since July of last year during the China mining ban. This now leaves difficulty 11.4% off its all-time high which was set back in May.
Falling difficulty (miner capitulation) can be attributed to two main causes.
Inefficient miners are shutting off machines.
Power curtailments are forcing miners in Texas and Kentucky to temporarily turn off.
Given that Bitcoin’s price has now somewhat stabilized above $20,000, it’s possible that this will be a bottom for network difficulty. S19XPs will soon be coming online and the weakest miners on the network have already purged. With that said, if US equities make new lows, Bitcoin likely won’t be too far behind and a rapidly falling price would certainly put extreme pressure on miners.
Hash Price
Bitcoin’s hash price hit a bottom on June 19th at $0.08. Hash price is the amount an ASIC earns per TH per day. A new S19XP (purchase them here) operates at 140 TH, and therefore it would earn $11.20 every day at that low hash price. Today's hash price is closer to $0.11, up 37% from its low, and that same S19XP would earn $15.40 every day at today’s hash price.
It’s impossible to know for sure if hash price has bottomed, but it is convincing that difficulty is dropping and the price of bitcoin has yet to make a new low in over a month.
All content is for informational purposes only. This Blockware Intelligence Newsletter is of a general nature and does consider or address any individual circumstances and is not investment advice, nor should it be construed in any way as tax, accounting, legal, business, financial or regulatory advice. You should seek independent legal and financial advice, including advice as to tax consequences, before making any investment decision.


