Blockware Intelligence Newsletter: Week 63
Bitcoin on-chain analysis, mining analysis, macro analysis; overview of 11/05/22-11/11/22
Blockware Intelligence Sponsors
If you are interested in sponsoring Blockware Intelligence email: sponsor@blockwaresolutions.com.
Blockware Solutions - Buy and host Bitcoin mining rigs to passively earn BTC by producing blocks. Purchase new S19XPs today!
Summary
Summary:
Despite Thursday’s CPI data indicating a slowing YoY inflation rate, the top 3 expenses for American’s rose in the month of October, compared to September.
With October headline CPI coming in lower than expected, we saw the best single day performance for the Nasdaq since the day after the 2020 market bottom.
The collapse of FTX has led to mass liquidations in the Bitcoin futures market.
Smaller entities have bought the dip at a record-level pace.
BTC has been withdrawn from exchanges in droves; a continuation of the trend from the past 2 years.
In terms of realized losses, this price drawdown pales in comparison to the initial drop to $20k from this summer.
Shell ($SHEL), one of the largest O&G companies in the world, sponsors Bitcoin 2023 conference.
Hashprice hits a new low of $0.058.
Mining difficulty is still not projected to significantly fall despite the price crash.
General Market Update:
Without a doubt, this has been one of the most interesting weeks in the markets we’ve seen in some time.
Let’s start off by talking about inflation. On Thursday morning, we received October’s CPI numbers from the Bureau of Labor Statistics (BLS).
Headline CPI came in at 7.7% YoY growth, this was in comparison to September’s 8.2% and lower than census estimates of 7.9%. Core CPI (CPI less food and energy) came in at 6.3% YoY growth, also 20bps lower than estimates of 6.5%.
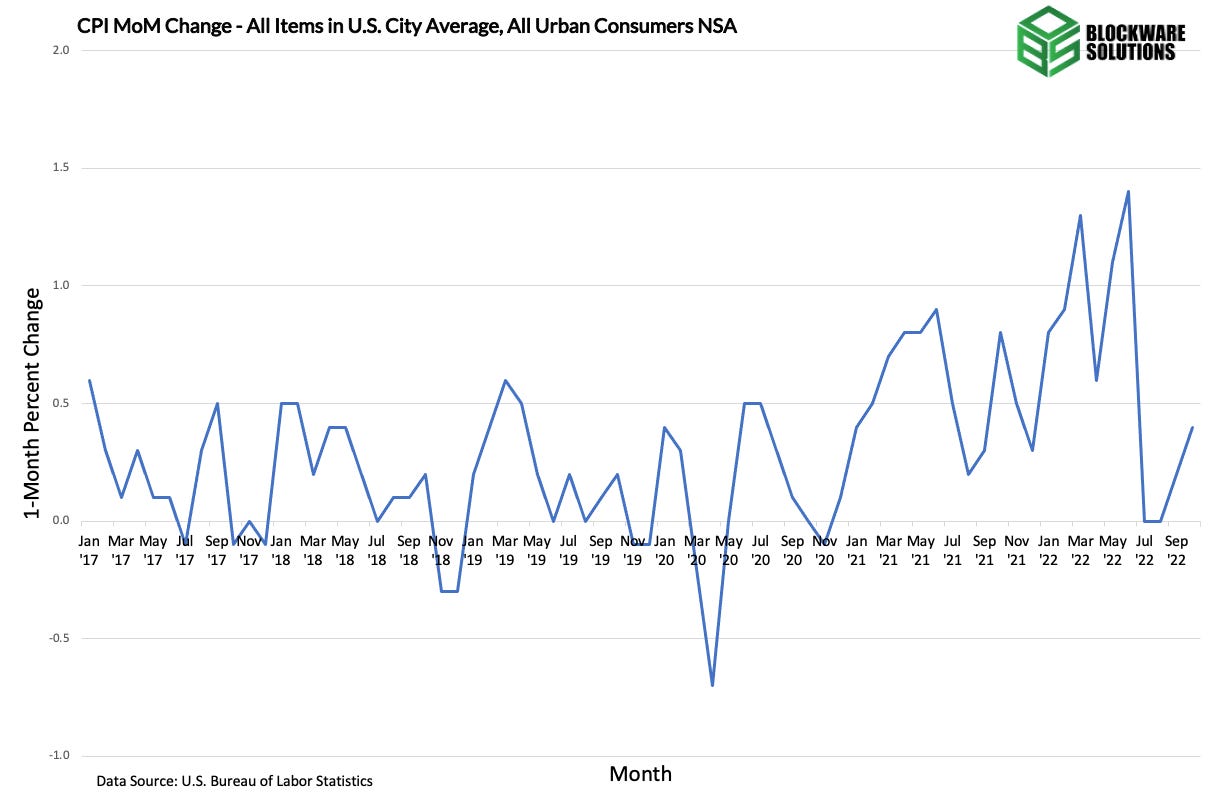
On a month-over-month basis, October headline CPI rose by 0.4%, which was also lower than market estimates of 0.6%.
As you can see above, we’ve now seen 2 consecutive months of increasing CPI, when compared to the previous month. In periods of prolonged inflation, MoM data can be very insightful.
In October 2021, we had a month of rising month-over-month inflation, at 0.8%. Because prices are higher than last year, we’ll still see highly positive YoY CPI inflation, but we’ll see the YoY change declining if the MoM change was higher 1-year ago.
But in October 2022, prices rose from September 2022, which is a cause for concern. Yes, the MoM increase was smaller than the market expected, but increasing MoM values is not a trend we’d like to see continue.
When we look at the specific components that make up CPI, we’re seeing that in the month of October, shelter costs continued to climb.
The shelter component of CPI does NOT measure the market prices for housing. Instead, it measures the cost of housing, such as rent.
The chart above shows the month-over-month percent increase to the shelter costs. In October, shelter rose by 0.75%, putting the MoM change for housing costs at its highest since August 1990’s 0.79%.
As we’ve looked at in this newsletter many times, we’re seeing a decline in average housing prices, as measured by the Case-Shiller Index. But we often see that in periods of falling home prices, rents will increase.
Rent payments are generally pretty inelastic, but in periods where mortgage rates are quickly rising, it’s not surprising that landlords would pass their rising cost of capital down to their tenants.
With the US average 30-year fixed mortgage rate near 7%, it makes sense that less American consumers are interested in buying homes, and the cost of owning or renting shelter is rising.
Furthermore, the shelter component of CPI takes into account utilities, if they are included in the tenant’s lease.
Looking at the CPI energy components, we’re seeing a YoY decline, in comparison to September. But once again, we’re seeing an overall MoM increase in energy prices.
The chart above shows 4 different components of the CPI market basket. In red is the energy component, which is comprised of electricity, gas, and oil. We can also see the MoM data for those 3 specific types of energy.
In the month of September, we saw a 10% decline in WTI crude oil prices. In October, prices were back on the rise and recovered 8%.
According to BoA, the top 3 monthly expenses for the average American are housing, transportation, and food (in that order). In October, spending on food rose in the US by 0.6% according to BLS CPI numbers.
Therefore, in summary, while declining YoY CPI values are a good sign, in the month of October, American’s saw increases to their 3 largest expenses, on average.
Now that we have an idea of October CPI, the next question to ask is, how are the markets reacting?
This week has certainly been a crazy one, with the crypto liquidity crunch spilling over into the equity markets on Wednesday.
At the close on Wednesday, it almost certainly seemed like lower prices were to come for the major indexes.
Nasdaq Composite 1D (Tradingview)
But with the lower than expected CPI released yesterday morning, we ended up seeing the best session for the Nasdaq since March 24th, 2020’s 8.12% (the day after the market bottomed).
In fact, Thursday’s 7.35% return was the Nasdaq’s 14th best session of all-time.
This could be a signal that market participants believe that inflation truly has peaked, and the buying on Thursday is a result of expectations of future interest rate decreases.
That being said, one day of price action is much too early to make blanket statements like this.
What is interesting, however, is that on Wednesday the Ark Innovation ETF, ARKK, officially undercut its 2020 lows of $33.00. ARKK reached a low of 32.51 on Wednesday, putting it at a price not seen in over 5 years.
This round-trip is a great visual to what the average growth stock has done over the last 2 years. Many of them, including most crypto-equities, topped in Spring of 2021 and have since retraced all of their gains from the year prior.
Thursday’s gain from the stock market also coincided with the most significant single day rally for Treasury prices we’ve seen since February.
US 10-Year Treasury Yield 1D (Tradingview)
On Thursday, the yield of the 10-year fell to right around 3.8%. Every maturity Treasury saw a rise in price on Thursday, excluding the 1-month.
With this fall in yields, we’re also seeing a decline in the US Dollar, as measured by the USD Currency Index, DXY.
DXY 1D (Tradingview)
There are a few reasons for the recent weakness from the dollar, but the drop in yield for US debt means that we’ll see less demand for dollars.
The combination of declining yields and DXY is historically bullish for risk assets, such as stocks and Bitcoin.
Crypto-Exposed Equities:
Despite the major rebound for BTC’s price on Thursday, it’s been a brutal week for the price action of crypto-exposed equities.
Over the last few weeks we’ve seen major solvency issues from public miners. This week, with the FTX/Binance situation (more on this below), it’s unsurprising to see that publicly traded Bitcoin companies are not rebounding in the same way that BTC did.
Counterparty risk is the major piece of why equities are treated as risk assets. Over the long term, the return associated with buying and holding shares of a company comes down to the ability of the company to turn equity financing into profits.
Poor balance sheet strategy, or unethical actions of executives, can send companies spiraling. This week has been a great example of why every crypto company is not created equally.
This bear cycle reminds me a lot of the 2000 dot com bubble. The crazy demand we saw for publicly traded crypto companies in 2020 was very similar to what happened to internet and tech companies in the late 1990’s.
In the same way that not every company with “dot com” in its name was going to be uber successful for years to come, not every crypto company will be successful either. Regardless of your belief in the future role of crypto, this week has proven that even the companies who appear strongest on the outside, can fail internally,
The way that poorly managed companies are wiped from stock exchanges during bear markets is very similar to the way that miners are wiped from the Bitcoin network during similar declines.
The result is the same, after the weak players are removed from the market, it leaves more upside to those who remain. In my opinion, this is the number one reason why bear markets are so exciting; the future opportunities are tremendous.
For this reason, we are potentially in the midst of the single greatest opportunity to begin accumulating discounted mining rigs, satoshis, and shares of public Bitcoin companies in the history of Bitcoin.
While this newsletter never provides investment advice, it should go without saying that investors should conduct proper due diligence.
For those who keep tabs on the public crypto companies, one other place to watch is BlockFi, the 2nd largest lender to publicly traded crypto-equities who was bailed out by FTX in July.
Above is the table that compares the Monday-Thursday price action of numerous crypto-exposed stocks.
Bitcoin Technical Analysis:
You probably haven’t heard, but it’s been quite the week for Bitcoin price action.
BTCUSD 1D (Tradingview)
On Wednesday and Thursday we saw the most significant declines for the price of BTC in some time. BTC’s undercut of the June lows at $17,567 led to an undercut of $16,000 on Wednesday.
BTC was able to find some buyers around $15,500 after falling to levels not seen since November 2020.
Whether the bottom has now been put in or not is anyone’s guess at this point. But Wednesday’s price action did work to validate the thesis that this section of the Blockware Intelligence Newsletter has said multiple times.
The undercut and rally (U&R) is a very common price pattern we see at the bottom of bear markets, and shorter corrections.
Many investors would have placed stop losses at the June lows, meaning that if price were to undercut that level, their positions would automatically be sold. Knowing this, whales will sell the price down to undercut this level, and then scoop up all the coins that were automatically sold.
This is likely what we saw on Thursday, characterized by the undercut of a major support level followed by a large reversal in price. That being said, just because this occurred DOES NOT mean that we can’t go lower.
At the time of writing, BTC price action is in a state of flux. While Tuesday and Wednesday’s price action leads us to believe that lower prices are more likely to come than not, there’s a strong argument that Wednesday could’ve been the bottom.
If BTC is going to continue lower, keep an eye on the 2019 highs of ~$13,900 as the next major support level. If we head higher, it’s likely that the resistance zone of $18,150-18,700 would be the first test of buyer’s conviction.
Bitcoin On-chain and Derivatives
"There are decades where nothing happens; and there are weeks where decades happen" --Vladimir Ilyich Lenin.
That quote is a great description of this week in the Bitcoin and Crypto markets.
Throughout this week, BTC dropped from $21.3k down to $15.6k and at the time of writing has retraced up to $17.7k
The main event this week, and catalyst for the negative price action, has been the developing situation with FTX. The story has been covered ad nauseam by content creators in the space, including on our recent podcast episode, but for those that have been living under a rock or those that are struggling to sort through the flurry of information, allow us to break down what caused this situation as simply as possible.
The story begins with the leaking of Alameda Research’s balance sheet. Alameda and FTX are sister companies, both under the ownership of Samual Bankman-Fried, and it is worthwhile to think of them as two entities under the same umbrella. It was revealed that a significant portion of Alameda’s assets, $3.66 Billion, consisted of FTX’s token, FTT. Furthermore, Alameda used $2.16 Billion worth of FTT as collateral for a loan. At the time FTT had a market capitalization of around $5 Billion. When half of the market value of the token is in the hands of the entity that created the token, it’s not difficult to see how things could go south.
Upon the release of this information, CZ, CEO of Binance, began playing 3D chess with his public announcement that Binance was going to liquidate their entire FTT position.
Following the CZ announcement, retail investors did not hesitate to join the madness by shorting FTT. The immense sell pressure on the illiquid token collapsed the value of FTT thus destroying the balance sheets of Alameda and FTX.
This is a developing situation and the total aftermath has yet to play out. However, it appears unlikely that FTX will receive a bailout as Binance and Coinbase have both passed on it.
Just as with Celsius, Voyager, BlockFi and others earlier in the year, investors that left BTC or other assets on FTX are learning the “not your keys, not your coins” lesson the hard way.
Check out this week’s episode of the Blockware podcast, featuring Joe Constorit, analyst at The Bitcoin Layer, to hear further analysis on the FTX fallout.
Here is an updated flowchart of all of the entities impacted by this year's contagion.
Now, let’s discuss the ramifications this fallout has had on Bitcoin on-chain metrics.
Firstly, and this should go without saying, but this has absolutely zero effect on the Bitcoin protocol. Miners are still adding blocks, filled with valid transactions, to the chain roughly every 10 minutes. Nodes are still validating those blocks.
The only thing that is volatile about Bitcoin is the USD exchange rate and the behavior of speculators/traders.
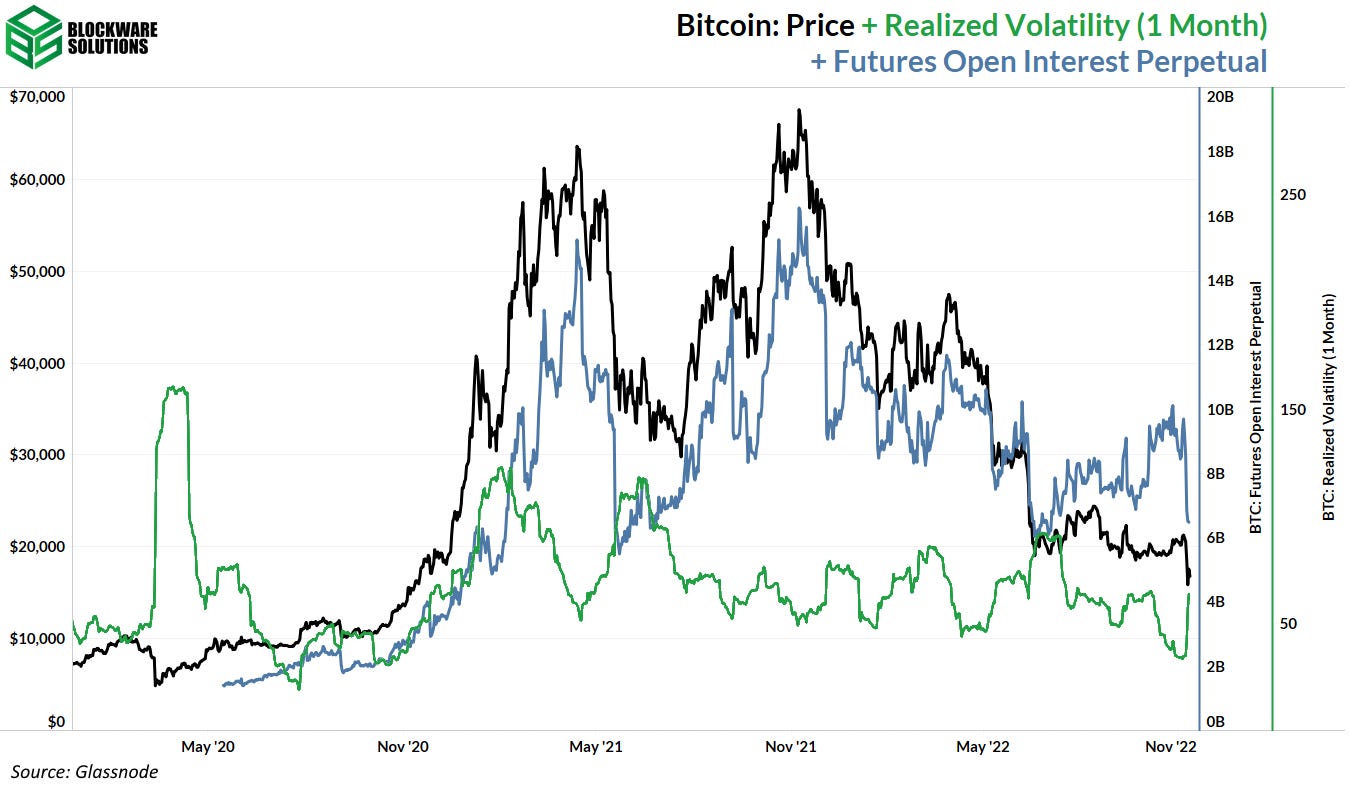
This move triggered the spike in realized volatility that we have been waiting for.
It is fair to say that the sellers here have done so involuntarily. Futures open interest has spiked down signaling a liquidation cascade.
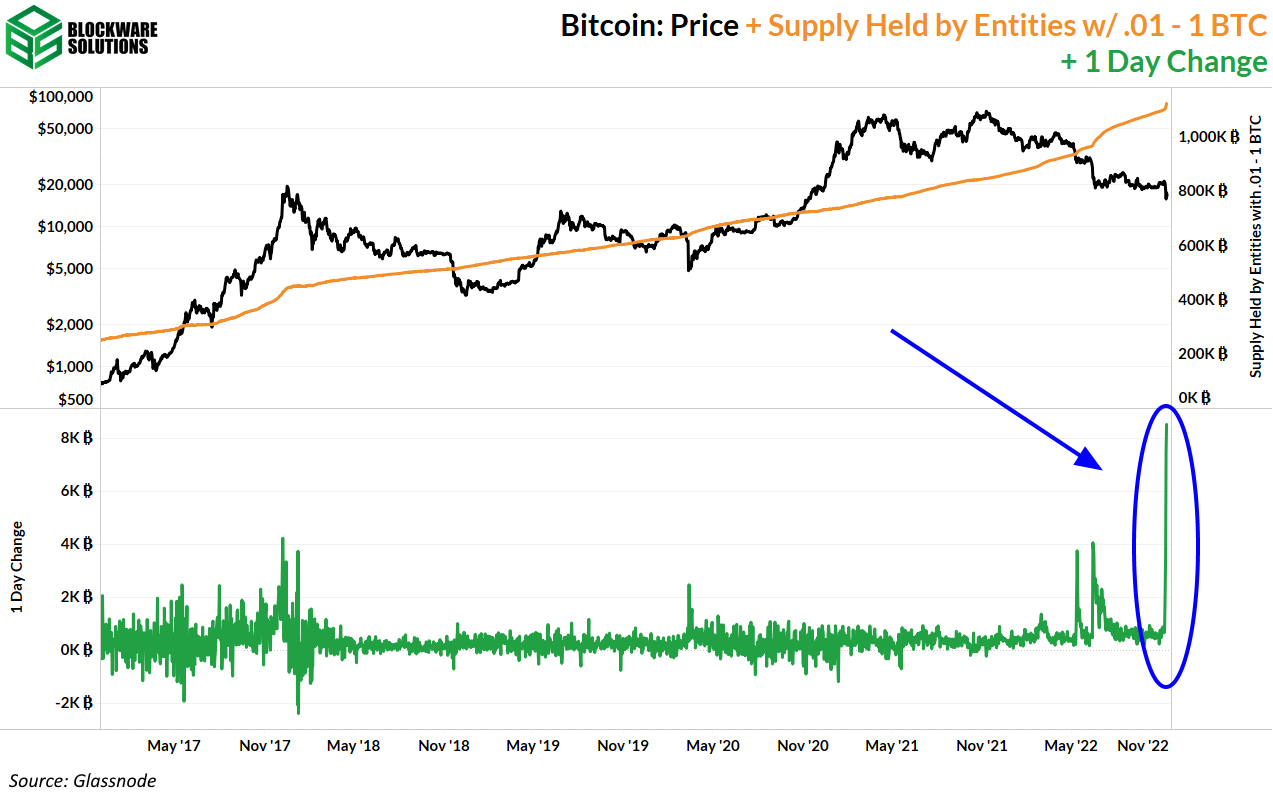
Observing the wallet balance of entities with .01 - 1 BTC we see that this cohort has continuously stacked more BTC each day this week than at any other point in Bitcoin’s history.
BTC being reallocated from over-leveraged institutions to prudent retail investors is very bullish for the long-term health of the network. Moreover, this is evidence against the FUD that whales hold all of the BTC. Even if it were true that whale holdings increase over time, it would be irrelevant as Bitcoin is not a proof-of-stake protocol.
For entities with 1 - 10 BTC, “Pleb Whales” as we shall henceforth refer to them as, have also added a significant amount of BTC to their holdings. The third largest all-time single-day increase in holdings for this cohort.
You may argue the point that the above metrics are not “plebs stacking”, but rather they are simply self-custodying. IMO, self-custodying Bitcoin IS buying Bitcoin. You have not bought Bitcoin until you receive it in a wallet for which you control the private keys to. The repeated, reckless handling of user funds by exchanges is proof that you cannot trust that these institutions actually have the Bitcoin you purchased.
For Bitcoin to succeed in the way that we all hope it does, and for the price to see serious appreciation, self-custody must become the norm for all market participants.
Fortunately, Bitcoiners taking self-custody has been increasingly common; exchange balances peaked in 2020. This trend has been reinforced by the FTX fallout. The number of exchange outflows peaked to the same levels as reached via the terra/luna/celsius, etc. fallout.
Exchange transaction dominance, which simply measures whether more deposits or withdrawals are happening at any given moment, has trended lower. In fact, recently the number of withdrawals has been greater than the number of deposits.
This is signals that: a.) more people are understanding the importance of self-custody, and b.) that fewer people intend to sell soon and the end of the bottom is getting closer.
Based on realized losses adjusted for market cap, this has not been nearly as deadly of a downward movement as this summer was. The coins moved at a loss here have been at a far lower loss than before. This is congruent with our thesis that we are most likely closer to the end of the bear market than the beginning.
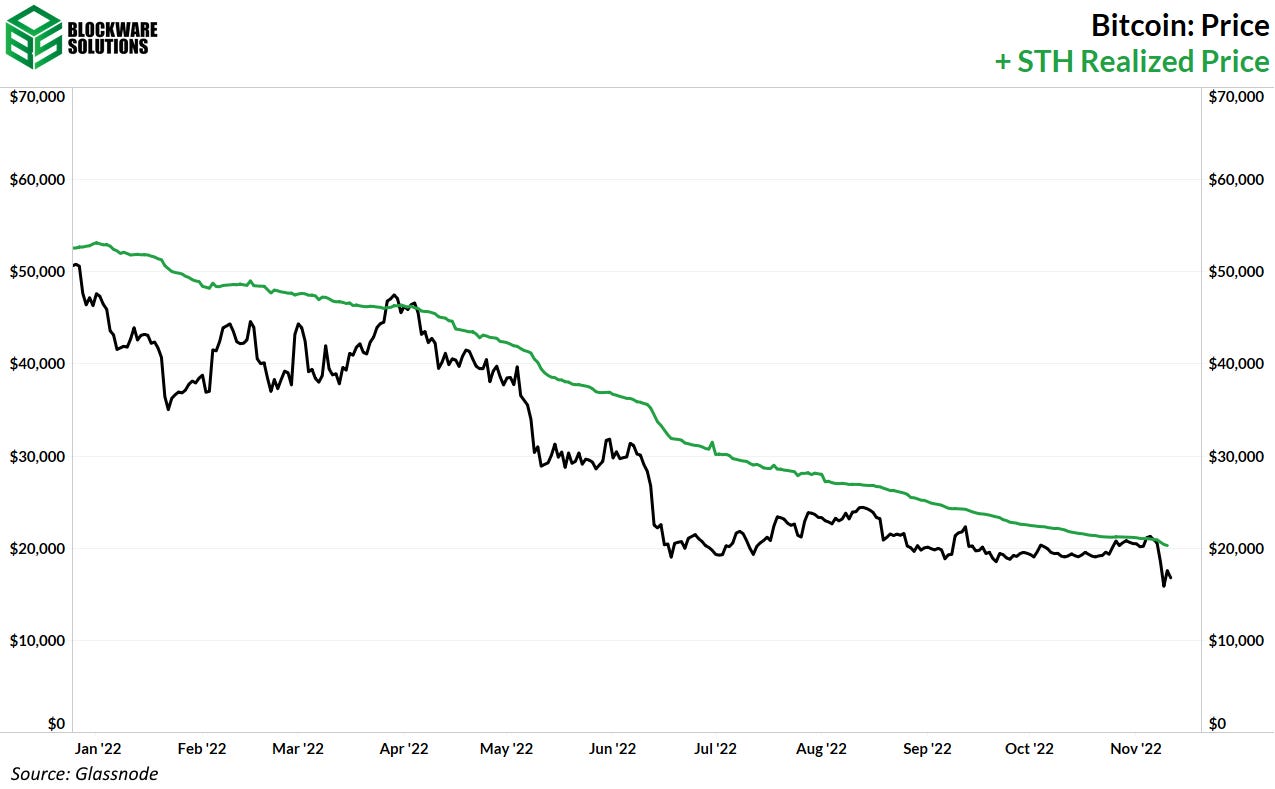
Going forward we will continue to monitor any further contagion courtesy of the FTX fallout. After failing to break through the resistance of STH RP, we will see if the next test of that level is not interfered with by the struggles of the Bitcoin-adjacent, “crypto”, industry.
Bitcoin Mining
Shell sponsors Bitcoin 2023 conference
https://bitcoinmagazine.com/business/shell-signs-two-year-sponsorship-with-bitcoin-magazine
Shell is one of the largest O&G companies in the world, and it now has sponsored the largest Bitcoin conference in the world. The Energy industry and the Bitcoin Mining industry are on a collision course, and this is likely just the beginning.
In the long run, it is logical for an energy company to vertically integrate its operations with the Bitcoin mining sector. Bitcoin mining offers a (low) time and location-independent bid for nearly an infinite amount of energy, and energy companies typically have excess, wasted energy that gets flared or ignored.
Over the past 12-24 months, the energy industry has reaped high profits from a global energy shortage caused by regulations and a lack of capital investment over the past decade. Many of these companies have significant cash on hand and are hesitant to invest heavily in more O&G production due to regulations and or a general effort to maintain a conservative financial approach amid volatile global markets.
$SHEL has ~ $37B of cash on its balance sheet. While there is no evidence of active discussions in progress, it seems likely that their M&A team has at least considered getting directly involved with the Bitcoin mining industry.
To put into perspective how large Shell is compared to the Bitcoin Mining industry, using their existing cash position they could obtain 2,100,000 BTC (at current market price), or they could acquire $CORZ, $MARA, $RIOT, $HUT, $CLSK, $BITF, $IREN, and $MIGI many times over.
Whether it is buying BTC, acquiring a distressed public or private miner, or buying mining rigs to build out their own operations, it seems more and more likely that the Energy industry will make a move into the Bitcoin Mining space.
Hashprice
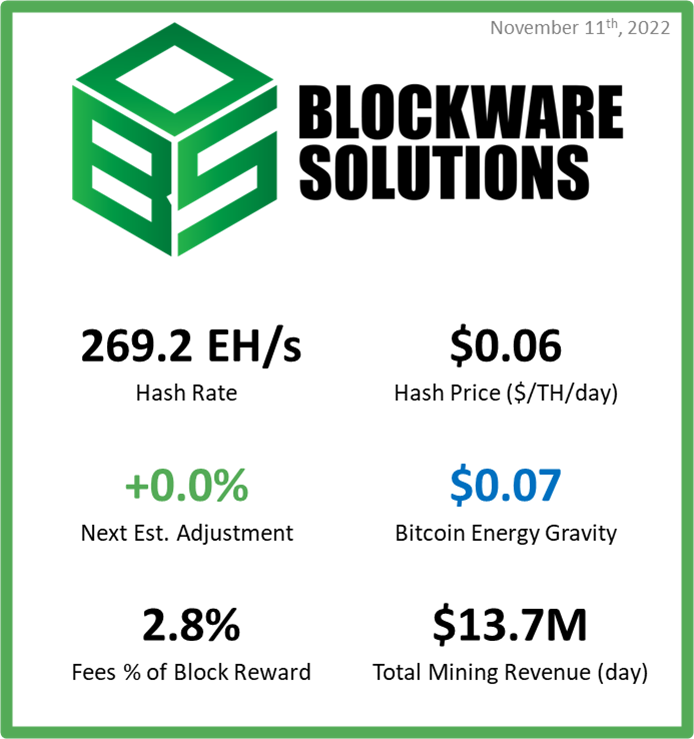
Hashprice is a metric used to measure the dollars a machine earns per unit of Terrahash (TH) per day. For example, an S19XP may run at 140 TH. At today’s hash price of $0.058, the machine earns $8.12 every day (140 TH * $0.058).
Hashprice can also be measured with a different unit of hash rate, $ / Petahash (PH) / day. This is more useful for medium-large miners who control hundreds or thousands of rigs.
In both instances, hashprice did hit a new all-time low as of yesterday. This is due to two key reasons: lower BTC price and increasing mining difficulty.
Updated rig breakeven prices
The following table lays out the current mining landscape at a Bitcoin price of $17,250 and a hashprice of $0.058 ($/TH/day).
It reveals which Bitmain mining rigs are operating unprofitably or are already turned off at specific electricity rates. Old-generation mining rigs like the S9 are now deep out of the money at nearly all electricity rates. This is in line with the current estimated market price per machine of $56, reported by the Hashrate Index. The S9 is effectively a large paperweight unless you have free energy. The rig mines less than $1 of BTC daily.
This is the first time we have seen the high electricity price end of the S19 reach unprofitability. The breakeven price for running an S19 at $0.09 / kWh is now at $19,593.
The S19XP continues to be in a very good position to weather a prolonged bear market. If the price of BTC moves toward the $10k-$12k range for a significant amount of time, there will likely be a number of S19s turn off before XPs. This would decrease mining difficulty and lower the breakeven price for all remaining miners.
Why is mining difficulty not significantly falling despite the price crash?
Over the previous few months, many market participants have been asking how hash rate continues to move up as many miners are struggling to survive. This is a fantastic question as the growth in hash rate seems to defy many of the narratives you see.
First, there is a massive delay in manufacturing mining rigs, building out mining infrastructure, securing PPAs, and deploying rigs in production. Orders and sites that were planned last year are just now getting plugged in. Many of the rigs getting plugged in now are the most efficient rigs on the market (S19XP). Even at the current BTC price and high difficulty, the XP has comfortable margins at almost any reasonable commercial electricity rate. These rigs plugging in are adding to the total network hash rate and pushing mining difficulty up for everyone. Blockware Intelligence expects the growth rate of difficulty to slow into 2023 Q1.
Second, BTC falling to $17,250 only added two segments of the miner breakeven table into the unprofitability category. Even if Bitcoin quickly wicks to $15,000, it does not mean miners immediately turn off their machines. Many miners have PPAs and hosting contracts that require them to consume energy or potentially pay an additional fee. Many miners will likely continue mining at a loss in the short term until either the price of BTC goes back up or they exit their operation altogether.
All content is for informational purposes only. This Blockware Intelligence Newsletter is of general nature and does consider or address any individual circumstances and is not investment advice, nor should it be construed in any way as tax, accounting, legal, business, financial or regulatory advice. You should seek independent legal and financial advice, including advice as to tax consequences, before making any investment decision.








Great post as always! Thank you for providing such a clear picture of the macro environment.
Thank You!
Great Help
Really nice to have this kind of newsletter to improve our knowledge..
Appreciate your effort..