Blockware Intelligence Newsletter: Week 28
Bitcoin on-chain analysis, mining analysis, equity-analysis; overview of 2/25/22-3/4/22
Summary:
It was a strong start to the week in the general market, but Thursday exposed some cracks in the foundation.
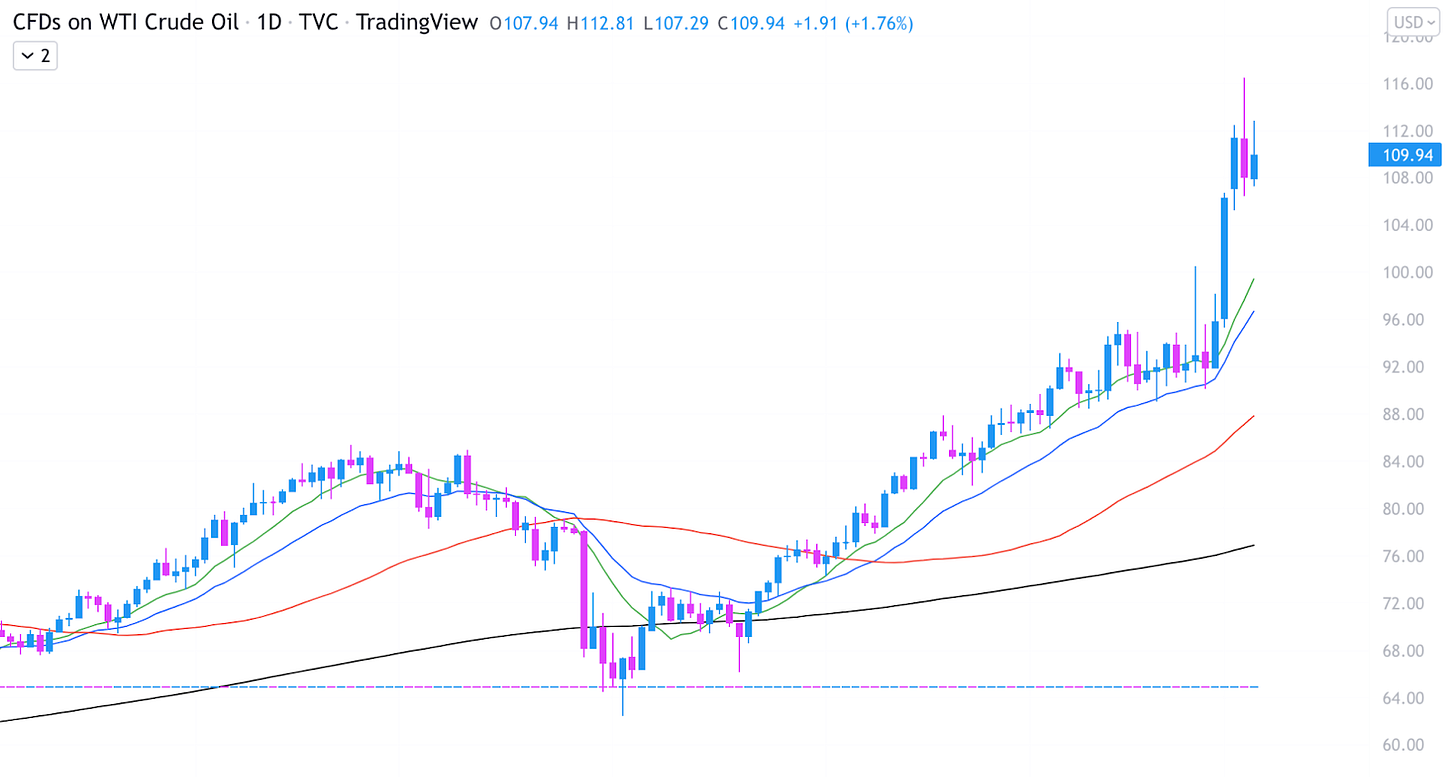
Crude and gold having strong weeks, as discussed here the last 2 weeks.
Inflation-protected bonds have also seen an uptick this week, signaling the market is expecting inflation.
Bitcoin experienced its first downward difficulty adjustment since 2021.
New generation ASICs are showing comfortable operating margins.
We still view “value” as the low-mid 30Ks
Early signs of an attempt to reclaim momentum from BTC, but still not there by several measures
General Market Update
Another volatile and uncertain week for the general market. Things looked very solid from a price action standpoint earlier in the week but after Thursday, it’s hard to be too confident in continued accumulation for the short-term.
On Wednesday, there were more stocks setting up than we had seen in months. Things looked quite bullish and the market could feel some confidence returning.
Yet price action on Thursday exposed a few cracks in the foundation, dispelling new-found confidence in the form of several leading stocks showing weakness.
The indexes look better than those broken leaders so to the naked eye, things might look okay. But it isn’t a stock market, it’s a market of stocks.
The indexes by themselves don’t do enough to give us the full picture of the market’s health. We must look at the leading stocks in the market to gauge the viability of an apparent rally attempt.
The clear secular leaders of recent have been the coal, oil/gas and medical sectors. It’s super important to watch the leading stocks in the leading industry groups as they are the ones who will drag the market higher, or signal when things are cooling off.
Some commodity leaders that showed weakness on Thursday are CNQ (oil), PXD (oil) and SHEL (oil). Some early tech/growth leaders like DDOG, MU, EXPE and CARG also showed signs of weakness, or began to break down.
Tech and growth stocks are always important to watch as they are considered the riskiest of securities. The level of accumulation or distribution in these stocks is a sign of institution’s current risk appetite.
This week on the commodity side of things, we’ve seen some of what I’ve discussed the last two weeks. Despite a few of the oil/gas leading equities showing some signs of slowed accumulation, crude oil prices have had a generally strong week.
US CRUDE OIL 1D (Tradingview)
Gold has also acted well this week, with the price for 1oz up almost 2.5% as of Thursday’s close.
GOLD 1D (Tradingview)
If you need an explanation on why these two commodities tend to appreciate during times like these, I recommend you go back and reread the last 2 newsletters.
We also should keep an eye on Treasury Inflation Protected Securities (TIPS), which have also had a strong week but cooled off a bit on Wednesday/Thursday.
I track the performance of TIPS using the iShares ETF with the ticker TIP. This tracks the performance of an index of 0-5 year maturity TIPS bonds.
TIP 1D (Tradingview)
These bonds are a solid indication of how much inflation the market is expecting, or pricing in. When TIPS are on the rise, we can say that investors are looking for protection from inflation.
It’s likely that this inflation is due to rising oil prices spilling over into other industries, but the reasons why don’t matter as much as the fact that it’s happening.
Furthermore, fear remains relatively high in the market despite strong price action early in the week.
The S&P’s volatility index, VIX, is still elevated with room to run higher. The fact that the VIX is already fairly high (~34 at the time of writing) while prices are just beginning to turn lower could signal that this is the final leg down.
VIX 1D (Tradingview)
This, of course, is just me speculating. All we know for certain is price, and price is telling us to be extremely cautious here.
The CBOE equity-only put/call ratio cooled off a bit early this week. But it ticked higher Thursday and is still quite elevated, historically speaking.
CBOE Equity-Only Put/Call (yCharts)
These two signals tell me that despite some confidence returning early in the week, there is still large amounts of fear in the market.
Despite what you may believe, this is actually a good thing for bulls. Markets bottom when fear is at its highest, once everyone who had thoughts of capitulating finally does.
But the fact that these fear metrics are relatively high, but not extremely high or peaking tells us that there’s potentially more fear left to be felt.
Crypto-Exposed Equities
It has also been quite the volatile week for crypto-exposed equities. This is pretty clearly attributed to the price action of Bitcoin.
For the prepared investors, these are the best kinds of weeks. We have the protection of being largely on the sidelines, but we can observe the relative strength of each name.
This week has been a massive opportunity for us to identify the leading stocks in this sector. There are several ways we can go about doing this.
One simple way is to identify the names who were able to clear the resistance level formed from the previous February 10th-12th highs.
An example of a stock showing strength here would be SI. Bulls were able to regain control to a greater degree than a weaker stock, such as COIN.
This tells us that, at the moment, there’s much stronger demand for institutions to own shares of SI. Based on traditional price action and relative strength comparisons we can identify a trend that is more likely to continue than not.
SI & COIN Comparison 1D (Tradingview)
In my opinion, some of the leading stocks for crypto-native companies are: SI, CLSK and MSTR
A second tier of leaders would include: CAN, IREN, and SDIG.
These tiers are solely my opinion based on my personal experiences and opinions as a technical analyst and trader.
Below is the weekly excel sheet which ranks several crypto-equities by their weekly performance vs. the performance of the group’s average.
We can also see how well these stocks performed against BTC on the far right.
Not that there is a difference between plain weekly percentage returns and the strength shown by analyzing a price chart.
On-Chain and Derivatives
To preface this week, I think it is key to put everything said here into context with the macro environment discussed above. Although this section is primarily discussing Bitcoin native metrics and information, Bitcoin does not operate in a vacuum.
This week I will try to structure this by breaking down the section into two parts, value and momentum; given that these are the two main types of market participants in BTC.
Regarding value, I think this should be broken into two parts as well; short and long-term market participants. Let’s start with short term.
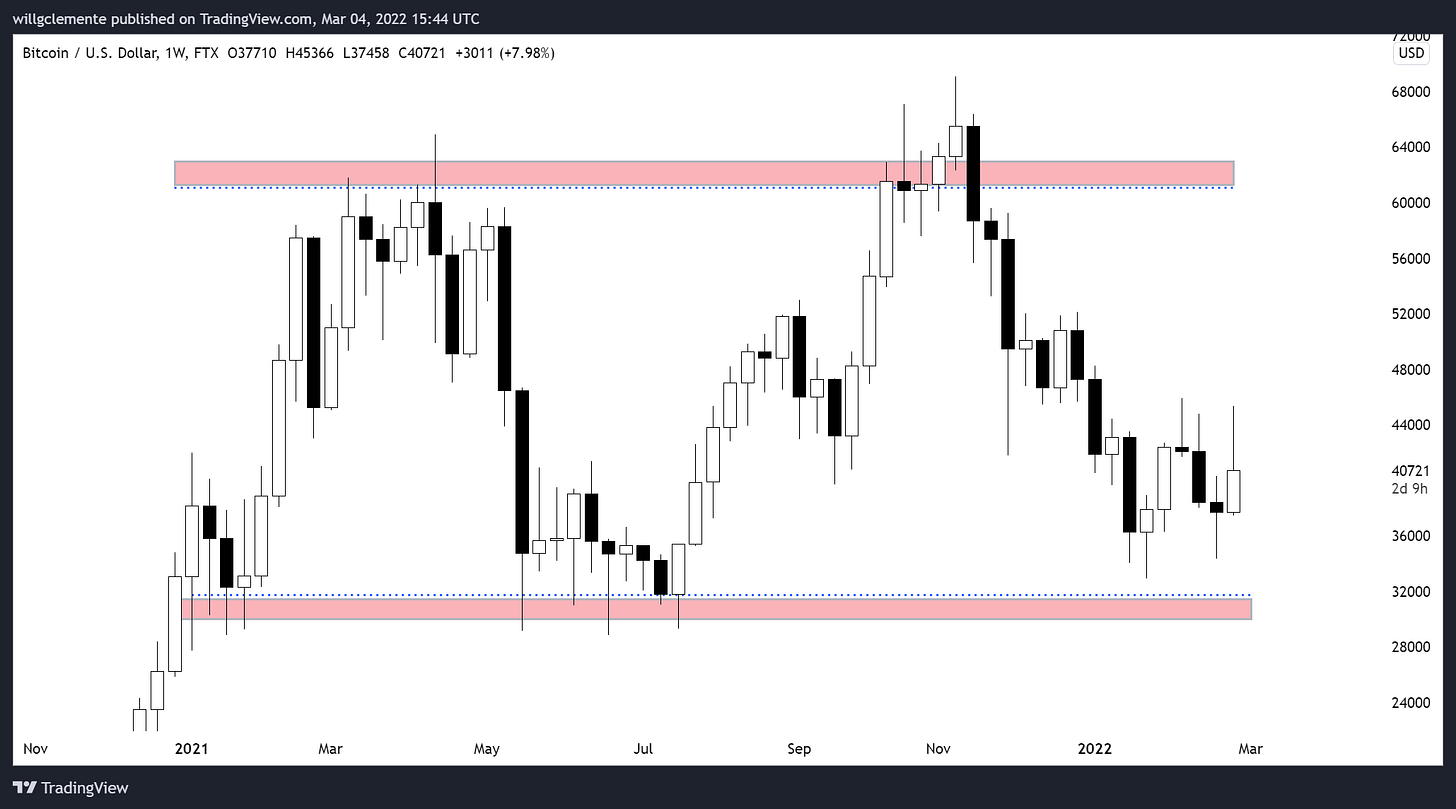
Short term we still view the low to mid-30s as value for BTC, as we’ve been stating for several weeks. This is made evident by several factors: with order book confluence across various venues and viewing broader price structure as a range between 30k-60k being the main two.
Spot premium regime persists, although starting to retrace a bit after the recent 14% candle BTC had this week.
Also on derivs, the 3-month spot/futures basis is at 3.89%, showing a lack of euphoria from the derivatives market. Keep in the back of mind the biggest no-brainer buy is if this was to go negative though.
From a broader standpoint, for someone with a long time horizon, these areas are favorable to begin averaging into more heavily. Not at absolute “pico” bottom levels, but not to sound like a broken record from prior letters, in the lower 25th percentile for historical valuations.
Dormancy flow, comparing the spending of overall coins relative to yearly trend.
MVRV, comparing Bitcoin’s valuation relative to the value “stored” in the network by using the aggregated cost basis of all coins moved on-chain.
Mayer multiple, looking at Bitcoin’s price relative to the 200 day moving average.
HODL waves, showing the amount of supply not moved in “x” amount of time.
Now on to momentum.
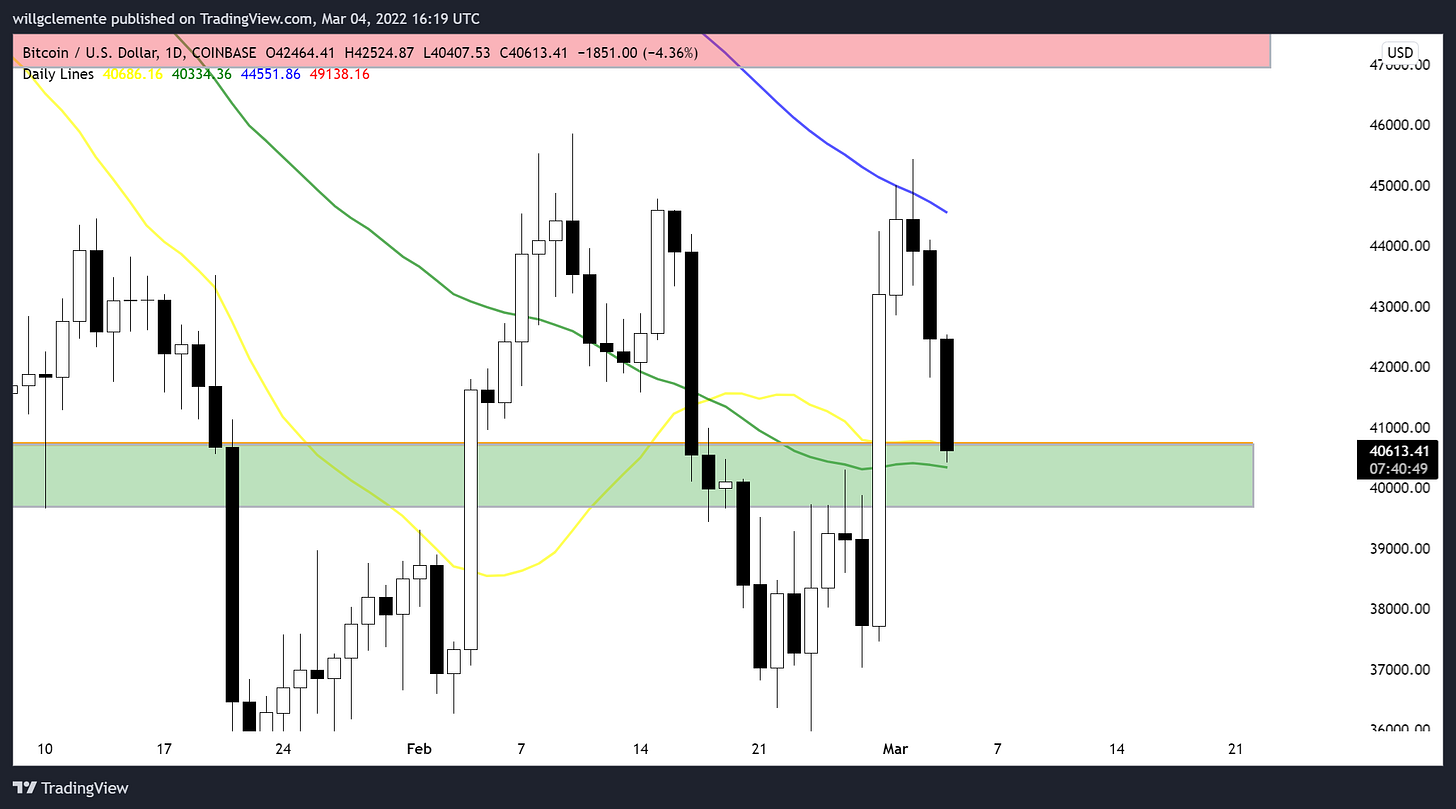
Ultimately I think the main level for BTC to reclaim from a high time frame perspective is 46-47K. This is confluence of several things including general price structure, the yearly open, and short-term holder cost basis; a key price band through the last 5+ years of Bitcoin market history.
Showing some early signs of momentum including flipping the 20 and 50-day moving averages and retesting them now, but rejected at the 100 day and still far from the 200 day.
Another momentum indicator I like, showed to me by my friend Avi Felman at Blocktower is the EHMA 180. BTC attempted to reclaim this over the last few days but has since been lost.
High level on the momentum side: Early signs of attempts to reclaim momentum, but still not there.
Mining
Downward Mining Difficulty Adjustment (-1.5%)
Yesterday, Bitcoin experienced a downward mining difficulty adjustment.
Now, if you’re new to Bitcoin you might ask, what does that mean? Mining difficulty going down means more Bitcoin for miners.
Difficulty goes up when more miners join the network and difficulty goes down when miners leave the network.
This will be the first downward difficulty adjustment since November of 2021 and before that the China mining ban, which was last Summer.
While short-term hash rate measurements can be largely attributed to the randomness of block times, this recent difficulty adjustment could partially be explained by the Russia Ukraine War. The latest data from the Cambridge Electricity Consumption Index estimates that 0.2% and 13.6% of the total network hash rate exists in Ukraine and Russia respectively. Of course, not all of these machines have turned off, but they certainly are at serious risk.
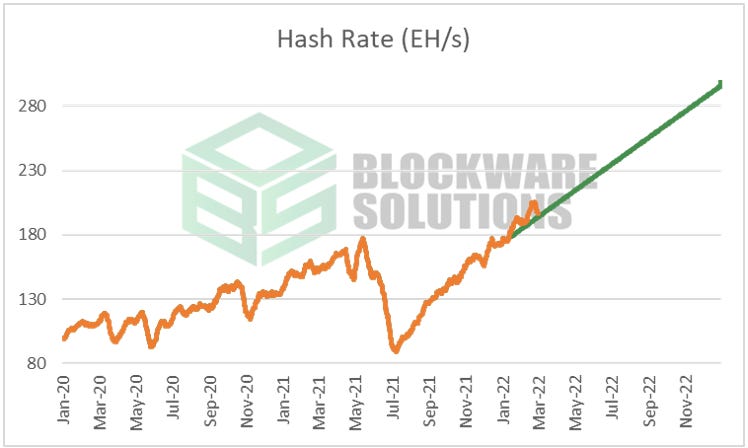
From a broader perspective, the difficulty drop is likely just a temporary move. Hash rate and difficulty will continue to trend up for the rest of the year bearing no other black swan event like the china mining ban.
With that said, hash rate and difficulty are on track for our projection made at the beginning of the year which was projecting a 65% annual increase for 2022. This was based on compiling public miner hash rate projections and historical trends.
For reference, we started the year at 176 EH, and the current 14d moving average of hash rate is 196 EH. Our projection of what hash rate should have been, as of today, was 194 EH. So very inline so far.
Even as mining difficulty will continue increasing in the long term (as it always has), it still makes sense to be mining Bitcoin. Since the end of January when Bitcoin hit a local low in the 32,000s, mining has become more profitable since the price has outpaced difficulty.
Source: Hashrate Index
What are the best Bitcoin ASICs?
We talk about mining a lot from a macro perspective, but let’s dive into actual mining rigs. What do they look like and how much Bitcoin are they currently generating?
Bitmain Antminer S19XP
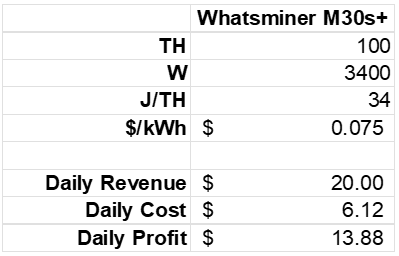
Daily revenue, daily cost, and daily profit are calculated using an electricity rate of $0.075 per kWh, a $42,500 Bitcoin price, and a hash price of $0.20 (March 3rd, 2022).
Whatsminer M30s+
It’s important to note that daily revenue, daily cost, and profit do change over time. Cost is locked in depending on your electricity rate, but revenue and profit can change. The amount of daily revenue your machine generates is determined by the number of terra hashes it can produce, the market price of bitcoin, and network mining difficulty.
Bitcoin Mining in Practice
While the daily profit numbers look nice, it is difficult to procure ASICs, build large mining facilities, and source cheap scalable electricity all on your own. As an institution, hedge fund, or high net worth individual, it makes sense to purchase and host ASICs with a trusted partner like Blockware Solutions.
With Bitcoin mining experience dating back to 2013, Blockware Solutions has sold over 250,000 ASICs, hosted 200+ MW of clients, and mined over 1,500 BTC from the Blockware Mining Pool.
If you are looking for a trusted partner to assist you in deploying capital to the Bitcoin mining space, Request a Quote from Blockware Solutions.










buy the dip. or just buy.