Blockware Intelligence Newsletter: Week 36
Bitcoin on-chain analysis, mining analysis, equity-analysis; overview of 4/29/22-5/6/22
Blockware Intelligence Sponsors
If you are interested in sponsoring Blockware Intelligence email: sponsor@blockwaresolutions.com.
FTX US - Buy Bitcoin and crypto with zero fees on FTX. Use our referral code (blockware) and get a free coin when you trade $10 worth.
Blockware Solutions (Mining) - It is difficult to buy ASICs, build large mining facilities, and source cheap scalable electricity all on your own. Work with a trusted partner like Blockware to deploy capital into Bitcoin mining.
Blockware Solutions (Staking) - Ethereum 2.0 is almost here, now is the time to stake your ETH with Blockware Solutions Staking as a Service to take advantage of 10-15% APR when the Ethereum network switches over to Proof of Stake
Summary
Powell hiked rates by 50bps on Wednesday, this leads to higher yields and adds continued downside pressure to equities.
The value of the US Dollar is on the rise, in comparison to foreign currencies, this compounds the selling pressure in the general market.
With this, investor sentiment continues to breakdown as institutions capitulate or move short.
Bitcoin transaction fees saw a significant yet temporary jump this week. Pending transaction fees in the mempool reached a level not seen since July 2021 due to Binance UTXO consolidations.
Bitcoin’s hash rate is quickly moving higher after a stagnant few months.
Halfway to the next Bitcoin halving in 2024!
General Market Update
This week has been more of what we’ve discussed here for the last 5 months. The big news this week came with the meeting of the Fed Open Market Committee.
Powell announced a 50bps increase in the Fed Funds Rate, the largest since 2000. The market bounced on this news Wednesday which could indicate that investors were worried about an even larger hike.
Fed Funds Rate (Bloomberg)
The markets work based on relationships. One of the most important is the inverse relationship between interest rates and bond prices.
With higher interest rates comes lower bond prices and thus, higher bond yields. Therefore this week, we’ve seen yields still on the rise. The yield of the 10 year is above 3% for the first time in 4 years and nearing a breakout above those 2018 highs.
10Y Bond Yield (Tradingview)
Higher bond yields puts pressure on equities, but the question now is how much have stocks priced in higher rates and yields.
Oil prices are also back on the rise this week following the increase in interest rates.
Fed Funds Rate/WTI Crude Oil (Bloomberg)
Normie investment websites will tell you that oil prices and interest rates have an inverse relationship but as you can see above that’s clearly not true. There are several possible reasons for their fairly close relationship, most likely it’s because when interest rates rise the cost of capital rises which results in a restricted oil supply and higher prices.
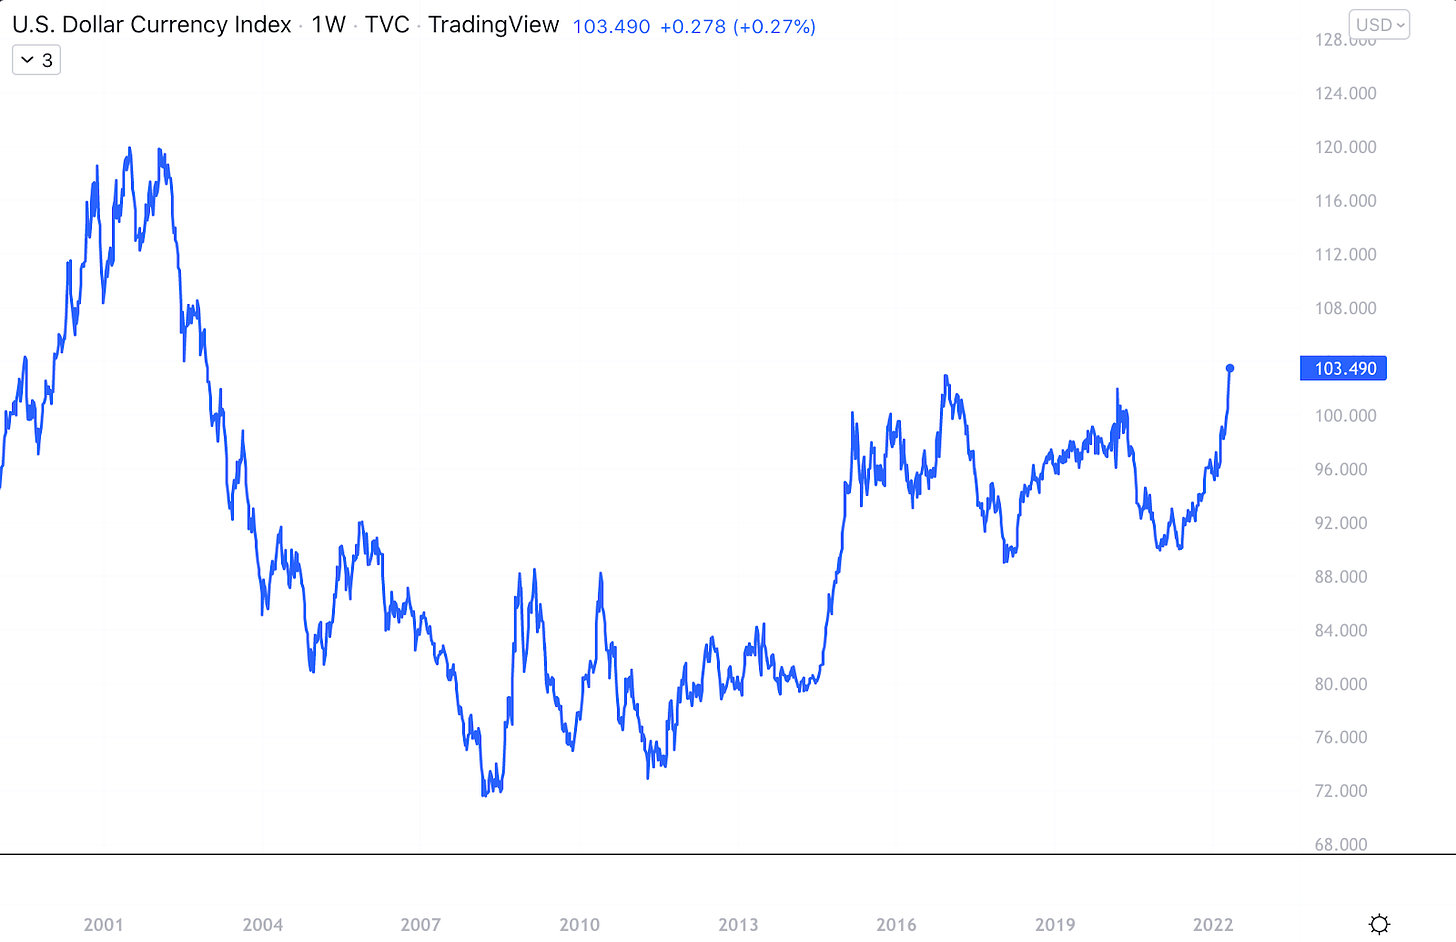
We’ve also seen a breakout of the value of the dollar to 20 year highs as of recent. We can use the US Dollar Index, which compares USD to an index of foreign currencies, to see the value of USD.
USD Index (Tradingview)
The appreciation of USD makes US products more expensive in comparison to foreign ones. This is generally a good thing for US stocks as it can provide an earnings boost. But in an environment like this, who knows.
But it’s clear that a rising dollar isn’t necessarily because things are going well in the US, it’s more because we’re seeing extreme weakening of the Chinese Yuan, Japanese Yen and Euro.
For the stock indices Wednesday, was a pretty strong day, with the Nasdaq closing up through its 10-day EMA on strong volume. But the reversal on Thursday was a serious sign of the current poor health and sentiment in the equity markets.
Nasdaq Composite 1D (Tradingview)
Contrary to popular belief, it’s not a stock market, it's a market of stocks. It’s important to monitor the health of individual stocks in order to understand the health of the entire market.
% of S&P stocks above 20 DMA (Tradingview)
Above you can see a plot of the percentage of stocks above their 20-day simple moving average. On Thursday this metric was down 21.59% to now only 23.16% of the S&P being above this moving average.
This is a signal of pretty significant degradation among equities. Another metric we can look at is the number of stocks advancing.
# of Advancing Nasdaq Stocks (Tradingview)
Above is a weekly plot of the number of advancing Nasdaq stocks. This is a way of viewing the breadth of the market to see exactly how many names are participating to the upside.
As you can see, by only counting the weekly close, the number of advancing stocks is at a 3 year low. This indicates that the market is extremely weak (shocker).
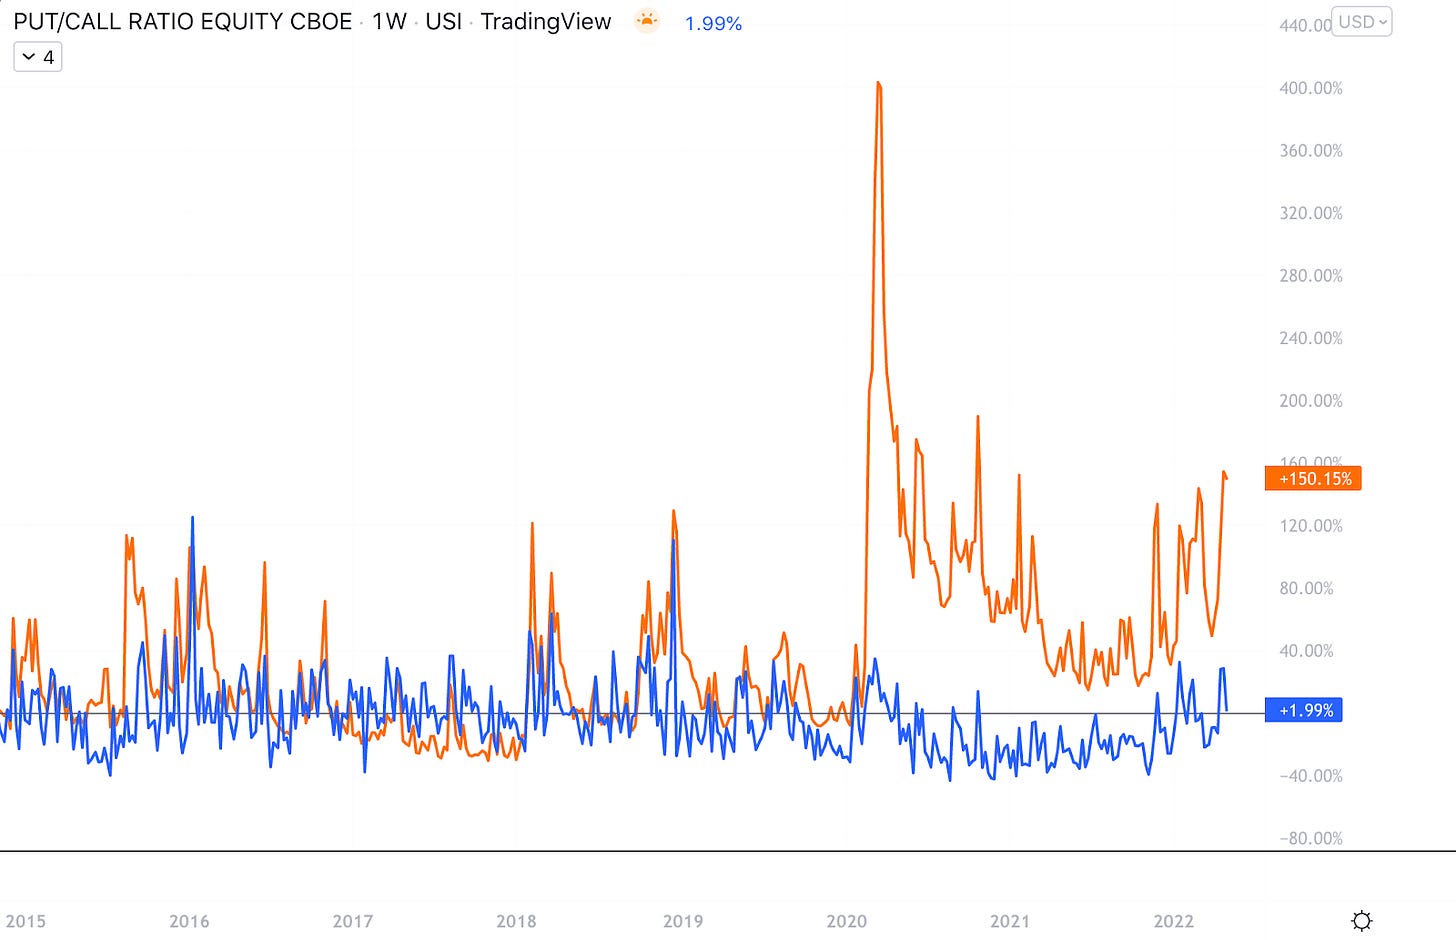
Furthermore, we’re seeing a continued breakdown in investor sentiment. The two most popular ways to view sentiment are the put/call ratio and the S&P Volatility Index, VIX.
Equity-Only Put/Call Ratio/VIX 1W (Tradingview)
Above you can see the equity-only put/call ratio (blue) overlaid with the VIX (orange). Both of these metrics will spike during a market selloff as investors place bearish trades (increasing put/call) and fear rises in the market (increasing VIX).
Today these metrics are both elevated, but historically could rise much higher. To me it appears that there’s more pain to be felt by investors before this market finds a bottom.
Crypto-Exposed Equities
Once again, there isn’t too much to update in the world of crypto-equities from a broader market perspective. Bitcoin is still being grouped with risk-assets like tech stocks so therefore, increasing interest rates is going to cause a selloff in BTC too.
As we know, crypto-equities generally track spot Bitcoin’s price with varying degrees of beta. So a weak BTC will cause weak BTC stocks. Maybe one day institutions will realize that these companies can make money regardless of the price of BTC.
One of the strongest names this week has been the miner Iris Energy (IREN). IREN found support right before their previous all-time lows.
IREN 1D (Tradingview)
Ideally, we would’ve seen IREN undercut that low to take out stop losses and wipe out participants but the fact that it at least put in a temporary bottom in an environment like this is impressive.
Above is our weekly excel sheet comparing the Monday-Thursday performance of several crypto-native equities. EQOS tops this list with an impressive 23% gain this week. That being said, EQOS is an illiquid penny stock so this $0.37 increase isn’t anything I’m too excited about.
Bitcoin Price Structure, On-chain, Derivatives
This has been another volatile week for BTC with macro still in the driver’s seat for now.
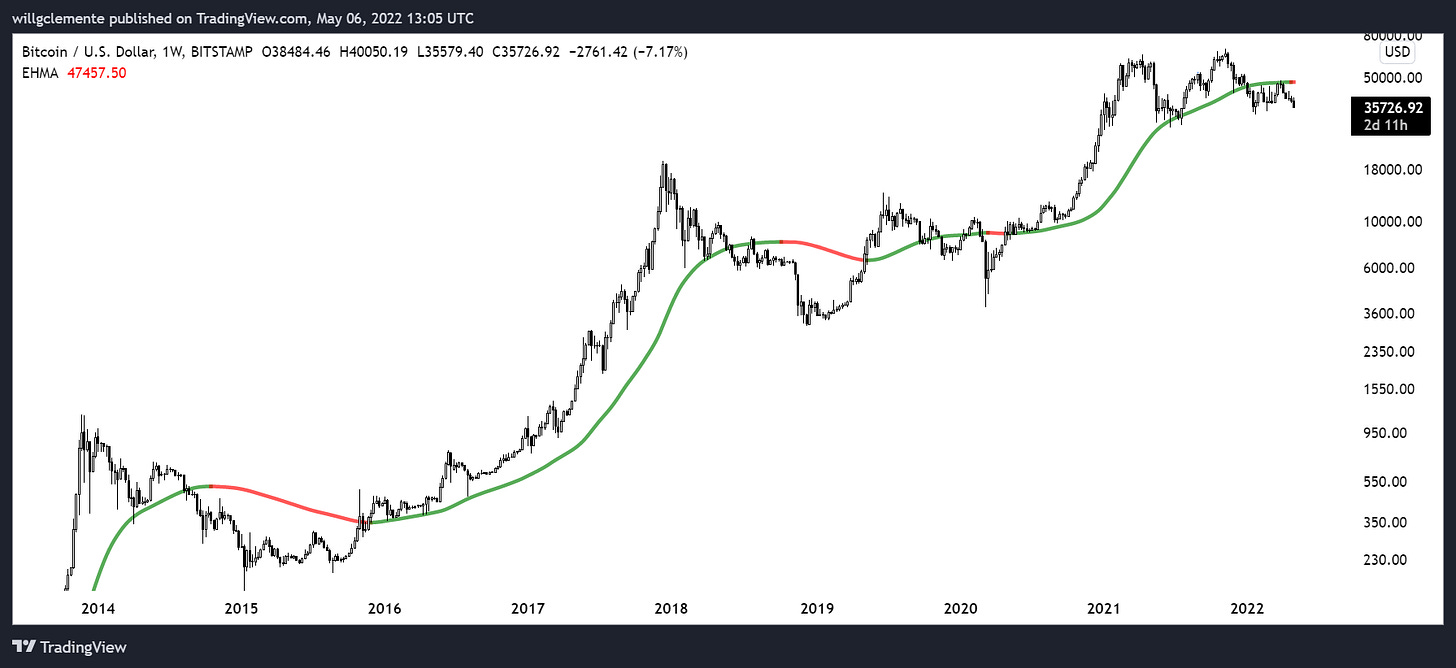
Following up with our value/momentum framework, BTC still sitting below the $47,000 area we view as momentum. This currently sits at $47k and is based on a confluence of indications of market structure. Below we have one of these indications; the 180 weekly exponential hull moving average. This is essentially a moving average with a weighting factor to recent price action. It has turned red for just the 4th in BTC history, meaning the moving average is declining.
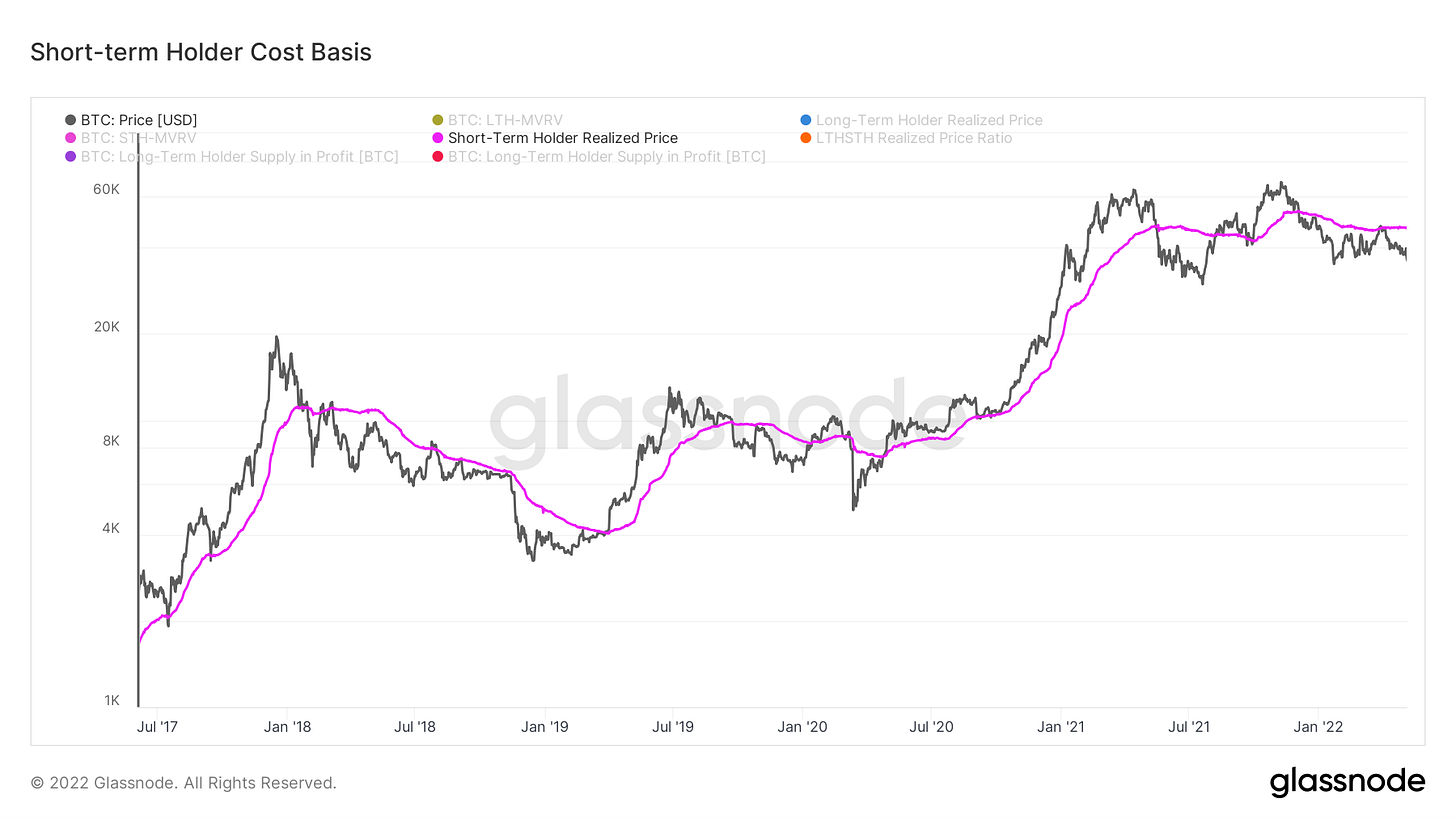
Another indicator we have been talking about for a while is the STH cost basis ( or realized price) currently sitting at $46,900. Bear markets typically involve multiple failed underside retests of the aggregated cost basis of new participants seek to exit the market at break-even.
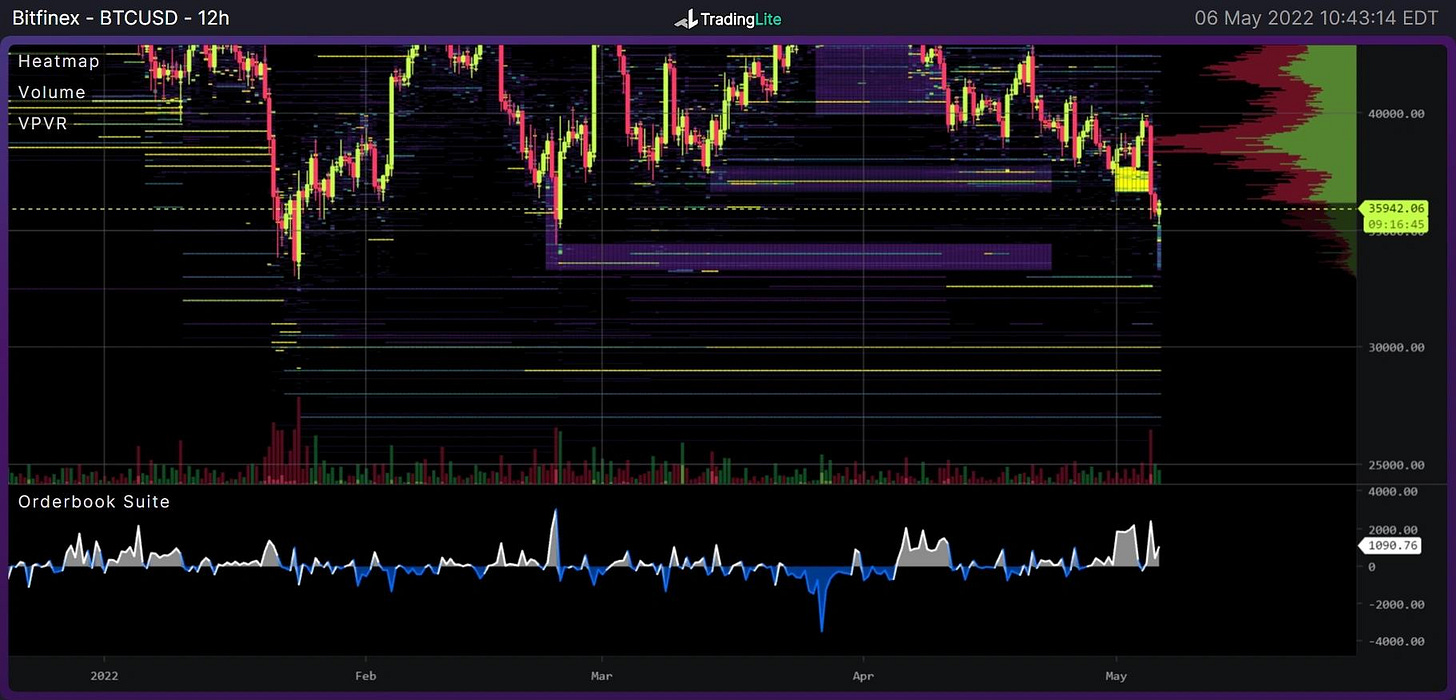
We still view the low $30ks as value, based on HTF price structure, order books, and the fact that all on-chain macro oscillators would likely be reset in a visit down to that area.
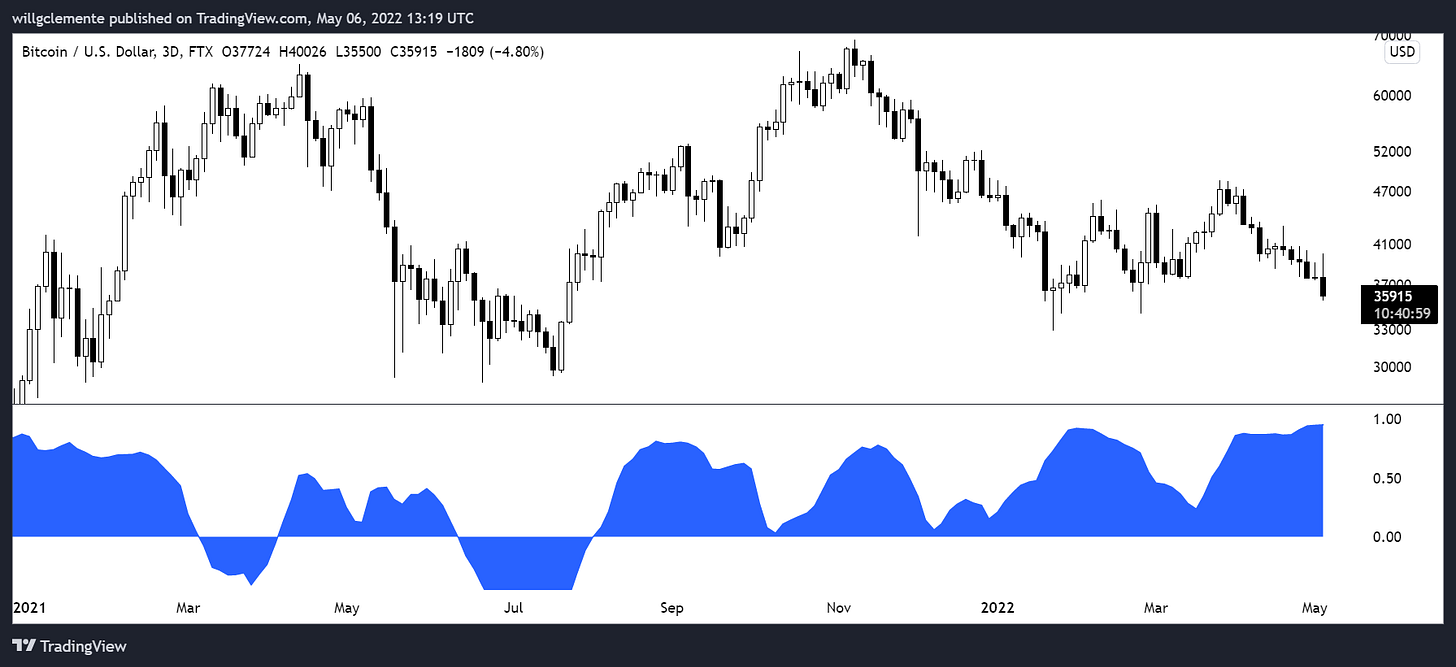
Correlation to the Nasdaq remains extremely high on all time frames as market participants basket BTC in with tech another risk-on assets.
We can also see here BTC trading with NQ essentially tick for tick.
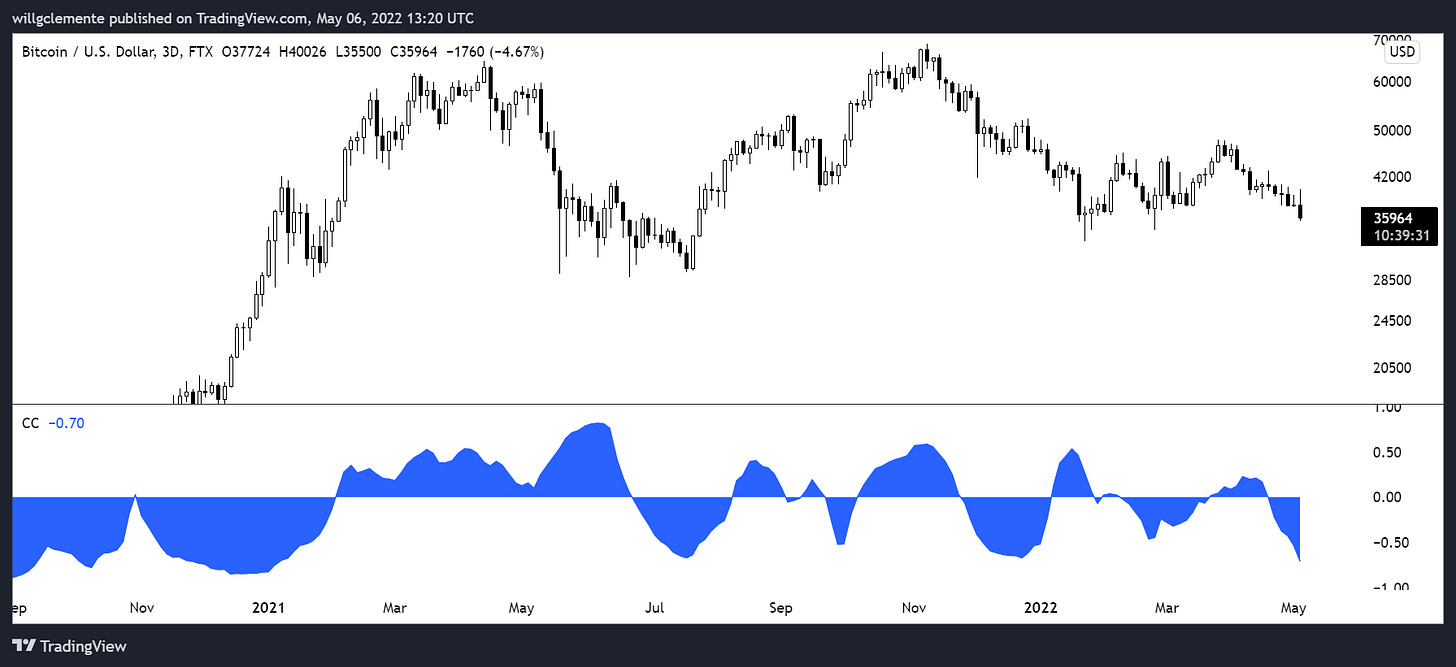
As the DXY pushes towards multiyear highs, BTC has seen a sharp inverse correlation to DXY.
Network statistics are all continuing their decline; showing a decrease in speculative retail and exuberance in the market.
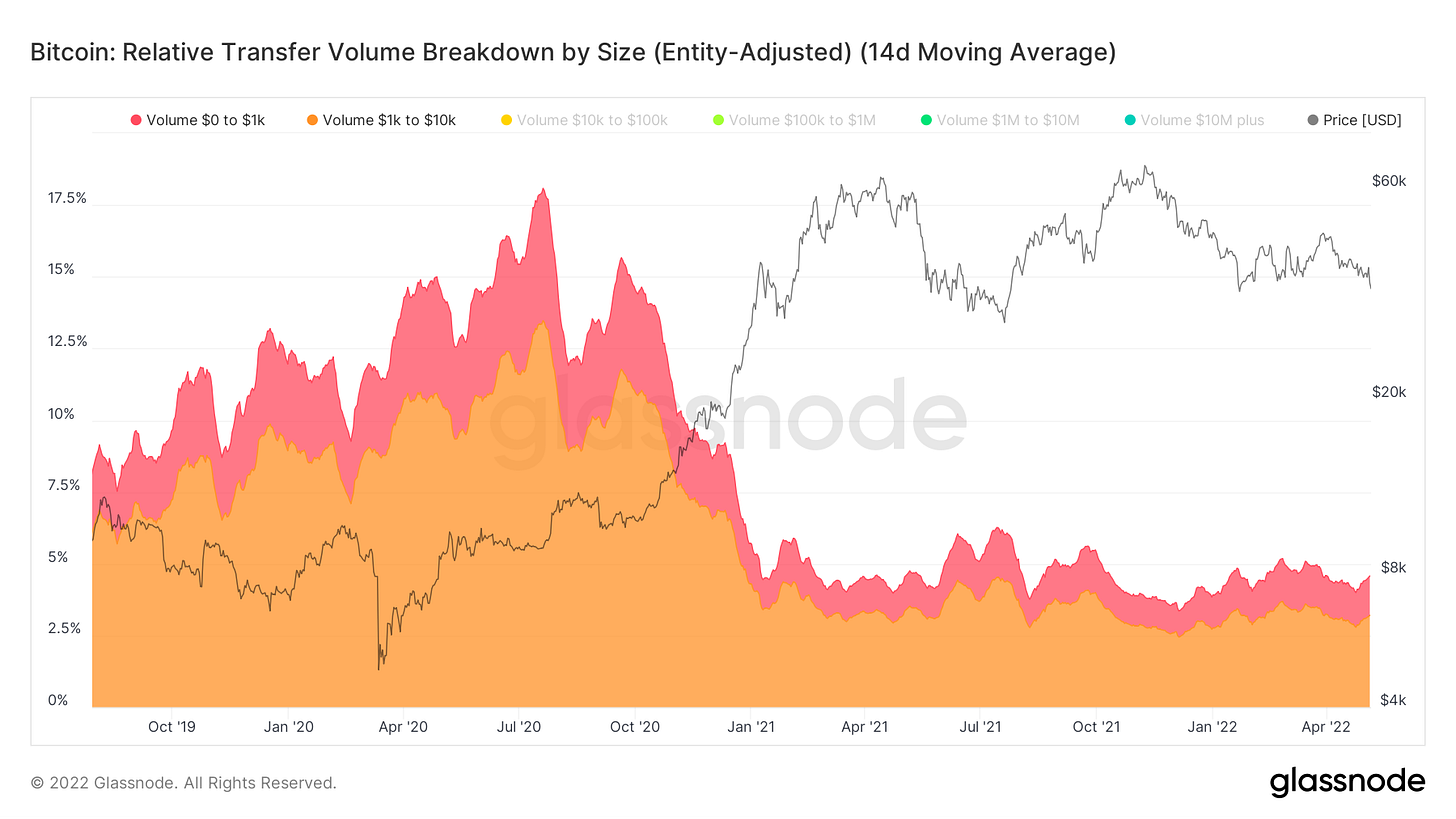
The amount of transfer volume dominated by transactions below $10K has also seen a perpetual decline; indicating transaction batching by exchanges paired with primarily a decrease in bull market retail participants.
Despite the macro backdrop, under the surface crypto natives are holding tight. The amount of supply that hasn’t moved in at least a year continues to grind to new all-time highs. Long-term holder supply is also increasing; which is very interesting when compared to their cost basis. The rate of decline in LTH cost basis is the sharpest by far in Bitcoin’s history, and when paired with an increase in their holdings shows a level of adoption from top buyers to long-term holders.
Bitcoin Mining
Bitcoin Transaction Fees Soared (Temporarily)
Without a significant change in the price of Bitcoin, the mempool (where valid Bitcoin transactions wait to be mined by miners) became loaded with transactions. This means there was a temporary backlog in pending Bitcoin transactions, and pending transactions with higher fees means more revenue for miners.
When this occurs, wallets naturally start suggesting users increase their transaction fee for their transaction to be included in the next block. Interestingly, the mempool hasn’t had this much in pending transaction fees since July 2021, nearly a year ago.
Usually, the memool gets backed up during periods of rapid adoption and extreme sudden price swings, but ironically we didn’t see too much of a wild price swing for Bitcoin on Wednesday afternoon. Using onchain data, analysts confirmed that the large number of transactions that entered the mempool was Binance consolidating their UTXOs. What’s a UTXO? It stands for Unspent Transaction Output. Basically, it’s a discreet piece of Bitcoin on the blockchain. Binance has users regularly depositing BTC to different addresses at different times. Every once in a while it makes sense for Binance to combine all of those discreet pieces of Bitcoin into one UTXO, so it will be easier and cheaper to send and move Bitcoin in the future.
Back to the mempool, below shows what the mempool looked like during the busiest period in Bitcoin’s history, the tail end of the 2017 bull run.
At one point, there were almost 400 BTC in pending transaction fees sitting in the mempool. Miners were not only mining the 12.5 block reward at the time, but they were also earning significant fees from transactions.
Unfortunately for miners, this most recent mempool backlog will likely not be sustainable. In order for miners to see high fees again, we likely need to go on a significant bull run where new users are buying BTC and storing their Bitcoin by holding their own private keys. While it may or may not happen soon, in the long run, it seems obvious we will see another aggressive wave of transaction fees, and miners will be very happy.
Hash Rate is Soaring
From mid-February to mid-April, Bitcoin’s hash rate was not increasing at the rate many analysts were expecting for 2022. Finally, hash rate appears to be taking off again. The 14-day moving average recently passed 220 EH/s.
This is interesting as even though the $/BTC exchange rate is decreasing, the Hash/BTC exchange rate continues to increase with hash rate and network difficulty growing. The demand to acquire Bitcoin with ASICs has never been higher, and Blockware Intelligence expects this growth to continue throughout 2022 and beyond.
Halfway to the 2024 Bitcoin Halving
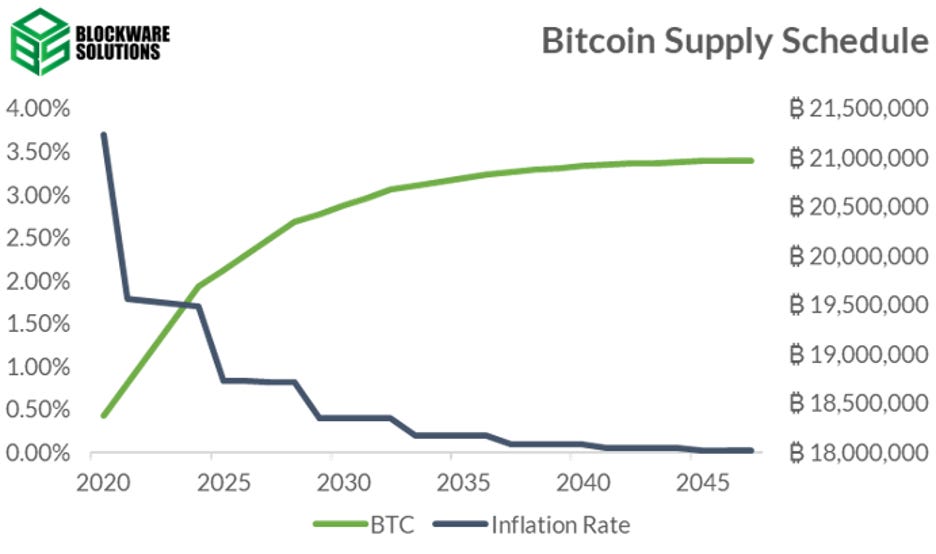
Bitcoin recently crossed the halfway mark to the 2024 block subsidy halving. At that point, Bitcoin’s annualized inflation rate will drop from ~ 2% to slightly below 1%.
Historically, halvings have been bullish catalysts that knock out poorly positioned miners on the network. Usually, old generation machines running at suboptimal electricity rates get turned off during this period, difficulty drops, and new generation machines earn a little more Bitcoin.
Blockware published its 2020 Bitcoin Halving Analysis over two years ago, and it proved to be an insightful and accurate representation of the Bitcoin mining market. It’s a must-read for miners and holders preparing for the next Bitcoin halving.
All content is for informational purposes only. This Blockware Intelligence Newsletter is of a general nature and does consider or address any individual circumstances and is not investment advice, nor should it be construed in any way as tax, accounting, legal, business, financial or regulatory advice. You should seek independent legal and financial advice, including advice as to tax consequences, before making any investment decision.


