Blockware Intelligence Newsletter: Week 44
Bitcoin on-chain analysis, mining analysis, macro analysis; overview of 6/24/22-7/1/22
Blockware Intelligence Sponsors
If you are interested in sponsoring Blockware Intelligence email: sponsor@blockwaresolutions.com.
FTX US - Buy Bitcoin, crypto, and now US stocks with lower fees on FTX. Use our referral code (Blockware1) and get 5% off trading fees.
Blockware Solutions - Buy and host Bitcoin mining rigs to passively earn BTC by securing the network. Your mining rigs, your keys, your Bitcoin.
Summary:
As Thursday was the final day of Q2, the S&P has officially had its worst first half of a year since 1970, and the 5th worst of all-time.
The market received a bullish signal on Friday in the form of a Follow-Through Day, but this was followed by a Distribution Day just 2 days later. In this letter we examine the relationship between the timing of these 2 signals.
While equities have largely continued their selloff this week, bonds have continued to see a fairly strong bid for the second week in a row. Are bonds due for a reversal or are equities just slow to catch up to the smart-money?
The Atlanta Fed revised their Q2 GDP estimate to indicate 2 consecutive quarters of negative GDP growth, but contrary to popular belief, 2 negative quarters does not necessarily mean we are in a recession.
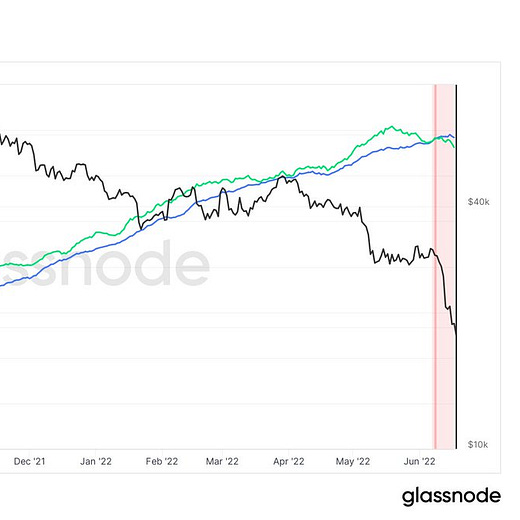
Hash Ribbon metric continues to signal that a miner capitulation has been underway since June 7th (24 days). The end of a miner capitulation historically marks a bear market bottom.
~ $1B of public miner debt and ~ $3B of private miner debt currently exist and are secured by ASIC miners, BTC, and mining infrastructure.
S19 Pro Miner Profitability Matrix.
Samsung begins production of 3NM Bitcoin ASIC chip for MicroBT.
General Market Update
Overall, it’s been a fairly poor week of price action following the reversals in the major stocks indexes after running into resistance around some unfilled gaps early in the week.
To start us off, it’s important to note that Thursday was the last day of the month, and 2nd quarter of 2022. I conducted some research to put into historical context how ugly the first half of 2022 was.
If we examine all first halves of a year for the S&P 500, going back to 1871, only 4 years were worse for the index.
Those worse years (1970, 1962, 1932 and 1877) were all amidst many of the hardest economic periods in the history of our economy.
The 1st half of 1970 was the beginning of the 1969-70 recession that was caused by attempting to lower government budget deficits following the Vietnam War. Q1 of 1962 saw a flash crash in stocks at the bottom of the bear market caused by the 1960-61 recession. In 1932, the US was in the midst of the Great Depression and in 1877, we were towards the middle of the Panic of 1873, the second longest recession in US history, behind only the Great Depression.
It certainly doesn’t make me feel optimistic to see 2022 ranked with some of the largest economic disasters in US history. This puts the 1st half of 2022 in the 99th percentile for the worst start to a year for stocks in US history.
But the data we’ve collected isn’t only showing fire and blood. Furthermore, and perhaps even more interesting, is that for those years that had worse starts than 2022, all of them saw the S&P up for the second half of the year.
Now, this doesn’t mean that the S&P will, without a doubt, be green to end the year, in fact I would wager that it won’t.
That is because, only in 1962 did the deeply red first 6 months follow a green second 6 months from the year prior. More simply put, all other 1st 6M periods from the other years were at the tail end of many red 6 month periods in a row.
The first half of 1877 was the 5th red 6 months in a row, the first half of 1932 was the 4th red 6 months in a row, and in 1970, it was the 3rd in a row.
1962 was the year where the market saw the Kennedy Slide, also known as the Flash Crash of 1962, but as I previously alluded to, this was in the midst of an extremely short-lived bear market that one could consider an anomaly in the stock market.
This tells me that, although it is possible, the likelihood of this being a one-and-done negative 6 month candle is quite low.
The 2 years who’s first halves rank slightly better than 2022 are 1907 and 1893. Both of these years saw a red second half of the year, at -22.84% and -4.34%, respectively.
S&P 500 Index 6M Candles (Tradingview)
Moving on, but staying in the equity markets, on Friday the market saw a signal of a potential new uptrend attempting to form. This signal is known as a Follow-Through Day (FTD) and has been discussed extensively in this newsletter.
You can go back to last week’s edition to learn more about what that is.
That being said, 2 days later, on Tuesday, the market put in a second signal, known as a Distribution Day (DD). Statistically speaking, that makes the likelihood of this FTD sticking drop significantly.
I conducted some research that studied all bear markets of the 21st century and examined the relationship between FTD’s and the time it takes for a DD to follow.
What I found is that in the 2000’s, if there is a DD on days 1-3 following the FTD, the likelihood of that FTD failing, or the market undercutting its low, is about 73%.
That being said, the FTDs that worked in 2003, 2009 and 2020 saw a DD on days 3, 2 and 1, respectively. Which means that although there is a 73% chance of a FTD failing if there’s a DD within 3 days, there’s a 100% chance of it failing if there’s a DD after more than 3 days.
This doesn’t make much sense, and seems to destroy the use case for the FTD, until you look at what happened following FTD’s that saw a DD come later than day 3.
In all cases where a DD came on day 6 or beyond, the market went on an at least 2 week rally.
So while judging how close a DD follows a FTD hasn’t been the best indication of the likelihood of a FTD sticking, it can be useful in judging if the market will get a fairly prolonged rally.
To prove even further that listening to FTD’s is a successful strategy, I created a mock portfolio from the course of 2000-22 that traded using the following criteria: every time there was a FTD in a bear market it purchased the NASDAQ with 10% of its account, using a 7% stop loss. When a FTD buy stuck, and the index cleanly crossed above its 200-day SMA, the account added the remaining 90% into the index and then held it until it broke below the 200-day again.
This account would’ve returned 192% over the 22 years, in comparison to the NASDAQ’s 157%. As a yearly rate of return, the account grew at an average of 8.75%, which is 130bps higher than the NASDAQ’s average yearly return of 7.45%.
The tweet below includes the math for this portfolio analysis along with the FTD data.
This proves that even if you are out of the market for the majority of a decade, and use a fairly conservative investment strategy, you can still outperform the market if you are managing risk properly.
In terms of what we’ve seen transpire this week in the stock market, we’ve seen Chinese names leading the pack in terms of relative strength and price action. These equities are pricing in the re-opening of China and potentially the resolution of their supply-side issues.
We know that Chinese owned, US listed companies have a history of dishonesty and fiasco (Example: Luckin Coffee), but these charts are simply hard to ignore.
Chinese names like LI, DQ, and JKS are clearly outperforming the crowd at the moment alongside some biotechs like LNTH, DAWN and IOVA.
NASDAQ Composite 1D (Tradingview)
Last week the NASDAQ was able to hold previous support from the first correction we saw following the March 2020 lows. With price back below all major moving averages, and having put in two consecutive higher volume doji candles on Wednesday and Thursday, it would appear a retest of this level is likely.
Tuesday was the true signal of this as the index crossed below both its 10 and 21-day EMAs on volume that was greater than its 50-day average.
On Thursday, the market attempted to reverse higher but this intraday rally was snuffed by relentless selling later in the session. This was a fairly textbook example of bear market price action, stocks will open strong and then close weak. The opposite is typically true in a bull market.
This selling has come alongside an uptick in bond prices this week, which is a fairly interesting and uncommon dynamic.
US10Y Yield 1D (Tradingview)
Yields are currently down for the second week in a row, and for the 10-year Treasury are sitting right around their 50-day SMA. The last rally we saw in bonds, which lasted for 3 weeks in May ultimately reversed once yields reached around that level.
Friday has potential to see an uptick in 10Y yields as they have reached key moving averages on both the weekly (10SMA) and daily (50SMA) timeframes.
That being said, it is possible that the reason that equities have sold-off alongside yields is that the stock market simply hasn’t caught up with the smart-money bond traders.
Generally speaking, the bond market tends to move first, followed by equities. Therefore, there is an argument to be made that if yields continue to fall, equities could follow the bond markets lead in the form of higher stock prices. Only time will tell.
But due to the fact that equities are falling while the dollar is rising, it appears much more likely to me that bonds will follow suit with higher yields in the coming days/weeks.
On the macro front, there were a few data points released this week that are relevant to discuss.
This week the Atlanta Fed revised their Q2 GDP estimate to -1%, this would put the US’ GDP at negative for two consecutive quarters.
Now contrary to popular belief, this DOES NOT mean that the US is officially in a recession, even if the GDP number does come in negative when it’s released on July 28th.
An official indication of recession must come from the National Bureau of Economic Research (NBER). Their model takes into account more than GDP. In fact, NBER defines 3 criteria: depth, diffusion and duration.
Depth meaning the retraction in economic activity must be very significant, diffusion means it must be spread widely across many different facets of the economy and duration meaning the retraction must be across many months.
One argument as to why the US has not quite yet entered recession is that we haven’t yet met the depth criteria. One metric NBER would need to see decline is Gross Domestic Income (GDI).
Gross Domestic Income (FRED)
GDP and GDI are very similar, with the difference being that GDI measures all the income earned by producers of goods while GDP measures the value of everything produced.
In a perfect world, GDP and GDI would be equal, but in the real-world this is rarely the case.
NBER looks for a prolonged contraction in GDI, alongside GDP, as one factor for a recession. But keep in mind, these data points are released quarterly so it could be possible to see GDI fall when the Q2 data point is released.
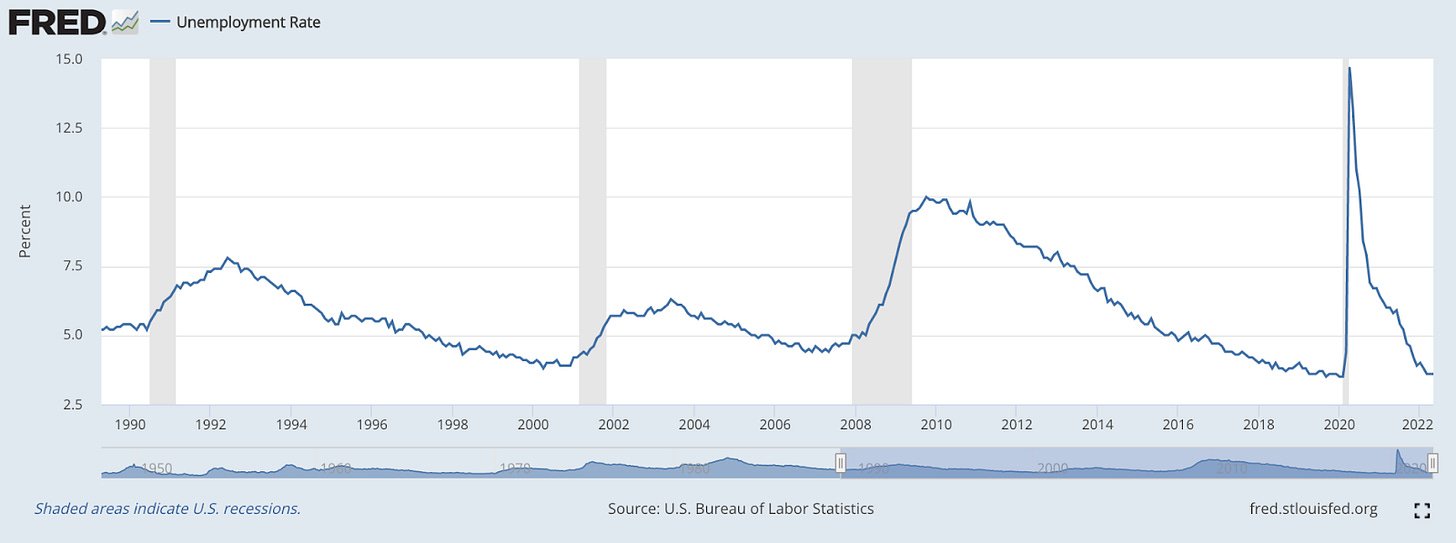
Unemployment Rate (FRED)
Unemployment is also a significant factor that NBER considers when determining whether we are in a recession. As you can see above, the unemployment rate has not risen recently. That being said, it has been flat at 3.6% for 3 months in a row.
It could be that this is the rounding-out of a bottom in the unemployment rate that is to be followed by higher rates.
All in all, many significant economic data points are only released quarterly so an indication of recession will be lagging. Late July would be the first possible time to see that announcement, if our economy truly is receding currently, but it’s more likely to see that announcement come later in the year.
Crypto-Exposed Equities
With Bitcoin closing below its 200-week SMA for 2 consecutive weeks for the first time in history, it’s no surprise that Bitcoin-related equities have had a tough week.
So while the group has continued to be pummeled, there are a few names who stand out in comparison to the rest of the pack.
CAN 1D (Tradingview)
Canaan, for example, has held up fairly well in this most recent wave of selling. As of Thursday’s close, CAN has been able to hold this lower trendline and at least touched its 50-day SMA this week, which is much better than many other names can say.
That being said, this current pattern forming looks like a textbook bear flag.
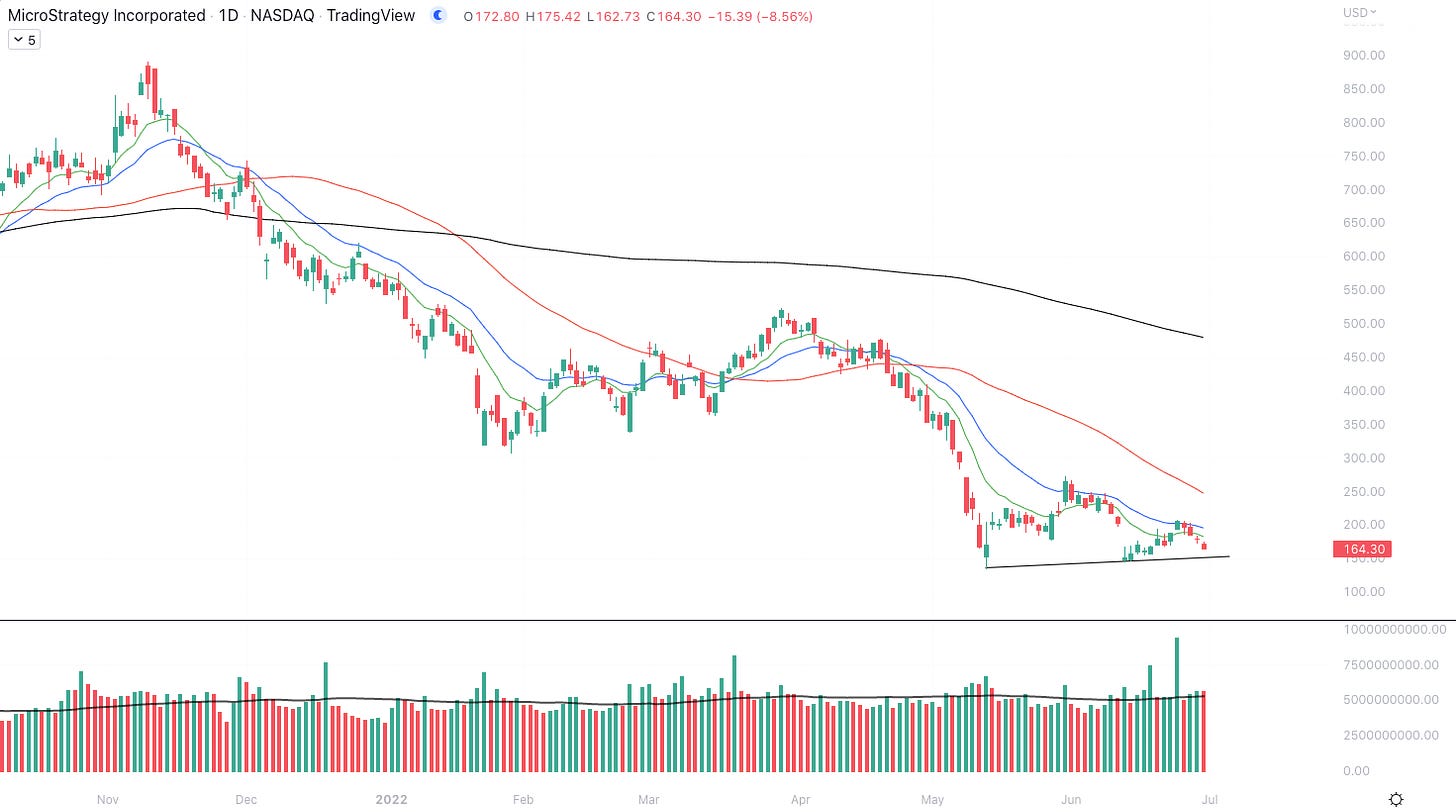
MSTR 1D (Tradingview)
MicroStrategy also has managed to hold the lower limits of this wedge. One thing that stands out here are the large green volume bars we saw in the rally it made the last couple of weeks.
Clearly there’s AT LEAST one major institution seizing the opportunity to pick up MSTR shares for over 80% cheaper than just 8 months ago. But once again, this looks to me like a counter-trend rally that is highly likely to break to the downside. But, I’m only speculating.
As always, above is our table which compares the weekly performance of several crypto-equities.
Bitcoin-native market analysis
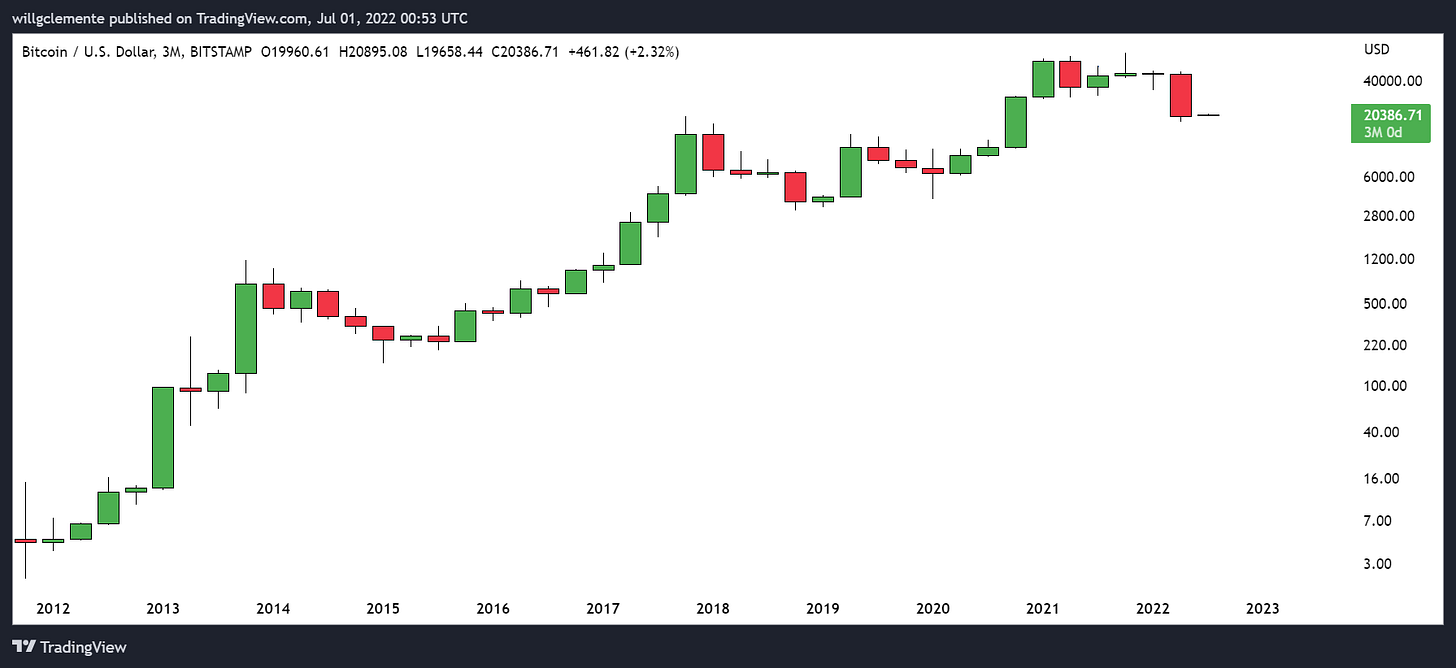
This has been an incredibly entertaining quarter for the crypto market to say the least, with just about everything possible that could go wrong having gone wrong. In terms of performance, this has been the worst quarterly candle for Bitcoin on record, down over 50%.
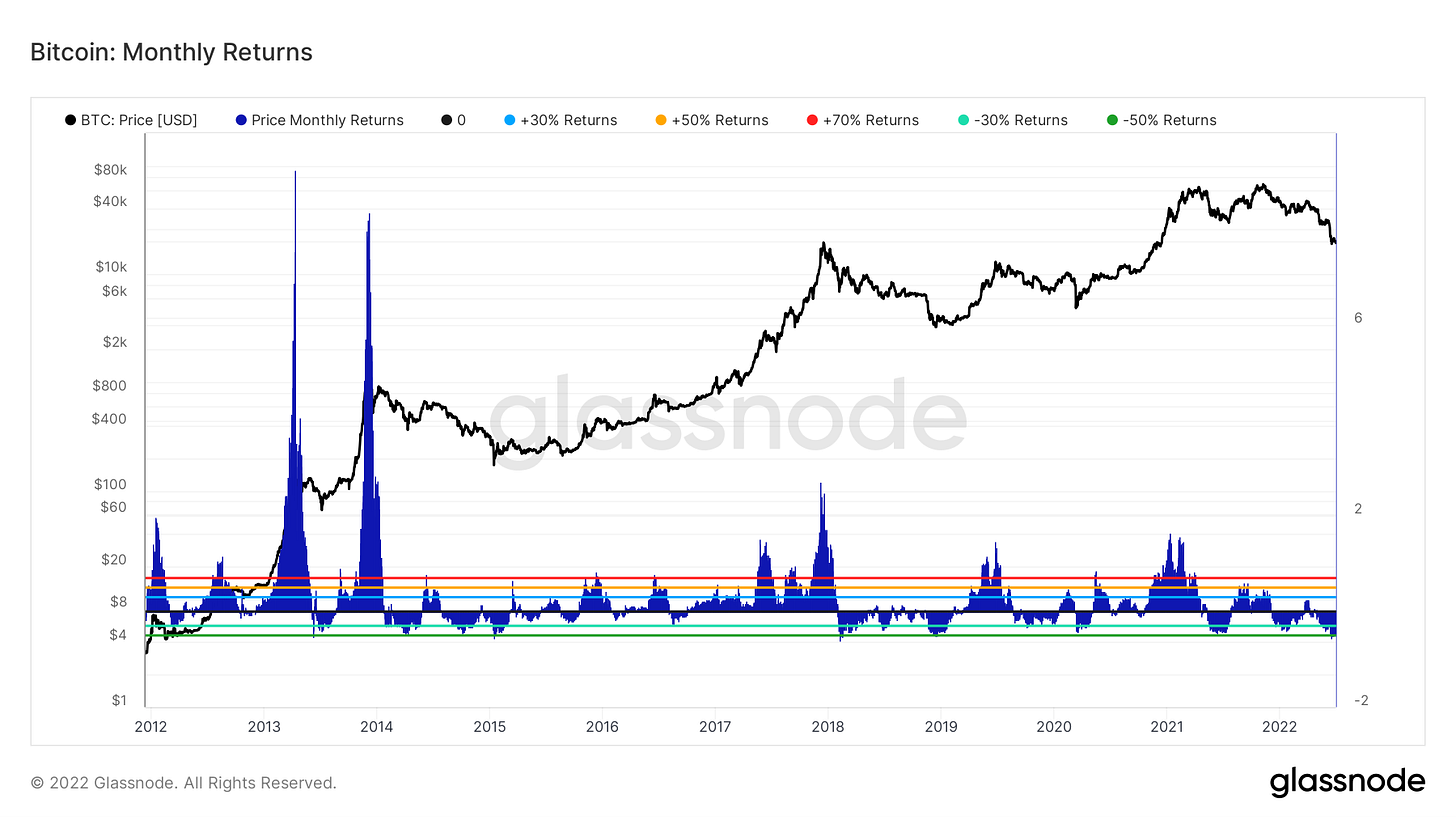
In terms of monthly performance, this has been one of the worst 2-month stretches for the asset in its history as well.
Following the death spiral of Terra Luna, we stated there would likely be more contagion to come in the ensuing weeks/months.
By no means did we expect things to get this sour this quickly. Unfortunately, like a virus spreading through an organism, we have seen the contagion spread rapidly through this infant financial eco-system. The spread accelerated rapidly after the implosion of 3 Arrows Capital, which was one of the largest entities in the space, with reach into just about every major lender, projects, and numerous treasuries of protocols. It is speculated that after losing money in an illiquid GBTC position (they couldn’t exist without incurring major slippage), 3 Arrows Death blow came from an investment in Luna as well as arbitrage trade on the 20% yield offered by Anchor. The parameters of this went as the following: Borrow from crypto lenders for less than 20%, deploy that capital into Anchor, return the funds to the original lender and keep the difference. The blowup of 3AC then spread to all the lenders they had borrowed from, including large entities such as Blockfi, Genesis, Celsius, Voyager. These effects then result in lenders margin calling other borrowers to verify solvency, causing some to have to liquidate token positions to do so. One tell tale sign of this taking place has been the correlation of BTC and alts. Aligning with monthly/quarterly end, this decorrelation is likely explained by the above paired with fund rebalancing, redemptions, etc.
One development that has been interesting has been the largest depletion of coins from exchanges in Bitcoin’s history. Becuase of the increased complexity of the market landscape, not sure how much of a price (esp short term) indication this is; but to me this does reflect one thing. It appears some of this contagion has market participants concerned about the state of centralized entities such as lending platforms, custodians, and exchanges, and thus have been taking self-custody of BTC.
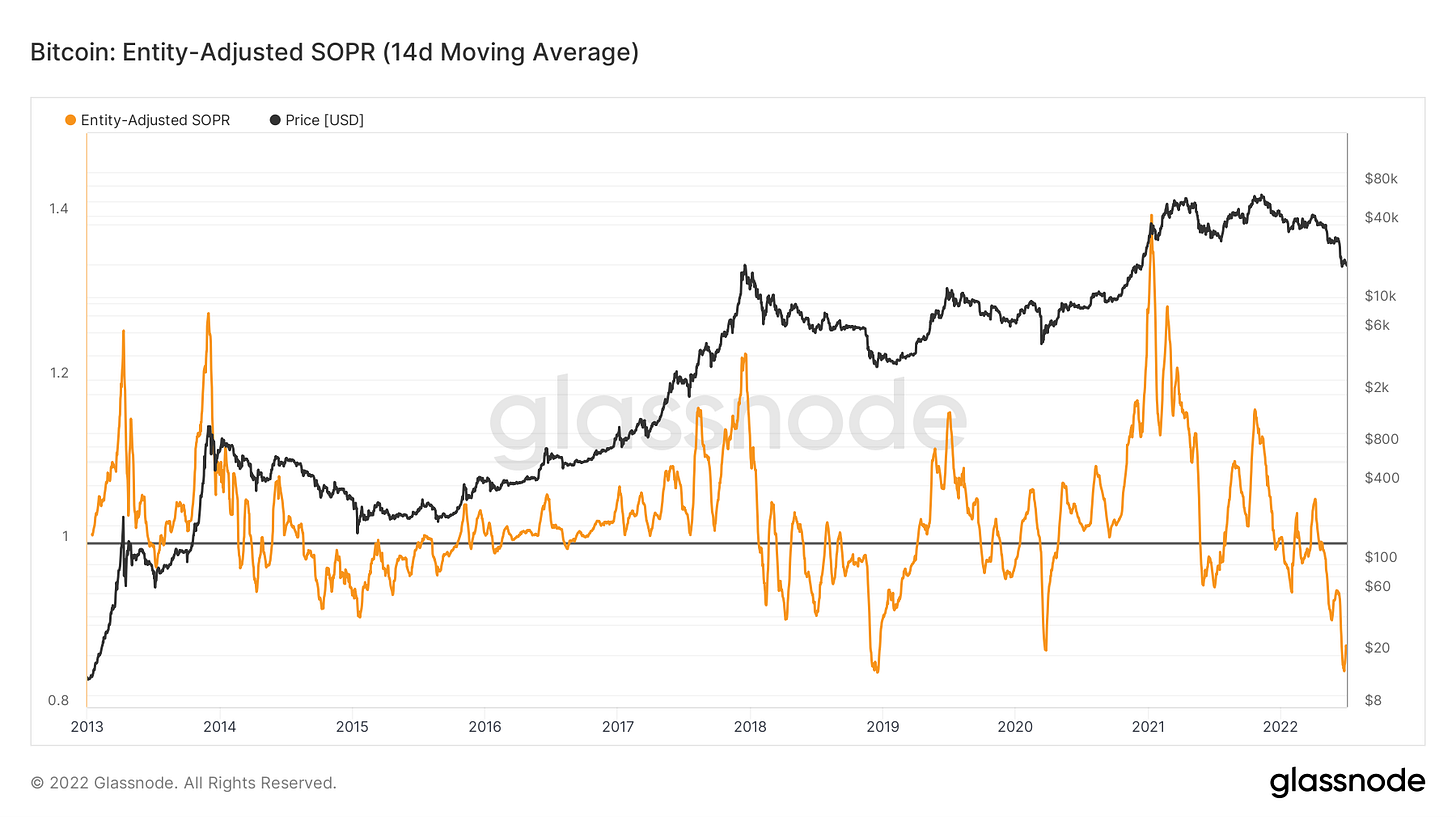
Anyways, capitulation is also reflected in on-chain metrics such as realized losses and Net Unrealized Profit/Loss, and Spent Output Profit Ratio.
We have also started to see some capitulation from miners. Don’t want to steal Joe’s thunder in the mining section, but for a few weeks, we’ve discussed the favorable conditions for miners to start having to unplug and capitulate, and have already seen a fair amount of measures of capitulation from them over the last month as well.
All of this uncertainty (rightfully so) has kept a lot of market participants on the sideline. This is reflected by a really interesting chart posted by Murad comparing the market cap of USDT and USDC to the total crypto market cap. This chart reflects the relative amount of dry powder sitting on the sidelines or deployed relative to the aggregated size of the market. If history continues, this is a signal of entering an accumulation/bottoming area.
I do view Bitcoin as extremely “cheap” right now. We’ll look at a few more metrics to illustrate this point.
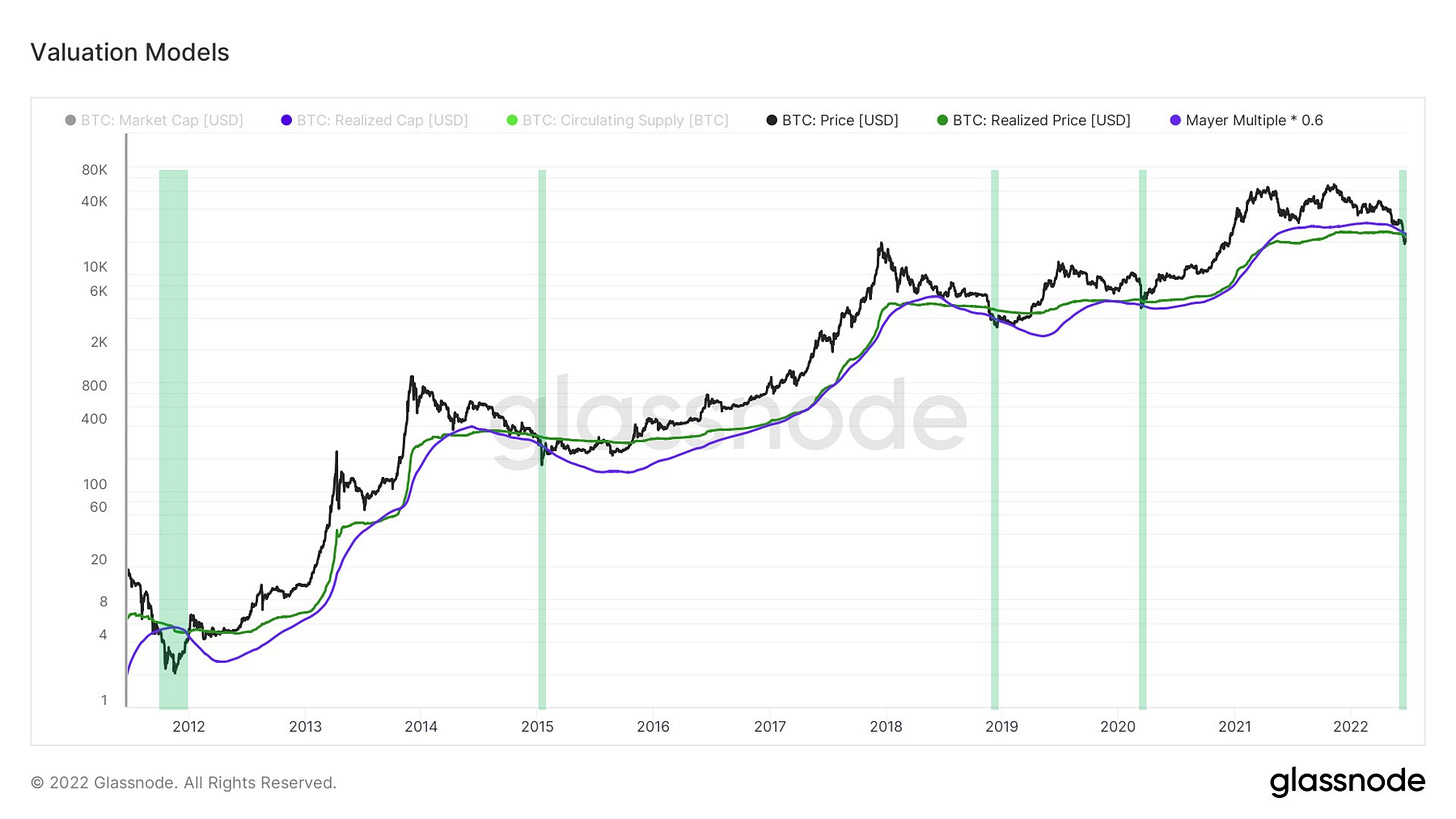
BTC’s market price is below realized price, which is the market capitalization based on the last time coins were moved on-chain. In other words, the market is underwater in aggregate.
From a pure price standpoint, Bitcoin is below its 4-year trend for just the fourth time ever.
For just ~3% of Bitcoin’s existence has it ever traded this far below its 200day moving average and below realized price.
All in all, I think it’s safe to say we have seen some major capitulation across the board: from lenders, funds, miners, general market participants, you name it. Have we seen capitulation in traditional markets through things like credit spreads completely blowout out, the VIX, etc? Maybe not, and that’s certainly something to keep in mind, but I personally have no edge in following those things and not going to do any macro larping for you. Although some might call me crazy for saying this, I view BTC as somewhat of a leading indicator for macro conditions over the last 2 years. BTC called the bluff on central banks saying inflation was transitory throughout all of 2020 and acted as an incredible debasement hedge, and sold off aggressively once it was clear monetary conditions would tighten. IF I am right, then you would likely see Bitcoin bottom first and rally whenever conditions begin to turn around months from now. My personal base case is that we’ve found an accumulation zone, and although have by many measures reached capitulation through price, should expect to consolidate for a few months, bore everyone, and create capitulation through time as everyone forgets Bitcoin exists. Bitcoin historically has given ample time to average into cyclical bottoms, so averaging in slowly or waiting for the dust to settle is certainly a prudent approach. However, with a multi-year time horizon, I personally couldn’t resist picking up some BTC at these levels of valuation as I’ve tweeted about. Stay liquid, stay well, capitalized, adjust your allocation strategy for these coming months to your level of conviction, not your keys not your coins, and above all please for the love of Satoshi do not become a forced seller.
Bitcoin Mining
Weak Miners are (Still) Capitulating
As mentioned in previous Blockware Intelligence Newsletters, hash ribbons (chart below) indicate whether miner capitulations are occurring. Miner capitulations are when a significant net % of miners turn off machines over an extended period.
With the next difficulty adjustment projected to be up in five days, it’s possible that this miner capitulation may be coming to an end soon. However, if the price does drop further, debt defaults could lead to Bitcoin and mining rig forced sells, creating yet another round of deeper capitulation.
How Much Leverage is in the Mining Industry?
There has been discussion about how many miners are overleveraged and that there are billions of dollars of debt at risk of default if a prolonged downturn does exist in the Bitcoin market.
The above chart from The Block Research indicates that the top publicly traded miners have ~ $1B in loans payable. This debt is secured by BTC, ASIC miners, and mining infrastructure. A quick glance at this figure seems to be in contrast with what was previously reported by Bloomberg that the actual miner debt figure is closer to $4B.
However, Ethan Vera, Chief Economist and Operating Officer at Luxor, mentioned that “there are many private miners bigger than some of those public companies. Last time we [Luxor] ran this analysis, public companies were less than a quarter of the overall market.”
Given that insight, the $4B number is accurate, and it indicates that if the price does continue dropping, there could be a significant number of entities forced to sell both BTC and mining rigs at even cheaper prices.
S19 Miner Profitability Matrix
As pointed out by Shaun Connell, EVP of Power, Lancium LLC, over the past 8 months, the S19 Pro miner breakeven dropped 75% from $484/MWh to $123/MWh.
Why?
Because bitcoin price dropped 75% & hash rate grew 31%.
Samsung 3NM Chip
The Elec reported that Samsung is starting trial production of its 3-nanometer (NM) foundry process as early as this week. The first customer in line? PanSemi, which is a subsidiary of MicroBT.
This will likely be more powerful and more efficient than the current top-of-the-line ASIC, the S19 XP, manufactured by Bitmain. Unlike ASICs being released around 2013, this new chip won’t make all other chips that are currently used to mine Bitcoin obsolete. It will be more powerful and have better operating margins, but it will continue to be in line with the idea that ASICs are commoditizing, so while this is an improvement, it’s not an unexpected game-changer for existing miners.
All content is for informational purposes only. This Blockware Intelligence Newsletter is of a general nature and does consider or address any individual circumstances and is not investment advice, nor should it be construed in any way as tax, accounting, legal, business, financial or regulatory advice. You should seek independent legal and financial advice, including advice as to tax consequences, before making any investment decision.










The analysis quality of this newsletter is getting better and better! Keep it going!