Blockware Intelligence Newsletter: Week 20
Bitcoin on-chain analysis, mining analysis, equity-analysis; overview of 1/01/22-1/07/22
Derivatives/On-Chain:
Dear readers,
Hope all is well you had a great week and start to the new year. After taking a short break for the holidays to write our 48-page year in review report. Check it out if you haven’t already in our substack!
The overweighing factor for the crypto market and all risk-on assets is the fear of monetary tightening and the effect that will have on markets. This is the trade-off of Bitcoin becoming an institutionalized asset - we will see it have a stronger correlation to macro and traditional markets. Although at Blockware we do see the overall macro trend of rates being down, a marginal rate hike that the Fed has been committing to in the intermediate term is not unfathomable. One has to wonder at what point would they revert back on such action whether it be a potential correction in the equity market or cease of political incentive to combat (or appear to be combatting) inflationary pressures that have affected the opinion of voters for upcoming midterms.
For the last month, Bitcoin has been in a tight range between $52,000 and $45,000. During that time period, I’ve been constantly talking about the build-up of open interest, specifically stablecoin margined open interest. In the perpetual futures market, rather than trading the underlying asset, you are trading contracts or what are essentially bets on the Bitcoin price. The reason people use these contracts is because of the massive amount of liquidity they offer (the most liquid Bitcoin product) and the ability to access cheap leverage. Open interest tells you the number of contracts that have been… opened, or are currently open. People constantly ask “can you show short open interest versus long open interest?” the answer is no. Why? There is a long and a short on both side of every contract. Open interest does not tell you about positioning of market participants (we’ll talk about that in a second), but rather shows you the amount of “pressure” through leverage position that is built up. In that sense I often look at the build-up of open interest as a proxy for when to expect major volatility in the BTC market. This paired with the fact that implied volatility (the volatility that is priced into the Bitcoin options market) was at the lowest it’s been since the summer, made me feel that volatility was inbound. You can buy non-directional volatility through the options market or something called MOVE contracts, but for the record, I did not execute on this. What good is analysis if executed poorly, lesson learned. Here’s my tweet from Monday:
So we talked about the fact that open interest is built up, but remember this only tells us how many contracts are open, not about positioning. To understand positioning we need to understand the risk structure of both sides of the open contracts. For example: On a contract, the long side is taken by a speculative retail degen seeking leverage, while on the short side is a delta-neutral (no-directional exposure) market-maker filling the order. You might be asking: if they are non-directional, how do market makers get paid? Answer is they get paid a marginal fee for the amount of liquidity they provide to each exchange. Hence why people are always talking about where liquidity is, because market makers are incentivized for price to reach those areas. Anyways, back to how we can guage the positioning of OI. To do this, we can get cute and look at things like long short ratio (looking at the amount of accounts net long versus net short), liquidation levels (although this doesn’t take stops into account and you’re probably better off just looking at price structure to guage this), or we can look at good old funding rates. Funding is the mechanism that pegs the perp price to the weighted index price. Every 8 hours a funding payment is provided from one end of the contract to the other to incentivize them to take the other side of the trade. When the perp price trades above the spot index, funding is positive. When below the spot index, funding is negative.
Last month we talked about the ideal case for bulls was to see a re-accumulation period showing negative to mixed funding, similar to summer. With this being said, funding hasn’t offered a clear signal to positioning over the last month. Aside from a few dips negative, it has overall just been muted. Not aggressively positive, not overly negative, just flat. To combat this, it is often wise to simply set clear invalidation points for your ideas or look for setups with clear invalidation for your trade idea. Hence this tweet:
With that last part in mind, I was personally doing a fair bit of Bitcoin shopping last night. (not financial advice of course) Why? Because we are at massive macro support, the invalidation for the idea is so clear, and this is the last level that makes sense to do so from a risk-reward standpoint.
In addition, massive bid-side support from FTX, the largest of which I’ve seen in over 6 months.
So where do we stand currently with derivatives?
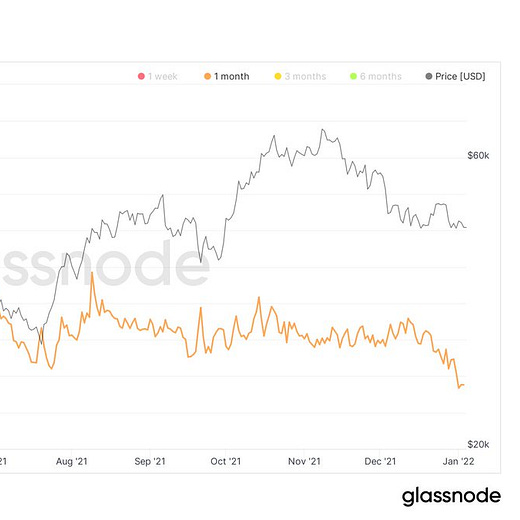
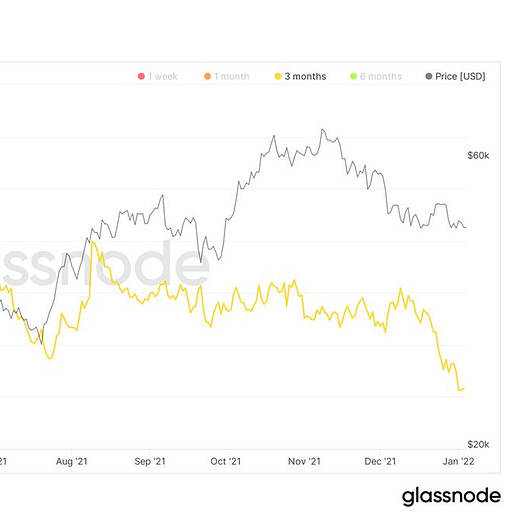
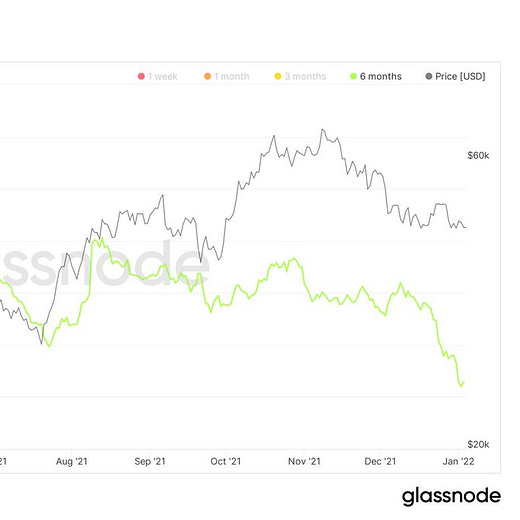
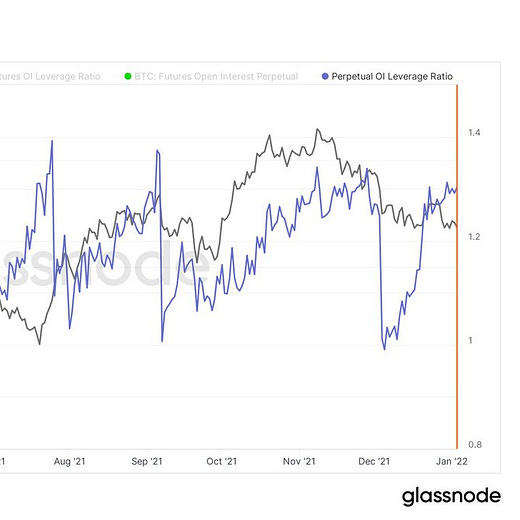
Perpetual futures open interest relative to market cap shows us the importance of derivatives on current market structure. We are now at the highest this metric has been since July, showing a massive amount of “pressure” built up through leveraged futures contracts. Again though, as mentioned I don’t think the positioning is quite as clear as late July for example when we were expecting a short squeeze (go back and read the letter I did for Pomp the last week of July), funding is slightly positive. Volatility is not over.
Stablecoin margined open interest on Binance specifically is still near the highest it’s ever been. Even after this recent price action which did wipe out a few hundred million dollars in open interest, still a long way to go.
You’ll notice I haven’t talked about on-chain much in the last month or so either on here or on Twitter. The reason is because when open interest is built up so much, derivatives data matters most, especially for this letter with a word limit. And just for those who are curious yes on-chain supply dynamics still look healthy, but of course this doesn’t take into account the demand side of the equation.
The one chart from an on-chain perspective that more conservative HTF traders may find interesting is short-term holder cost basis. You want to either buy support with clear invalidation below or buy the reclaim of prior resistance flipping to support. For those interested in the latter, still think this price band offers a solid level to do just that.
Crypto-Equities:
General Market Update
What a crazy past couple weeks it has been, particularly for tech stocks. With the Federal reserve tapering bond buying for the 3rd consecutive month, and it finally being the year we begin to see rate hikes, it's no surprise that the more speculative and risky technology names are selling off in favor of assets which benefit from high rate environments.
There is a large degree of macro uncertainty at the moment. The Fed even appears to be quite uncertain about the direction to head in, after the reaction we’ve seen in the equity markets.
That being said, this is why focusing on price action is so important. Technical analysts don’t need to care about the macroeconomic picture of the US or world. Price is king, therefore we can easily identify where capital is flowing into and out of. An individual opinion on where we head from here is irrelevant because the market will tell us through price action.
This current macro environment is favoring a few industries, so these are the ones we’ve seen behaving very well the last couple weeks. For example, we’ve seen XLP make new highs almost every day this week. This ETF tracks the performance of the consumer staples sector, traditionally a haven for funds who cannot hold cash.
XLP 1D (Tradingview)
This means that when it is no longer an ideal environment for tech stocks, many funds will transition to the opposite of tech as a proxy for cash. The consumer staples industry consists of basic goods like food, clothing, toothpaste, etc. Companies like Proctor & Gamble, Costco and PepsiCo make up the top holdings of XLP.
Historically, we’ve seen that when XLP starts to outperform, it’s generally a poor time to be long technology stocks, and vice versa. Below is a chart to compare the price action of IWO (Russell 2000 Growth ETF) and XLP. By observing this chart, you can find many instances in which strong price action in one ETF, caused an adverse reaction in the other.
XLP & IWO Comparison (Marketsmith)
It is a stretch to say the price action in one ETF, CAUSED the price action in the other to change. Instead, what is happening is a rotation of capital. Imagine consumer staples and growth tech stocks like the ends of a seesaw. As institutional capital flows into one, price rises there. Once price rises on one end, it is likely that price will fall on the other. While it isn’t an exact inverse relationship, a macro breakout in one generally doesn’t bode well for the other. This tends to happen back and forth between these two sectors during market cycles.
Another strong area of the equity markets currently are bank stocks. Many have behaved very well and are breaking out of large bases to the upside. As interest rates rise, business becomes more profitable for lenders. So unsurprisingly, bank stocks have been shaping up for weeks before finally breaking out.
One bank stock that is surprising me, personally, is Customers Bancorp (CUBI). I discussed CUBI in the last newsletter and it is still acting well. What surprises me is that despite the sell off in crypto, and crypto-exposed equities, CUBI has been making new all-time highs every day this week. CUBI is a traditional bank reimagined to use crypto tools, such as their CBIT stablecoin, in order to provide customers with near-instant settlements with minimal fees.
It isn’t a surprise that a company like this could perform well in the market. More so, it’s interesting to see a crypto-exposed name who isn't being subjected to the bloodbath we’re seeing in mining stocks and crypto exchanges.
Crypto-Exposed Stocks in January
With a continued sell off in Bitcoin, I think it comes to the surprise of none that crypto-exposed names have been extremely beat up. For longterm hodlers of these names, this is most likely an opportunity to accumulate more shares at a discounted price. But many traders were hurt badly in these moves if they weren’t disciplined with their risk management.
These sell offs are very exciting to me, as we finally get to build new bases and find new buy opportunities. This is all dependent on your personal conviction in the underlying asset of Bitcoin. It is important to not formulate hard opinions on what you think price action will do. Instead it’s best to think in terms of “If, then”.
We know that crypto-exposed stocks generally trade alongside BTC, with varying degrees of volatility. So, personally, IF bitcoin can reverse and hold $42,333, THEN I will begin to look for trades in crypto-exposed stocks. IF bitcoin fails to hold $42,333 THEN I will ignore crypto-exposed setups until BTC can find another support level.
It is also going to be very helpful to work on identifying the strongest names in the industry group. Below is an excel sheet that breaks down how far some of these names corrected, compared to BTC. These numbers aren’t totally up to date, they do not compare prices from this week. Instead, I used the BTC correction bottom as the long liquidation lows from 12/4 and the equity bottoms from 12/20.
I will continue to update this as we currently make another leg lower. For now, seeing how well each name has held up the past couple months or so is key to identifying price action leaders. I believe that names who’ve corrected at most 10% more than BTC qualify as a generally strong name.
The outlier in this study is COIN. COIN is the only name in this basket who sold off less than the 39% that bitcoin did (2.01% less to be exact). This is a very strong indication to me that Coinbase is an institution favorite and despite price being down, there is obviously much less of a degree of selling here compared to the other names.
Another interesting name at the moment is BTCS. Many of you have likely heard the news released on Wednesday, that BTCS will be paying a “bividend”. Making them the first publicly traded company to pay their dividend in bitcoin. While this is a low priced, low liquidity name, it is certainly a step in the right direction for continued corporate bitcoin adoption. Shares traded ~44% higher on this news.
Bitcoin Mining Update:
No Difficulty All-Time High… yet
While many people have cited Bitcoin’s hash rate reaching a new all-time high, network difficulty, which is the actual metric that determines miner profitability, has yet to hit a new all-time high.
The current network difficulty is at 24.27 T, and the difficulty all-time high set in May of 2021 was 25.05 T. This indicates that difficulty will need to increase roughly 3.2% in order to surpass the previous all-time high. Because blocks are on average only coming in a few seconds faster than the 10 minute expected block time, it is unlikely that we will see difficulty adjust to a new all-time high in the next couple of days.
Chart Source: https://data.hashrateindex.com/chart/bitcoin-price-and-difficulty
This can partially be attributed to the internet blackouts and nationwide protests in Kazakhstan. Many may be surprised to hear this, but as of August 2021, Kazakhstan accounted for 21.2% of the entire Bitcoin hash rate. This was an attractive location to set up mining farms due to cheap abundant coal power, and it was a popular location for Chinese miners to escape to after the mining ban.
In hindsight, it continues to highlight the importance of setting up mining farms in friendly stable jurisdictions like the US.
Mining Data and Analytics Podcast Episode - On The Brink
This week I listened to a fantastic podcast from Luxor’s COO and CPO Ethan Vera and Guzman Pintos on On The Brink. They dove into very interesting mining insights that I’ll highlight.
15-30 EH/s of hash rate is likely still in China. Even after the China mining ban, smaller-scale mining farms have likely remained in operation or turned their machines back on (illegally). It’s difficult to completely shut down a decentralized network, especially when it’s highly profitable to defend that network.
It has been a common rumor that ASIC manufacturers used to be mining on machines for a significant amount of time before sending them out to customers (“testing” machines for over 1 month). Ethan thinks this doesn’t occur as often as it did. However, ASIC manufacturers definitely have their own farms. Canaan has 1.7 EH/s. Bitmain likely more.
90%+ of publicly traded miners are actively trying to accumulate as much Bitcoin as they can. They are leveraging capital markets to fund their operations and capital expenditures to seek the highest growth potential. Notably, this is very different from gold miners, who hardly hold any gold on their balance sheet.


love ya work ,maybe expand on the options effect someday would be greatly appreciated ,cheers
You have a great newsletter!! I only read Coinzy.com and yours!!