If you make over $150k per year, you could be 5 to 7 years away from retiring. Our partner Mark Moss will show you how in this free guide:

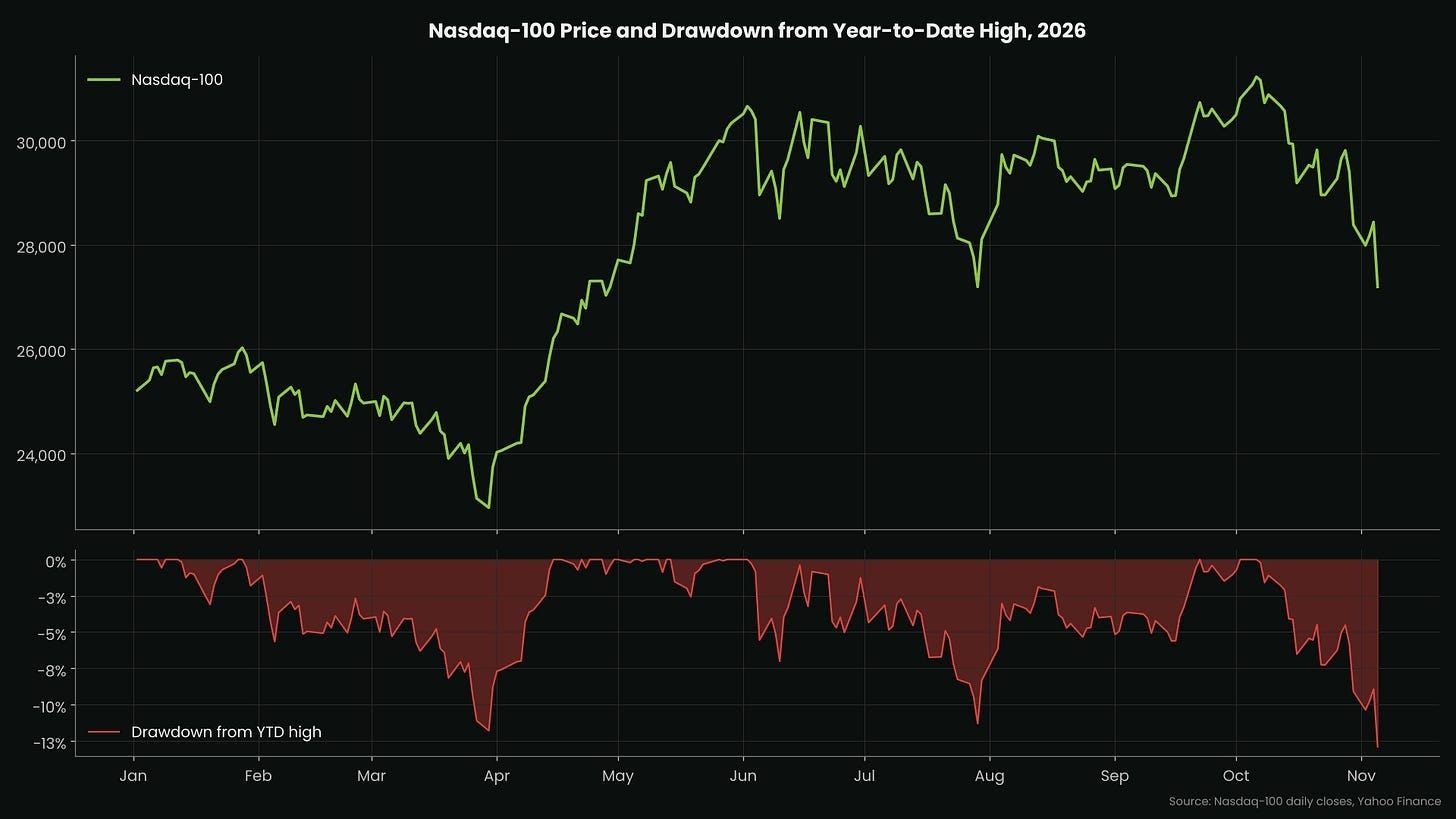
Yesterday the Nasdaq-100 dropped 6.4%, its worst day since March 2020. The index is now down ~15% from its October 6th all-time high.
Did the blue wave pop the AI bubble, or is this a “buy the dip” opportunity? Let’s look at the data.
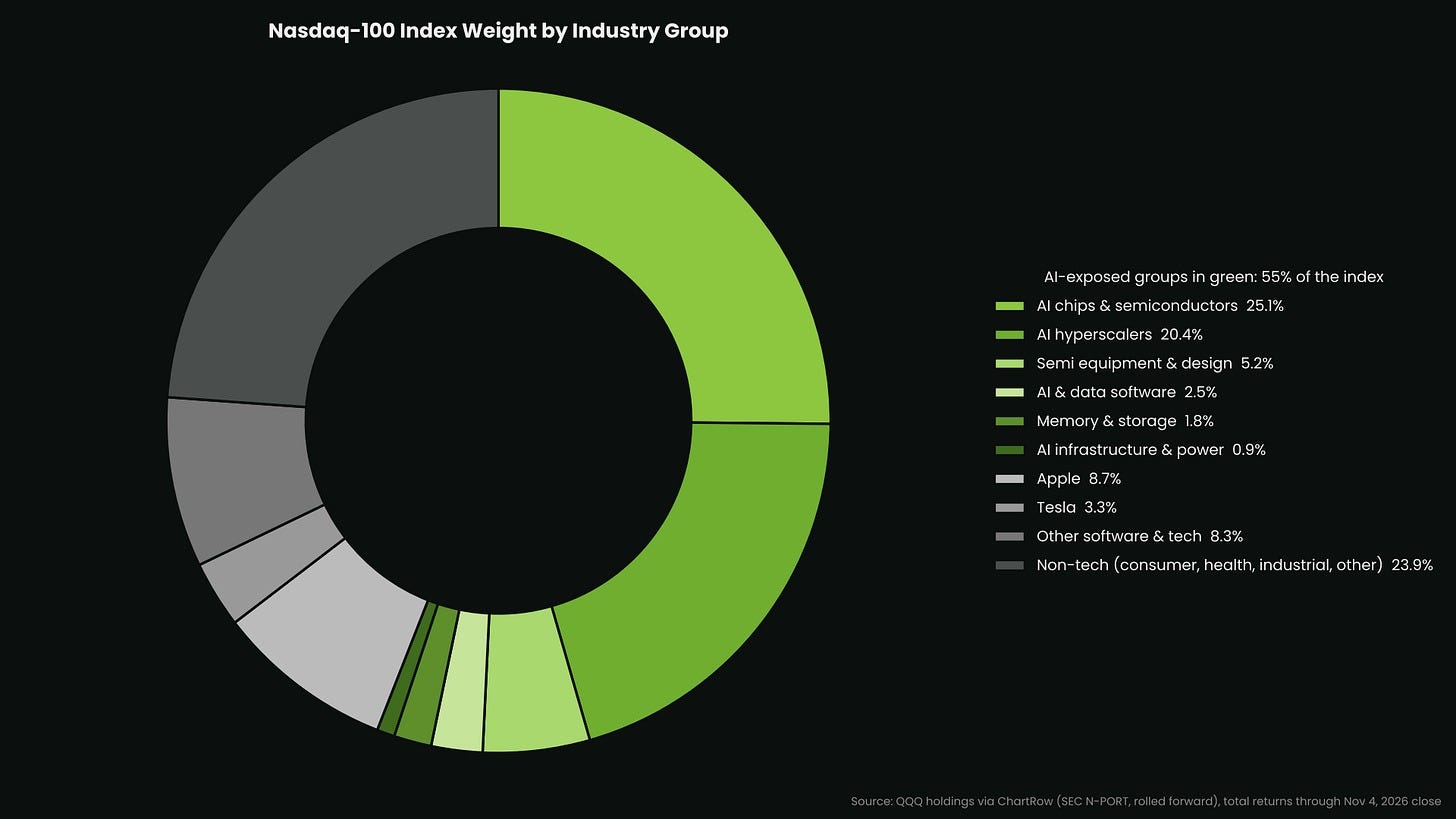
We’ll start by quantifying the concentration of AI within the index. Roughly 55% of the Nasdaq-100 by weight is AI exposed (chips, semiconductors, hyperscalers and the data center supply chain), and this group has been the largest contributor to the drawdown over the past week and month.
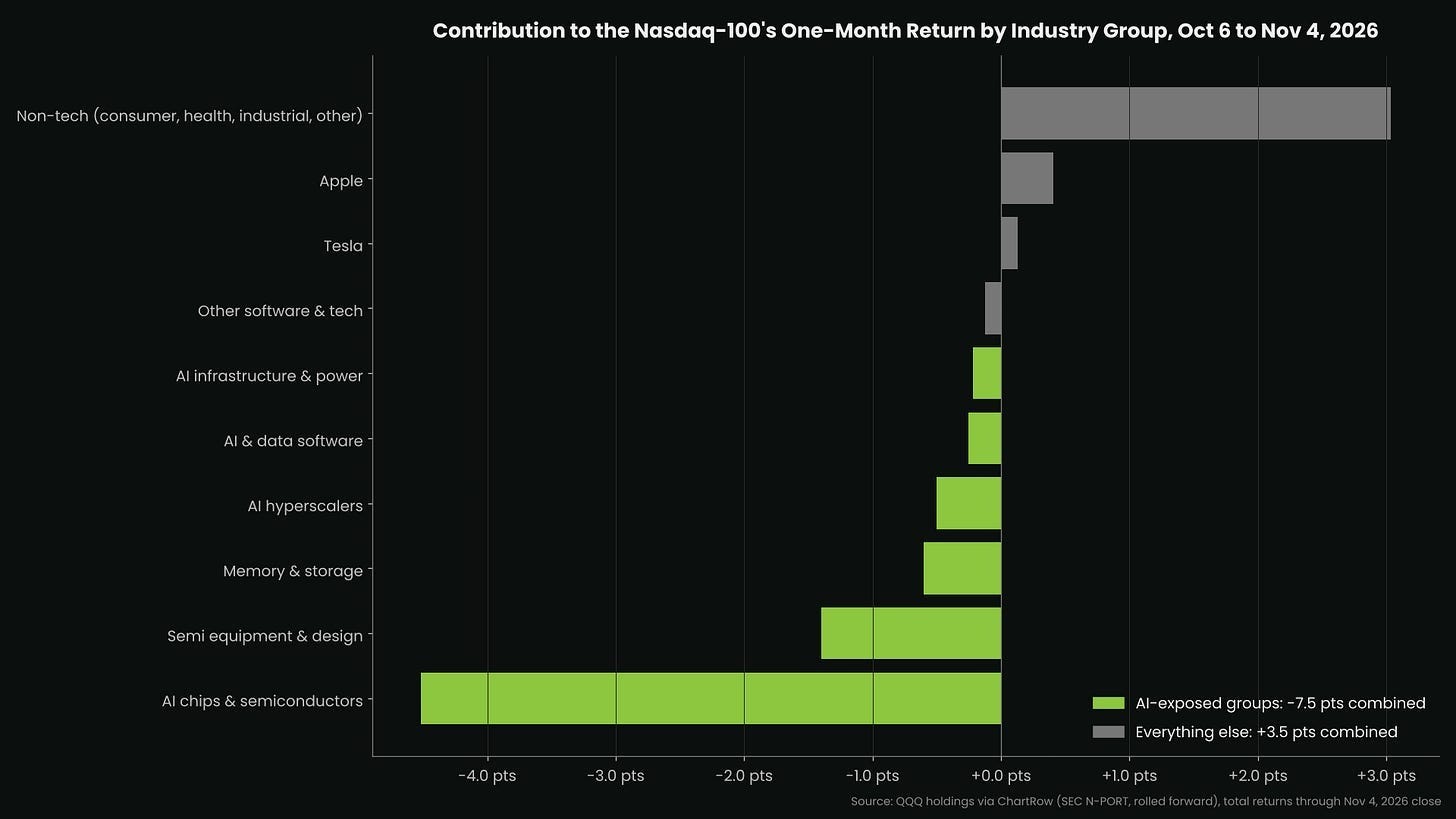
The chart below shows the performance of each sector over the past month. Non-tech equities, plus Apple and Microsoft, are the only groups boasting a positive month-over-month performance. AI chips and semiconductors are down by an average of more than 4% over that stretch, and several of the names leading the index lower have lost more than half their value since the October 6th high.
Sign up for a FREE 3-part webinar series from The Bitcoin Way to learn why you need a Plan B residency and how to get one

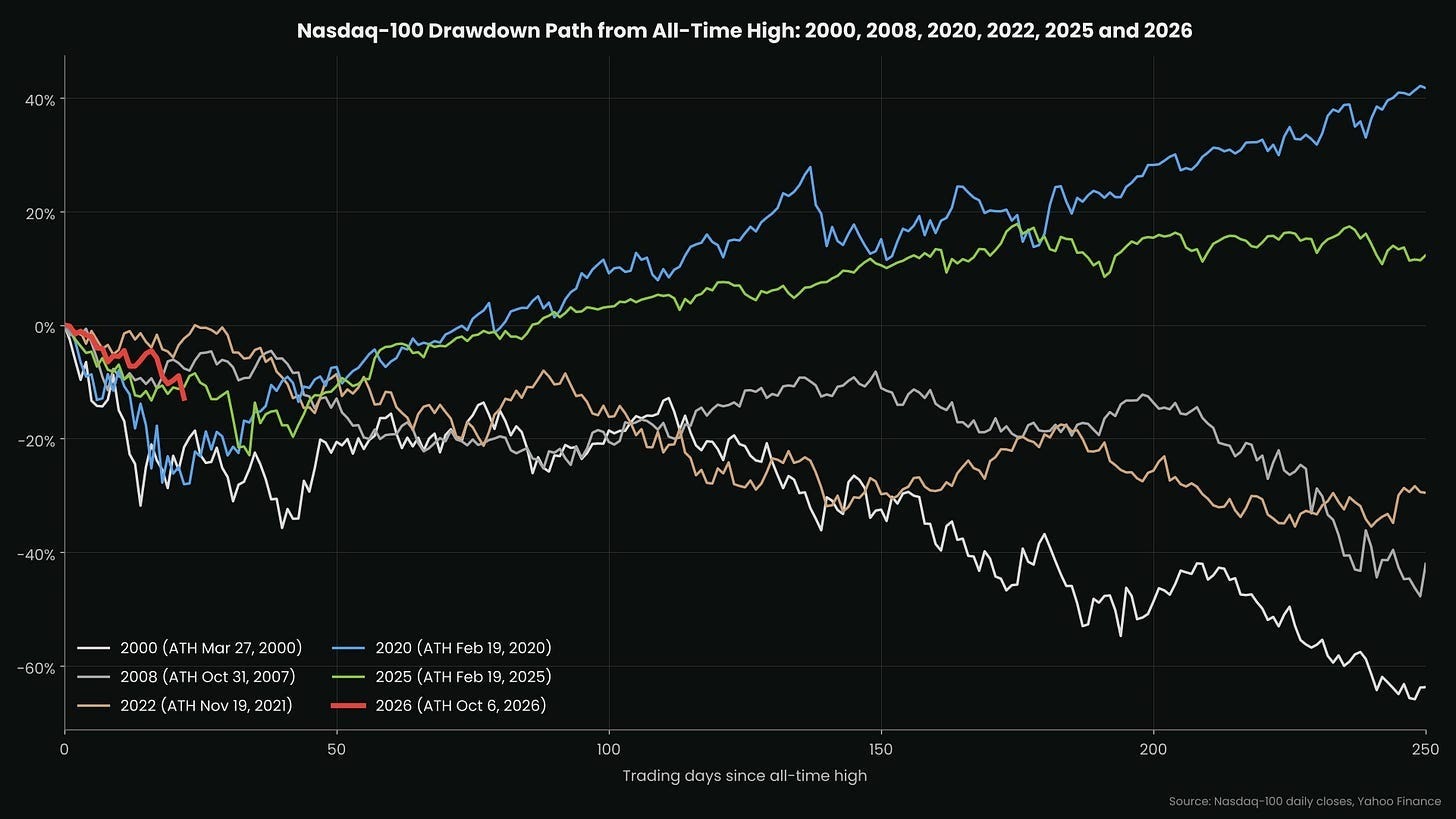
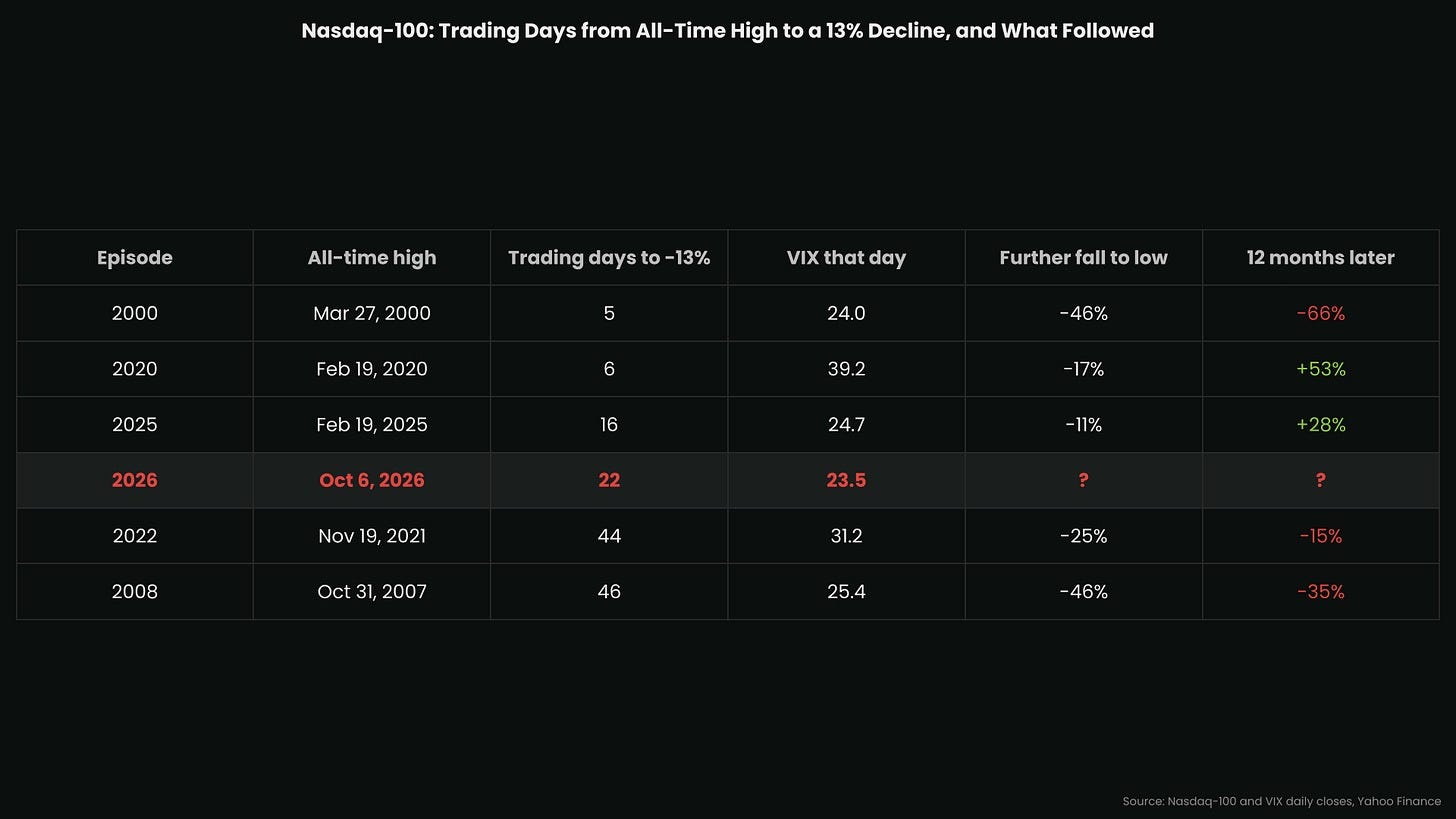
The chart below compares this pullback to similar Nasdaq drawdowns over the past few decades:
2000 (Dot-Com Bust)
2008 (GFC)
2020 (Covid)
2022 (Rate Hikes)
2025 (Tariff Tantrum)
22 trading days have elapsed since the Nasdaq’s all-time high. For reference, a drawdown of this magnitude happened much more quickly during the Dot-Com Bust (5 trading days) and Covid (6 trading days). Meanwhile, 2008 and 2022 were longer, more drawn out bear markets, with the index taking 46 and 44 trading days respectively to reach this same pullback.
Based on the velocity of the drawdown, the Nasdaq right now more closely resembles the tariff tantrum of 2025, which was a “buy the dip” moment rather than the beginning of a bear market. One honest caveat: at this exact point in every one of these episodes, the index was lower a month later, and only after that did the paths split into sharp recoveries (2020, 2025) and real bear markets (2000, 2008, 2022). The first month looks the same either way. What separates the two groups is the catalyst. 2008 and 2022 were credit and rate breaks. 2020 and 2025 were sentiment and policy shocks that reversed. Today is a sentiment shock about AI returns plus an election, with no credit event and the Fed not hiking, which is why I lean toward the 2025 comparison.
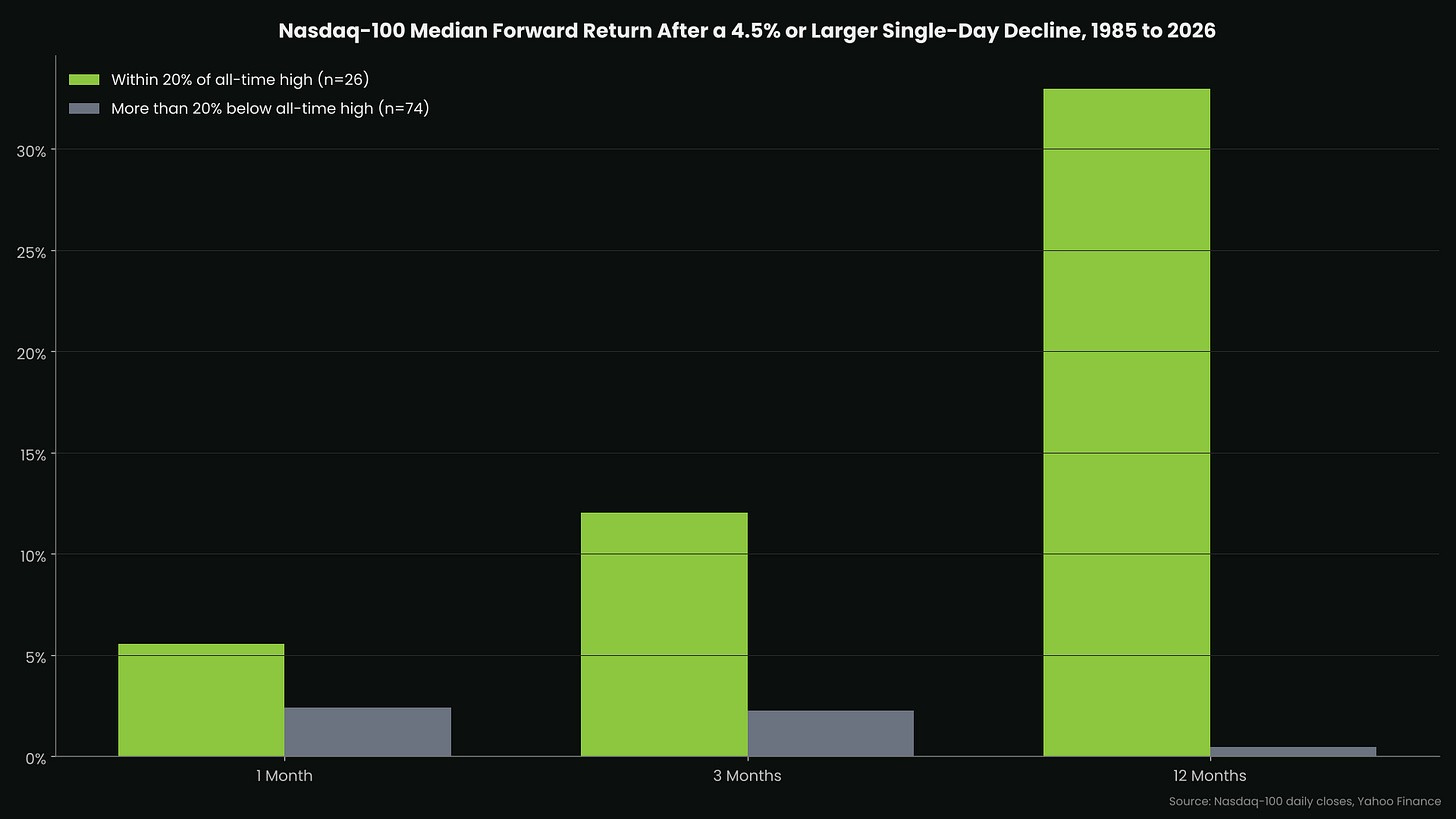
This bar chart quantifies the difference between “buy the dip” pullbacks and actual bear market price action. When the Nasdaq has had a -4.5% or worse daily candle, as it did on Thursday, the forward-looking returns are far greater if the index is within 20% of its all-time high. The same bad trading day inside a broader downtrend (more than 20% off the all-time high) tells a very different story.
Historically, when these dips happen within 20% of the all-time high, the Nasdaq’s median return over the next 12 months is ~33%, with the index higher two-thirds of the time. When they happen further off the high, the median 12-month return drops to roughly zero.
The broader trend matters.
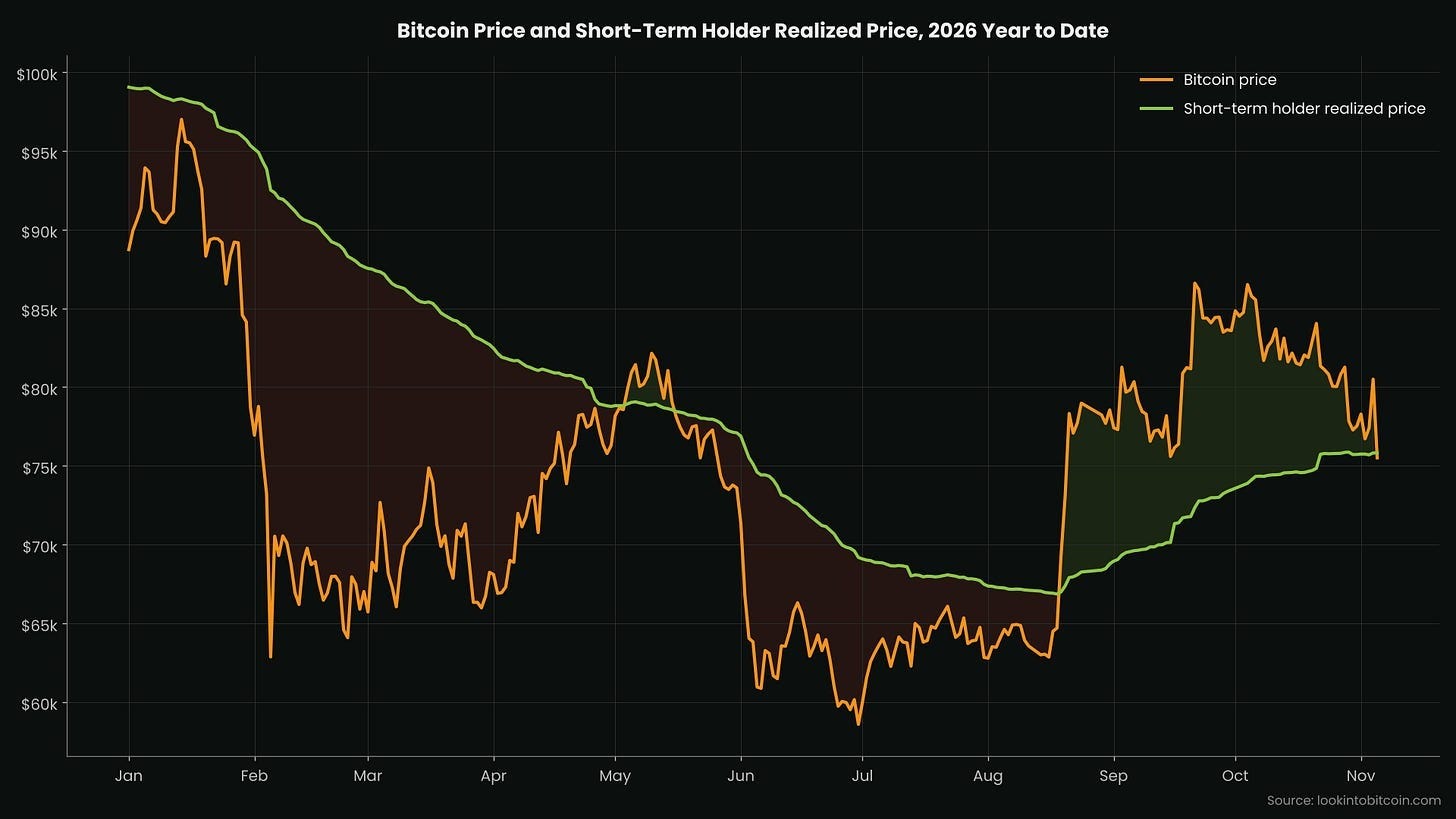
The tech pullback has, unsurprisingly, brought BTC down with it. However, BTC is showing incredible resilience around $76,000; which, as it stands, is right where the most important on-chain support level is at. Bitcoin is sitting comfortably at the cost-basis of short-term holders and if it can hold this level you should expect a strong performance into the end of the year.
Bitcoin reclaimed this level in August for the first time in ten months and held it for 78 days before Thursday’s retest. The last two times it retested the short-term holder cost basis after a reclaim, in October 2023 and September 2024, it held and gained more than 55% over the following 90 days. The one time it failed, in October 2025, it fell 22%. This is the level to watch.
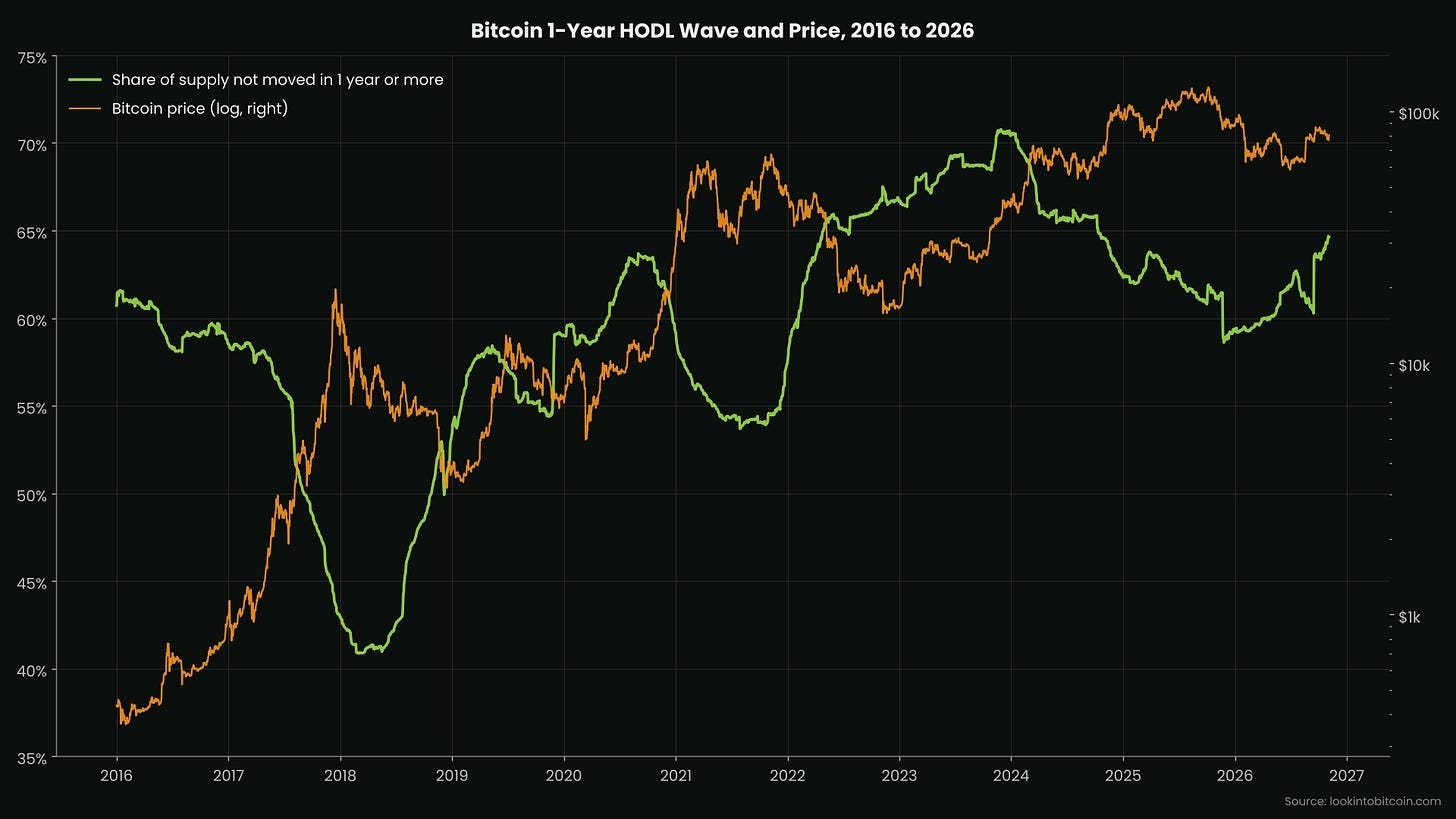
On the supply side, Bitcoin is exhibiting behavior characteristic of past bear-market recovery periods. Roughly 64% of the Bitcoin supply has not moved in over a year. Despite:
BTC dropping as much as 50% from the ATH earlier this year
Quantum FUD
The Coldcard hack
The Binance hack
Gold and equities making new ATHs
Nearly two-thirds of all Bitcoin still hasn’t moved, and that number has been climbing for the past twelve months. We’re seeing a strong resemblance to 2023. As price consolidated, supply began to freeze up as long-term holders steadily accumulated at discounted prices, ultimately leading to a supply squeeze in late Q4 2023 and Q1 2024.
The best way to capitalize on a strong 2027 for Bitcoin is by purchasing Bitcoin miners in 2026. Machines placed in service before 12/31/2026 qualify for 100% bonus depreciation. Meanwhile, they will produce BTC every day at a discount.
Blockware provides a white-glove Bitcoin mining service; covering everything from hardware sourcing to clean documentation you can give to your CPA.
Sign up for a free consultation to learn more: https://blockwaresolutions.com/info