Weekly On-Chain Overview 7/30
Supply squeeze now underway
On-Chain 7/29/2021
William Clemente
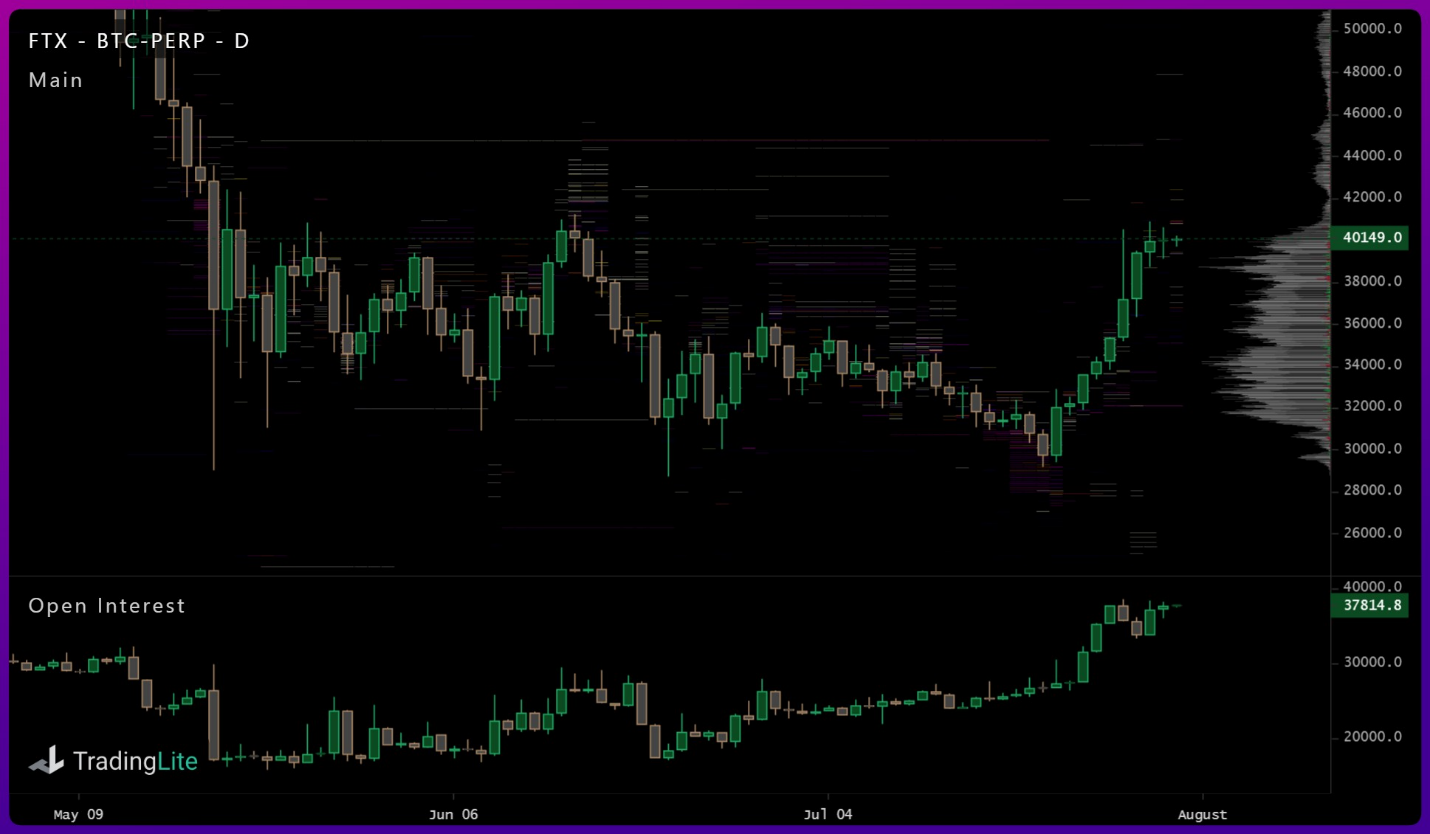
Dear readers, hope all is well. After weeks of following the strong divergence between on-chain investor behavior and price, it looks like we are finally starting to see that translation into price action. As we were watching for in last Friday’s letter, we got a short squeeze on Sunday evening that liquidated over $110M in shorts within minutes.
This added momentum to a rally that now has given the market 9 straight green daily candles.
Let’s dive into some of the developments from this week. As always, here’s some high-level takeaways:
- Very strong outflows from exchanges
- Continued miner accumulation
- Continued accumulation from “strong hands” (entities with little selling history)
- Every major cohort adding except for 100-1K BTC (sideways)
- Some profits taken during the rally over the last few days, young coins mostly (likely from this range)
- On-chain activity (active addresses, transfer volume, etc.) is still overall flat
- Supply is trading in profit again
To start, let’s look at a metric that follows the broader context of accumulation in the Bitcoin market. This indicator I created runs a 365-day stoch RSI over the 30-day net change of illiquid supply. 30-day net change meaning the difference between illiquid supply today and this date last month. I use this to follow the wave of “supply shock” brewing underneath the market. You can see in the RSI what I’m referring to by the “wave” of supply shock; highlighted by the green arrow. This supply shock propelled the bull run higher in late 2020. Looking at it now, this has not only started printing a buy signal, but the rate of change from the sell signal in May to now is quite impressive. To me this indicates that the momentum from this wave of supply shock is strong.
Just for kicks, here’s the metric back-tested in 2017/2018. Buy signals don’t come often, but when they do, they are very accurate in a broader context.
Important note: The data used below for illiquid supply, exchange balances, and supply held by different cohorts is all one day old. I have never done this before in the newsletter, but I feel that it’s appropriate because of the following: On Thursday there were massive reported outflows from several exchanges, including over 108K BTC from Kraken; showing their balance has dropped down to 62,859 BTC. I am highly skeptical of these flows, which effect other entity related data including illiquid supply. I suspect it is just end of month routine internal shuffling that will be picked up in a few days by Glassnode’s heuristics. Hope you understand, would rather be on the safe side and not spread data that likely needs to be updated. We’ll have confirmation by the time we speak again next week, as Glassnode is looking deeper into the flows.
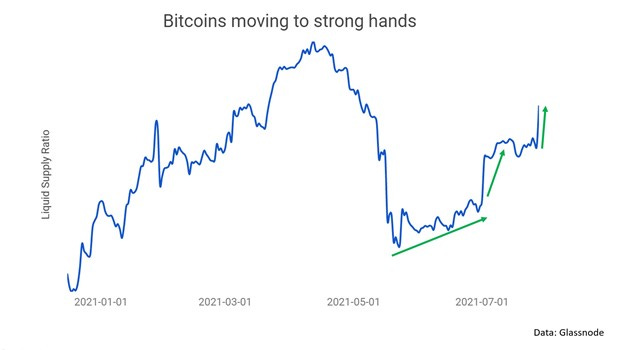
So, we’ve looked at the supply shock in a broader sense, but now let’s take a more real time look at this movement of coins from “weak” to “strong” hands. To do so we’ll use liquid supply ratio, showing another uptick. After tracking this re-accumulation process since May, it is now almost fully complete. Supply shock is at levels that previous priced Bitcoin at 50K-60K.
Exchange balances have taken another drop, once again showing accumulation: down 66,655 BTC this week. As mentioned, this is excluding data from Thursday.
This drop in exchange balances has triggered a buy signal in the exchange flow Bollinger bands. This follows large moves in exchange flows: when massive inflows occur selling is assumed, when massive outflows occur accumulation is assumed. With this framework we can create buy/sell signals based on when the metric breaks out of the bands in either direction.
The market is taking some profits on this rally though, realizing up to $2.4B in net realized profit on Tuesday. This isn’t alarming imo and is to be expected after we’ve sat at the bottom of a range for weeks. But just to do some further investigation, I find it prudent to look at the age of the coins being sold. If we see strong profit-taking from older coins fading every bounce looking for exit liquidity that’s not ideal. So, here’s what can be found upon further investigation.
Looking at the average age of the coins being sold, this continues to go sideways, with the broader multi-month trend still clearly down. We actually had a downtick in the age of coins sold on Tuesday, coinciding this with the $2.4B of profit realized means those coins were likely newly bought in this range, not experienced market participants.
And to just go a step further, here’s the spike on Tuesday of coins being spent between 1 week and 3 months old. (within this 30k-40k range) No major coinciding spike from older cohorts.
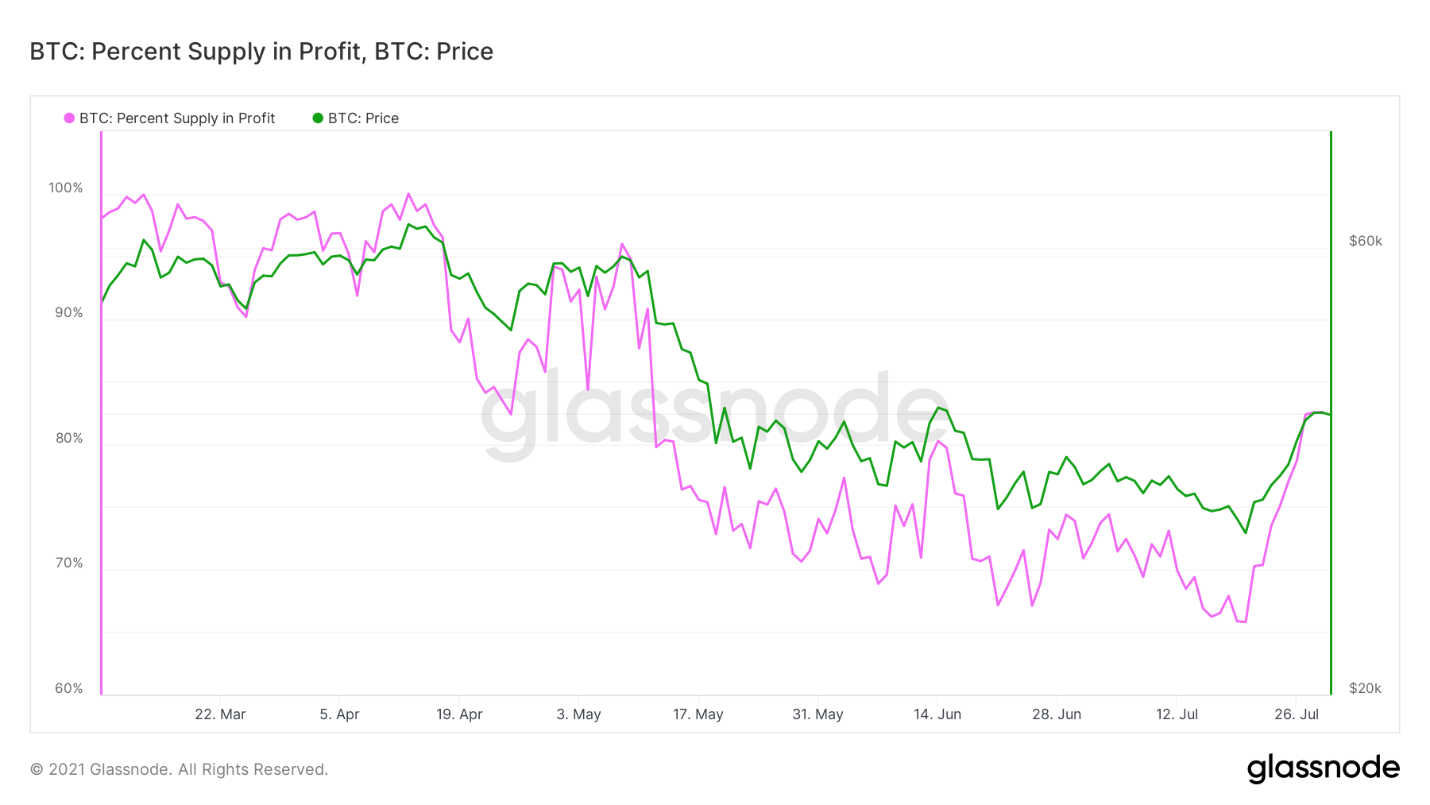
On a similar note, this recent rally has increased the percentage of total supply in profit from 65.82% on the 20th to 82.58% at the time of writing. The last time the percentage of supply in profit was this high Bitcoin was priced at nearly $50k. This is inadvertently another way to note how many coins were re-absorbed in this 30k-40k range, as coins had to be last spent at lower prices for that to be true.
A last note on profit-taking, here’s SOPR (spent output profit ratio), adjusted for Glassnode’s entity clustering. This shows the market is once again trading in a state of net profit. Would like to see this indicator stabilize above 1 (black line) or bounce off 1 on a price correction to get bullish confirmation.
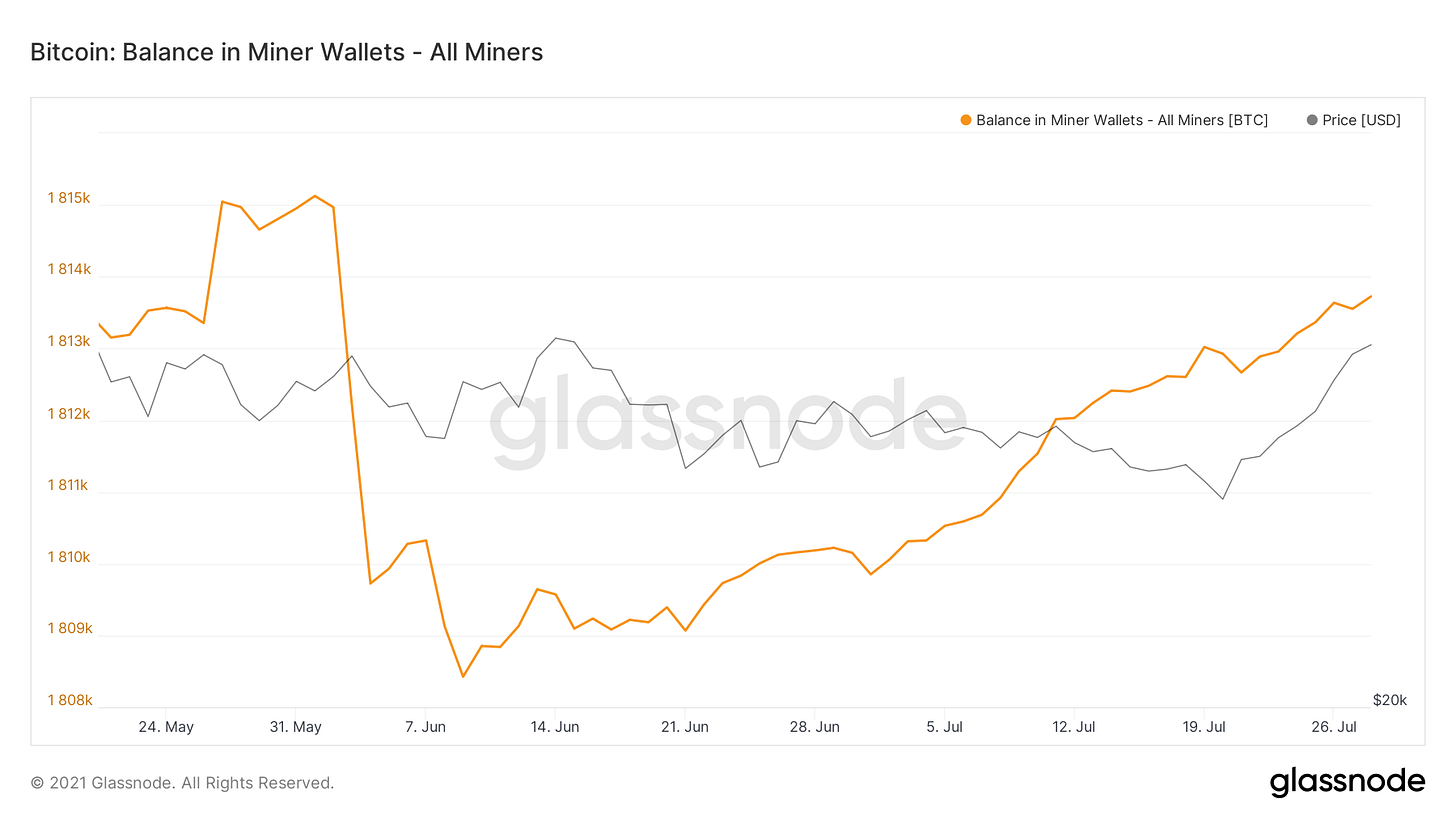
Miners continue the heavy accumulation that we’ve been tracking for almost 2 months now. After the drop in hash rate and a massive difficulty adjustment, the miners still on the network are very profitable. This is because the amount of hash competing for block rewards is much less.
Lastly, on-chain activity is still overall pretty dead. Would like to see an increase in the number of transactions, size of the mempool, and continued (since Jun 27th) increase in active addresses to gain confidence that network activity is as bullish as accumulation activity seems to be.
Sponsored by: Masterworks
The Best Thing Since Bitcoin?
Ok guys, it's no secret I am irresponsibly long BTC in my portfolio. But even I know you have to diversify into other asset classes like elite investors do.
You need an asset that's not gonna get murdered by J Pow's endless money printing and Biden's $6 trillion stimulus plan. In this search for alternative investments, I came across Masterworks.
They let you invest in multi-million dollar paintings by artists like Warhol and Banksy that their team hand-picks based on a proprietary database of auction data.
I'm intrigued by art as an investment because, like BTC, its supply is not only fixed but can even decline.
It's not like the Fed can print more Picassos, so it can be a great hedge against inflation and store of value.
Want more? Good, strap in. Contemporary art prices outperformed traditional inflation hedges like gold and real estate by more than 2X, while crushing S&P 500 returns by 174% from 1995-2020.
So don't miss out like you might have when bitcoin hit $30k last week.
I’ve teamed up with Masterworks to let my subscribers skip their waitlist and join the other 185,000 members by using this private link.


the hits keep coming. hold fast friends.
Will, where can I find your podcast?