Blockware Intelligence Newsletter: Week 51
Blockware Intelligence Sponsors
If you are interested in sponsoring Blockware Intelligence email: sponsor@blockwaresolutions.com.
Blockware Solutions - Buy and host Bitcoin mining rigs to passively earn BTC by securing the network. Your mining rigs, your keys, your Bitcoin.
Know someone who would benefit from concierge service and world class expertise when buying Bitcoin? Give them one year of free membership in Swan Private Client Services ($3000 value) -- email blockwareHNW@swan.com and we’ll hook it up! (And yes, you can give it to yourself 🤣)
Summary
The release of the July FOMC meeting minutes on Wednesday reaffirmed the Fed’s position to raise interest rates and destroy demand.
On Tuesday, the S&P 500 ran into fairly significant selling around its 200-day SMA, giving it an eerily similar look to late-2001.
Weakness in spot Bitcoin price action has injected varying degrees of sell pressure into crypto-exposed equities.
According to the hash ribbon metric, Bitcoin is 73 days into a miner capitulation. The end of a miner capitulation historically marks a bear market bottom. There are signs that difficulty bottomed.
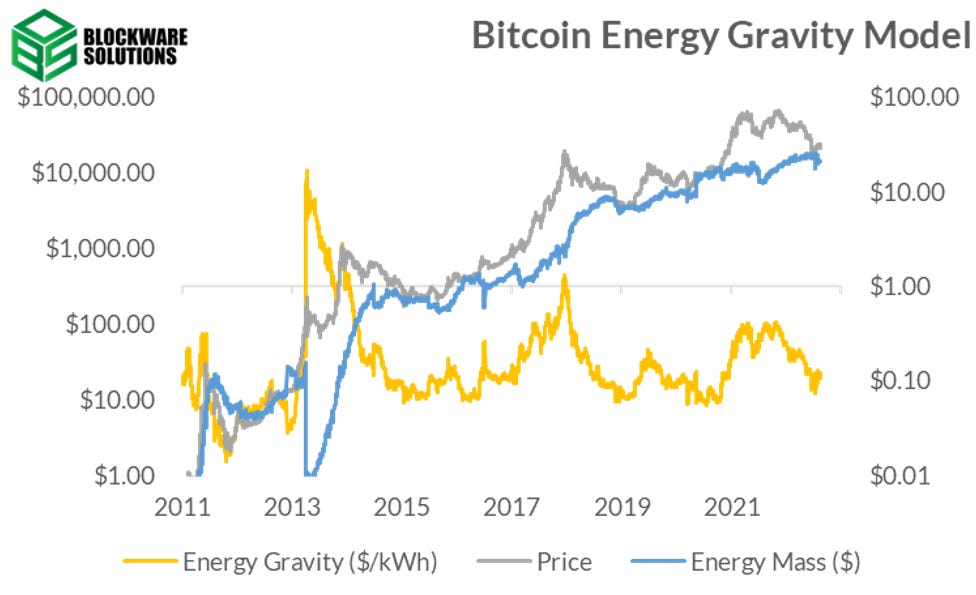
Bitcoin’s Energy Gravity currently sits at $0.11, meaning that the modern mining rig (~ 38 W/TH) earns 11 cents for every kWh consumed.
This Week’s Blockware Intelligence Podcast
Bitcoin & Money, ETH Merge, and Bitcoin DeFi with Checkmate from Glassnode
✅ Bitcoin and Money
✅ Upcoming ETH merge blunder
✅ Toxic Maximalism
✅ Defi on Bitcoin
General Market Update
It’s been a relatively quiet week for the general market, in comparison to what we’ve seen the last few weeks.
One key news story this week comes from Wednesday’s release of the Fed minutes from their July meeting. For those who aren’t aware, the Fed minutes are a detailed account of what was discussed in the closed-door FOMC meeting.
Based on the minutes, the Fed remains strong in their conviction to raise interest rates and hold them elevated for however long it takes to bring down inflation. Remember that this is the primary goal of the Fed’s policy in 2022.
Higher debt servicing costs take money out of the hands of companies and citizens alike. With less savings comes less spending, and thus, lower prices. This process is a long one, so the thing to keep in mind is the duration it takes to bring down inflation.
Above is a graphic made to explain the eb and flow of the Short-Term Debt Cycle, the primary force that drives the economy through periods of expansion and contraction. If you’d like to learn more about the phases of the Short-Term Debt Cycle, you can check out this recent report from Blockware Intelligence.
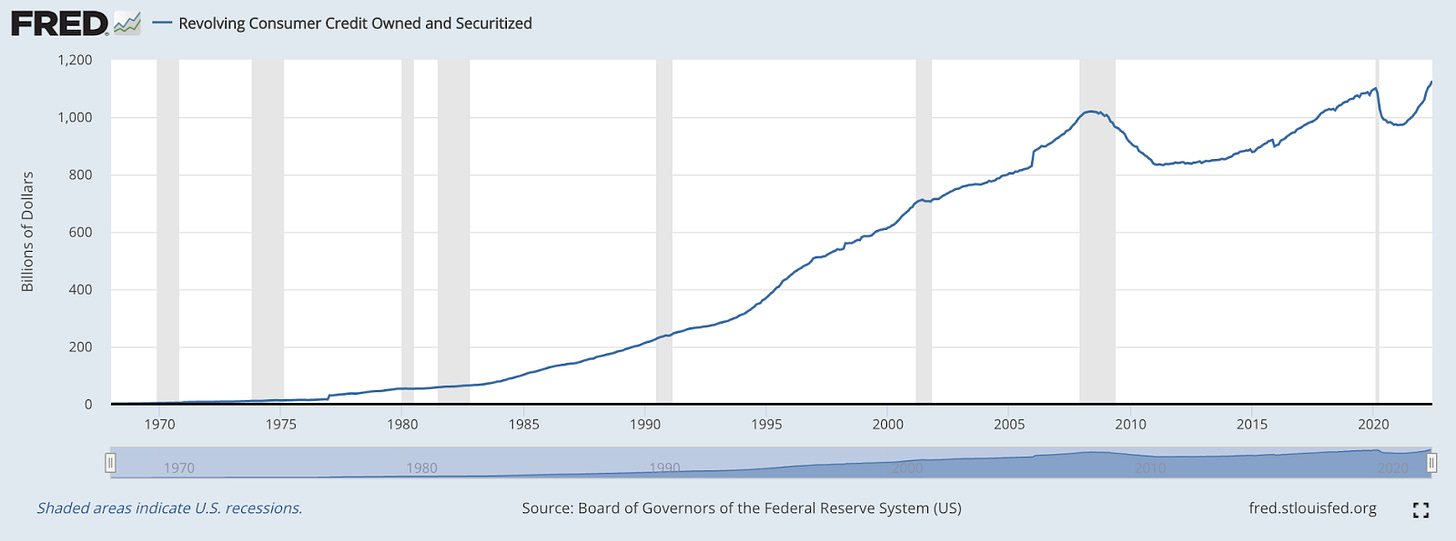
US Revolving Consumer Credit (FRED)
Above is a plot of consumer revolving credit (mostly credit card debt), which is the most common form of debt in the country. As of June 2022, there is more debt held by Americans than ever before.
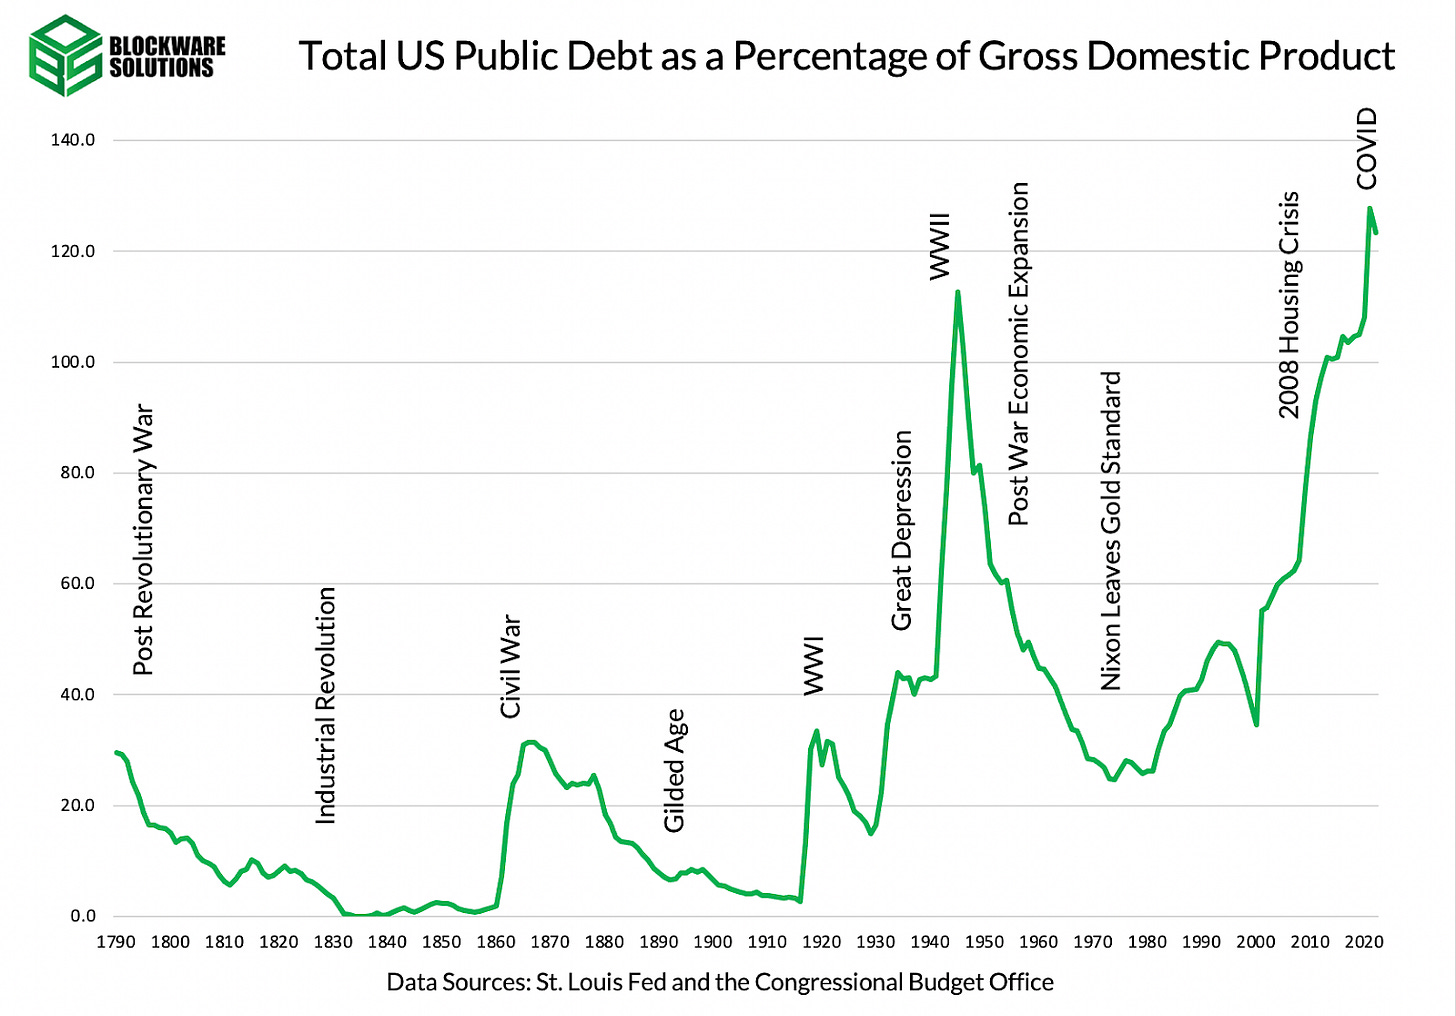
Another way to visualize this is by looking at the Debt-to-GDP ratio, or the ratio of how much debt there is in comparison to economic output.
The economy is no-doubt highly indebted, so raising interest rates extremely high would certainly bring down historically high inflation and debt levels. But, you also run the risk that insolvency could grip the economy as Americans are no longer able to repay their debt.
Clearly, the US hasn’t entered into a deep recession yet, as debt levels are still rising, as they do during an economic expansion. At this point, Americans appear to be taking on more debt in order to pay for rising good prices.
With interest rates still on the rise, folks can afford higher interest payments, for at least a short period of time. This is why the effect of tightening monetary policy has a delay to its effect on the price of goods.
Once Americans come to realize that they’re no longer able to live the same lifestyle they did previously, with interest rates where they’re at, changes in spending behavior bring about lower inflation.
Macroeconomics aside, the stock market has had a strong last couple months. It’s important to note the behavioral factors that are in play with the release of the Fed minutes this week.
The stance portrayed by the Fed in this meeting was not a bullish one for equities. Higher interest rates result in higher bond yields. Because bond yields are used as a discount rate in stock valuation formulas, higher interest rates result in lower equity prices.
But the fact that we saw the Fed reaffirming their stance for higher rates and equities didn’t immediately seriously sell off on the news could be an indication that this information is already priced into the market.
Financial markets are forward looking pricing tools, meaning that prices look ahead to try to predict economic conditions in the future (roughly 6-9 months). The prices of financial products are a leading indicator of the economic environment, while data points like CPI are backward looking.
So understanding what the stock, bond, and commodity markets are doing is how we can make predictions about future economic conditions. As we’ve just mentioned, the stock market has had a very strong last few weeks, and is a signal that investors are confident in the ability of the Fed to bring down inflation in the future.
S&P 500 Index 1D (Tradingview)
But on Tuesday, the S&P ran into selling right around its declining 200-day SMA. This is an extremely widely used indicator and has historically been a place where bear market rallies are choked off.
The 2000-02 bear market took a very similar shape in that the 200-day was a strong area of resistance.
S&P 500 Index Today vs. 2001 (Marketsmith)
The chart above shows the S&P today on the right, and in 2001/02 on the left. In late 2001, there was a significant rally (24.6%) that was eventually stopped by sellers at the 200-day (black MA).
Today, the S&P rallied 18.93% from its low of $3,636.87 on June 17th, to a current peak of $4,325.28 from August 16th.
Historical price action does not dictate what is going to happen in the future. The economic conditions of the Dot Com Bubble era were certainly much different than 2022, but seeing how prices have reacted to key indicators in the past can give us an idea of what we MIGHT see.
We’re also seeing breadth begin to roll over a bit, indicating that under the hood, stocks are beginning to run into a bit of selling. At this point, this decrease in breadth isn’t widespread enough to be a major concern, but it’s certainly something to keep an eye on.
Nasdaq Advance-Decline Line (Marketsmith)
Above is a daily plot of the Nasdaq and its Advance-Decline (A/D) Line in blue. This line measures the total number of stocks in the Nasdaq Composite that are increasing in price. When the A/D line is slopped negatively, it indicates that market breadth is narrowing.
This week we’ve also seen some serious strength coming from the US Dollar.
DXY 1D (Tradingview)
The US dollar is the primary unit of account for global trade, therefore when its value is rising, it makes US exports more expensive, existing American debts more valuable, commodities more expensive in non-dollar countries, and the US government budget deficit increases in value.
DXY measures the value of the US dollar by comparing it to an index of other foreign currencies. When DXY is rising, USD is becoming comparatively more valuable than other fiat monies.
Equities price in the above information through lower prices, as investors recognize the adverse effects of the rising USD index. This week, as DXY has climbed higher, equities haven’t been too majorly impacted.
If the dollar continues this strength into next week, it's likely only a matter of time before stocks run into sellers who understand currency and economic relations.
As the dollar rises in value, it takes less dollars to buy a fixed amount of “stuff”. As a result, gold prices and DXY generally have a negative correlation.
CFDs on Gold 1D (Tradingview)
This week we’re seeing gold prices rollover. The decreased demand for gold is another indication that investors are confident in the Fed’s ability to steer us away from a major recession.
Gold has historically been viewed as a safe-haven asset, and as one of the only ways to self-custody wealth (alongside Bitcoin), therefore it has historically outperformed in periods of recession. So when we’re seeing economic uncertainty shrouded by lower gold prices, it can be deduced that investors are feeling more confident about financial conditions.
Crypto-Exposed Equities
For the most part, it hasn’t been a strong week for crypto-related equities.
With Bitcoin breaking below its 21-day EMA, and even lower on Friday, the price weakness has spilled over into crypto stocks as well. But there are several names who have stood out from their ability to hold key levels.
Generally speaking, the strongest names at the moment are those that were able to hold their 10-day EMAs before Friday. Some examples of names that looked relatively better are: IREN, HIVE, MOGO, and BTCS.
Now, as spot BTC price breaks lower, names that are above their 21-day EMAs on Friday look the best.
Above, as always, is the table comparing the Monday-Thursday price action of several crypto-exposed equities to that of spot Bitcoin and Valkyrie's BTC Mining ETF, WGMI.
Bitcoin Technical Analysis
BTCUSD 1D (Tradingview)
This week we’ve seen some serious weakness in spot BTC price action. On Wednesday, we saw BTC close its daily candle below the 21-day EMA for the first time since July 26th. Then on Friday, we’re seeing BTC break some major levels.
Four of the five red days this week have come on volume greater than the previous day, albeit still less than its 50-day average volume, excluding Friday. There are several key spots that could see BTC find some buyers, the next being $20,700.
The main thing that’s worth noting today is the lower trendline that BTC broke below. In the chart above you can see it as a black upward sloping line across the bottom.
On a weekly time frame, there’s a very strong argument that the last couple months have been building out a bear flag. This break below the lower trendline could validate that theory, if BTC is going to take out the lows.
$21,700 was also an interesting level as it aligns a resistance level with the Volume Weighted Average Price (VWAP) anchored from the 2019 high.
We discussed AVWAP in last week’s newsletter in a discussion of QQQ’s price action. Feel free to go back and reread that explainer if you’re unfamiliar with AVWAP.
The fact that BTC cleared right through this area without much hesitancy tells us that buyers are extremely weak here. A significant AVWAP like that is bound to attract traders and algos, but this liquidity was clearly swallowed up by the intense sell pressure.
We also have AVWAP from the 2022 YTD lows sitting at $20,776.46. This means that the average market participant who made a buy since making low has their cost average right above $20,700 (the support level mentioned above).
This is a likely area that bulls will try to defend, hoping to make purchases at an “average price”. This would be another loud signal of weakness if sellers are able to push prices underneath that.
Above we’ve highlighted several levels that could provide support for BTC. It is also key to note the Livermore level of $20,000 is likely to attract buyers as well.
While we don’t know if BTC will reach that low, or break right through it, learning to identify key price levels can provide investors with an edge.
Bitcoin On-chain and Derivatives
We will start by observing a few of the valuation metrics that have historically marked Bitcoin price bottoms.
Beginning with the “Puell Multiple.”
Created by David Puell of Ark Invest, this metric is calculated by dividing the daily issuance value of bitcoin (in USD terms) by the 365-day moving average of the daily issuance value. Simply put, it is a measurement of how well bitcoin is performing now relative to the past year.
This metric has just exited the green ‘undervalued’ zone
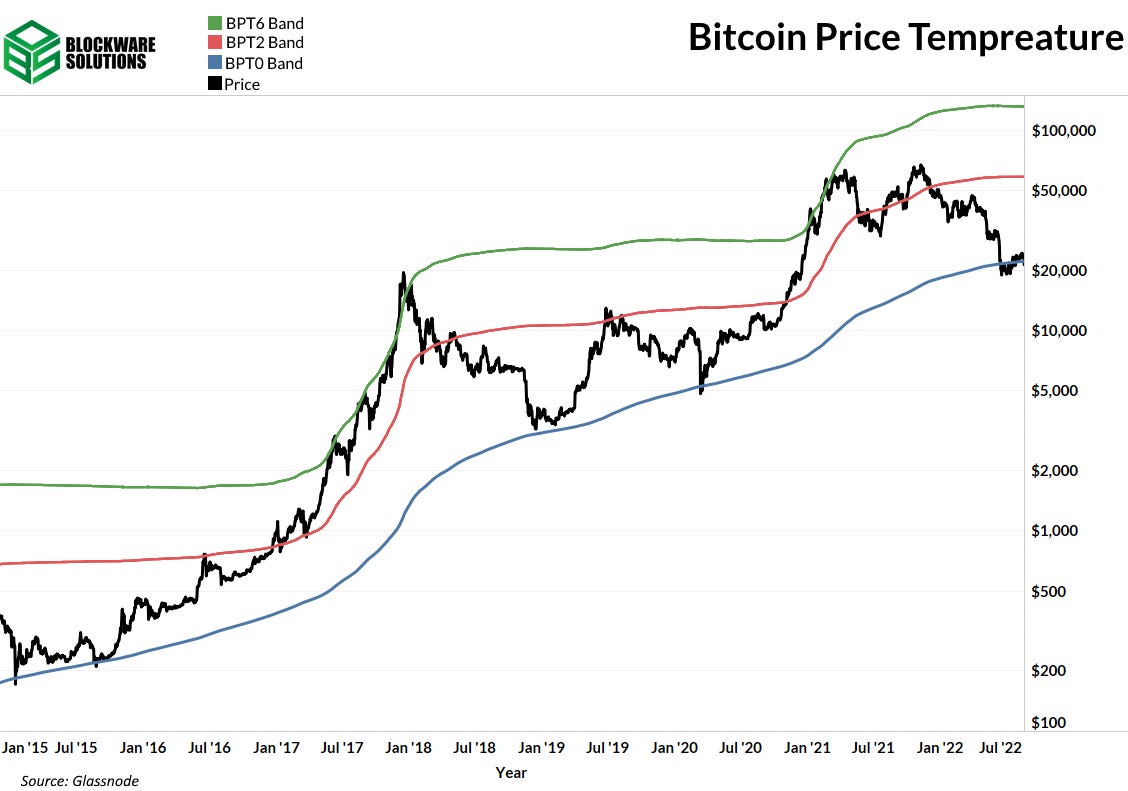
Next, Bitcoin Price Temperature (BPT) uses the 4-year moving average (blue line) as a focal point, and then measures how many standard deviations the Bitcoin price is away from that.
The 4-year halving schedule helps drive the cyclical nature of Bitcoin and has led to the 4-year moving average serving as the ultimate price floor. Bitcoin has just crossed back above the 4-year moving average.
Aforementioned in the macro section of this newsletter: we released a Blockware Intelligence report which goes into detail on Bitcoin’s cyclical nature. You can check that out here.
MVRV Z-Score gauges the relationship between the market cap and the realized cap (aggregate price that all coins last moved on-chain.)
MVRV Z-Score is calculated as: (market cap - realized cap) / std(market cap).
Just as with the Puell Multiple, Bitcoin has exited the undervalued zone here.
You can also observe this relationship by simply looking at Bitcoin and its realized price.
Realized price can be further conceptualized by looking at the cross-over of the Short-Term Holder Cost Basis and Long-Term Holder Cost Basis. This has historically been another good indicator of Bitcoin bottoms.
The cross-over has yet to happen but it is not far away. STH Cost Basis sits at ~$26.9k while the LTH Cost Basis is at ~$22.7k; a difference of just $4.2k.
The fact that this cross-over hasn’t happened yet is a sign that Bitcoin may continue to crab in this $22k to $27k range for a little while longer.
Further examining holding behaviors reveals that the supply of Bitcoin held by Short-Term Holders (less than 155 days) has been increasing steadily throughout the bear market.
Historically, this metric has gone down alongside price as newer participants are scared away.
However, this time around, supply held by STH bottomed at the same time the price peaked during Q4 of last year; which shows that new participants are not being scared away by negative price action this cycle.
That idea is further supported by the rapid growth in the number of accumulation addresses throughout the bear.
All Bitcoin bull runs historically begin with the following four stages:
✅ 1. Dark bear market ~ coins are stationary
✅ 2. Capitulation ~ price 📉 and coins move
✅ 3. Price slowly drifts up while coins don't move
🔲 4. Increasing price reflexively drives adoption
HODL waves, a metric used to visualize what percentage of coins have moved in the past x days/weeks/years, provide valuable information as to how users (bitcoin holders) are behaving over time.
By selecting the cohort of users that have moved their coins in the previous month (chart above), you can visualize points in time when a large majority of users are holding and alternatively when a significant percentage of users are moving coins.
Going back to the four steps, the later half of dark bear markets (good times to start buying bitcoin and bitcoin mining rigs) occur while most users are sitting tight on their coins (stage 1). The excitement from the previous bull run is now over, and the stronger users remain. The dark bear markets tend to end in some form of capitulation (stage 2).
This capitulation is from both Bitcoin users and Bitcoin miners, and it’s usually the best time to deploy capital. However, capitulations are short-lived and difficult to time. Capitulations can be marked by hash ribbons and spikes in coin moments during significant price drops. This is the final purge of the only weak hands remaining in Bitcoin, and it is what cleanses the system with only the strongest holders and miners remaining.
Interestingly, we have now seen capitulation from both perspectives. Following the June capitulation, Bitcoin has been experiencing a slow drift up (stage 3) from its $17.6k low.
While there’s no guarantee that the capitulation from both a mining and on-chain perspective is completely over, compared to Bitcoin’s historical bear market capitulations, the current capitulation appears to have potentially already taken place. Even if $17.6k does happen to be the low for Bitcoin, it also doesn’t necessarily mean another parabolic bull run is imminent. After the 2015 capitulation, Bitcoin had over 12 months of sideways consolidation, and after the Dec 2018 capitulation, the price increased back to $12k only to later quickly trade at its $3k low again in March 2020.
A base case would be that now appears to be a great time to allocate further into Bitcoin, but if the macro situation deteriorates further and US equities make new lows, it’s likely that Bitcoin will follow.
Bitcoin Mining
73 days into the Miner Capitulation
As mentioned in previous Blockware Intelligence Newsletters, hash ribbons (chart below) indicate when miner capitulations are occurring. The hash ribbons metric was created by Charles Edwards. Miner capitulations occur when a significant net % of miners turn off machines over an extended period of time.
The current miner capitulation began June 7th, 2022, and it has officially lasted the same amount of time as the 2018 miner capitulation.
As referenced before, the 2018 miner capitulation marked the rough bottom after the 2017 bull run. Bitcoin didn’t necessarily skyrocket directly after, but Bitcoin did fail to make new lows after weak miners were purged from the network.
Last, Bitcoin Energy Gravity still appears to be in the buy zone. Bitcoin Energy Gravity models the relationship between the price of Bitcoin and its mean operating cost of production for modern mining rigs. Energy Gravity currently sits at $0.11, meaning that the modern mining rig (~ 38 W/TH) earns 11 cents for every kWh consumed.
Since Energy Gravity’s low this summer (when the mean operating cost of production for modern mining rigs was close to the price of Bitcoin itself), the metric has slowly drifted up. This has been due to declining mining difficulty and Bitmain’s new XPs starting to ship. Both are lowering the mean operating cost of production for modern mining rigs.
All content is for informational purposes only. This Blockware Intelligence Newsletter is of a general nature and does consider or address any individual circumstances and is not investment advice, nor should it be construed in any way as tax, accounting, legal, business, financial or regulatory advice. You should seek independent legal and financial advice, including advice as to tax consequences, before making any investment decision.








Interesting..
Thank You!
It was an interesting article