Blockware Intelligence Newsletter: Week 48
Bitcoin on-chain analysis, mining analysis, macro analysis; overview of 7/22/22-7/29/22
Important Announcement from the team:
We’d first like to begin by thanking every reader of this newsletter. We’re coming up on 1 year of releasing this weekly research piece and it has been incredible to see the growth in subscriber numbers and positive response that the Blockware Intelligence team has received.
Providing the highest quality analysis and data each week does not come without expenses. In order to cover the costs of external data sources as well as to further expand the research team in the future, we will be transitioning to a paid newsletter in mid-August.
Blockware Intelligence Sponsors
If you are interested in sponsoring Blockware Intelligence email: sponsor@blockwaresolutions.com.
Blockware Solutions - Buy and host Bitcoin mining rigs to passively earn BTC by securing the network. Your mining rigs, your keys, your Bitcoin.
Know someone who would benefit from concierge service and world class expertise when buying Bitcoin? Give them one year of free membership in Swan Private Client Services ($3000 value) -- email blockwareHNW@swan.com and we’ll hook it up! (And yes, you can give it to yourself 🤣)
Summary
FOMC announced a 75bps increase to the Fed Funds Rate on Wednesday, leaving the upper limit of the target range at 3 year highs.
Powell’s dovish speech drove a rally in risk assets that the fixed-income market predicted weeks ago.
Q2 GDP growth came in at -0.90%, which places the US in a technical recession.
While it does take significant time for NBER to declare an official recession, there are several indications of a weakening job market that would argue that the US is in, or very close to, a recession.
According to the hash ribbon metric, Bitcoin is 52 days into a miner capitulation. The end of a miner capitulation historically marks a bear market bottom.
Mining difficulty is projected to increase. Bearing no new low in the price of Bitcoin it is possible that difficulty is bottoming.
During Bitcoin price capitulations, the mempool usually sees a spike in fees indicating users need to move a larger amount of coins fast. We’ve had a capitulation similar to 2018.
General Market Update
It's been a crazy week with big tech earnings, the Fed Open Market Committee meeting, and the announcement of advanced GDP estimates from the Bureau of Economic Analysis.
Let’s start with the most encompassing topic, the 75bps Fed Funds Rate hike that the FOMC announced on Wednesday.
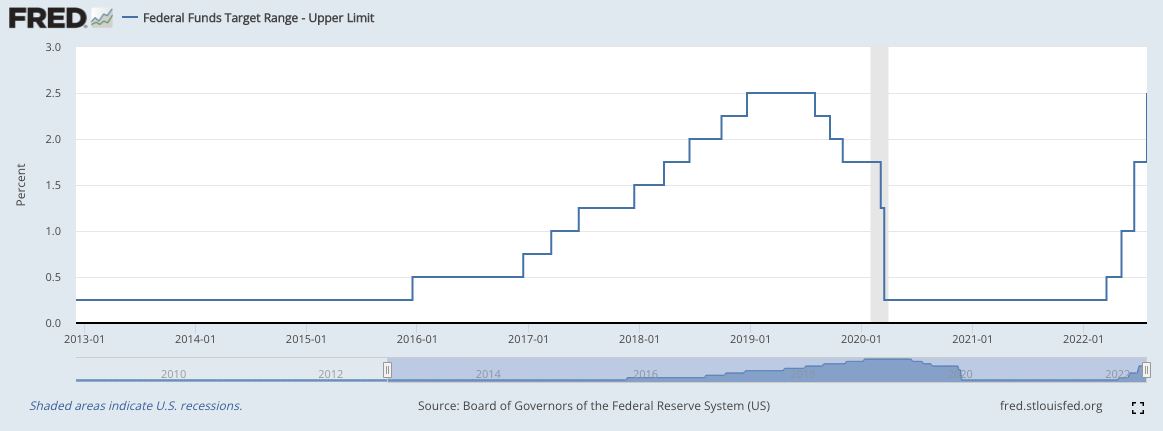
Upper Limit Target Fed Funds Rate (FRED)
This rate increase was the one predicted by CME Group’s FedWatch tool, as discussed here last week. This 75bps increase puts the upper limit of the target rate range at 2.50%, the same level as 2019. When the Fed increases rates again next meeting, this will create the first higher-high for the FFR since 2000.
Because a 2.25-2.50% target rate was already priced into the market (as seen by Fed futures data from CME Group), it’s no surprise to see the rally the markets went on Wednesday and Thursday.
The current goal of the Fed is to slow inflation. The literal first line of Powell’s speech yesterday was “My colleagues and I are strongly committed to bringing inflation back down.” Certainly a 100bps hike would have been an even more aggressive move for them to achieve this goal, but the Fed is also concerned with avoiding a hard landing.
Powell spoke with a dovish tone yesterday, reaffirming investors that the committee will be taking a more forward-looking approach to their policy in future meetings by not issuing forward guidance. This press conference from Chairman Powell felt like the first of its kind for 2022.
He spoke of the increased probability of conducting a soft landing, and alluded to the fact that they see a decline in the magnitude of rate hikes in the near future. Powell assured investors of their ability to slow inflation by confirming that they are seeing indications of significant reductions in consumer spending.
I won’t recap every word Powell said, but if you’d like, you can listen to his whole 54 minute press conference here.
So that all being said, has recent monetary policy actually been enough to reduce demand and bring down inflation? It’s hard to say, but the confident dovish tone of Powell certainly appeared to be enough to return some risk on sentiment to the markets.
The target FFR has now been increased by 200bps in just 3 months, but these things take time to affect markets and consumer spending. When FOMC meets back-to-back months, it can be hard to see the effects that policy has had. We now have 8 weeks until the Fed meets again on September 21st, which will provide us with an opportunity to see the longer term impacts of their policy.
As mentioned, the optimistic tone of Chairman Powell has renewed some confidence in investors and harbored the flow of capital into risk markets. On Wednesday, the Nasdaq Composite was up over 4%, its largest single-day increase since 2020. Treasury prices also jumped on this news but were up even more significantly on Thursday.
Treasury bonds are generally considered to be the complete opposite of risky, but in an inflationary environment, they are bunched together with risk assets. When inflation is high, the future cash flows received from buying and holding a fixed-income security are devalued, making that instrument less attractive.
This adds inflation risk into the equation for bond pricing and causes the opportunity cost of storing wealth in Treasuries to rise. But as of recently, we haven’t seen the sell off in bonds that we might expect. In fact, we’ve seen the opposite.
US10Y Yield 1D (Tradingview)
This week, as you can see above, the yield of the 10Y Treasury Note undercut 2.7% for the first time since April. This decrease in a common risk-free rate expands equity valuations and adds fuel to the growth confidence fire.
The strong bid we’ve seen in the fixed-income market doesn’t mean that the smart-money believes inflation has peaked, more so it enhances the idea that investors are confident in the Fed’s ability to bring down inflation.
Bonds are forward-looking investment tools, pricing in investors’ expectations and then adjusting prices as new information comes in. So prolonged bidding doesn’t necessarily mean that the wide scale belief is that the economy is out of the woods, but it could mean that investors think we’re moving in the right direction.
The fact that bonds have been rallying for essentially a month straight while equities have chopped around indicated that the bond market was expecting growth to remain strong and the Fed to not get overly aggressive. Essentially, they're calling the Fed’s bluff in that they won’t raise rates to an extreme and send the economy into a deep recession.
But, as we discussed here last week, the more that the markets rebound here, the higher likelihood there is of the Fed needing to push harder in order to stabilize prices.
A heightened bid for risk assets simply undermines the goal that the Fed has set out to accomplish. In an environment with less inflation maybe we could get away with this, but with CPI inflation above 9%, it’s more possible that a rally in growth investment vehicles would simply push the Fed to increase their aggressiveness.
While yields have been falling for over a month now, it’s important to note the magnitude of the change for different maturity securities. As we discussed in this newsletter on July 8th, the spread between 2 and 10 Year Treasuries is still negative.
Although, in aggregate, Treasuries have been rallying, the extent to which different securities have jumped tells us a lot about investor confidence.
A negative 2/10Y spread means that the yield of the 2Y Treasury is higher than the 10Y, and is a signal of heightened concern for short-term economic conditions. Normally, longer maturity bonds have higher yields, as more interest payments means that interest rate changes would affect their coupon payments more significantly (higher duration).
In periods where investors are concerned about near-term economic conditions, we’ll see relatively greater demand for longer maturity bonds, as we’re seeing today.
2/10Y Treasury Spread (FRED)
Last Friday, this spread hit -0.20, its lowest value since November 28th, 2000. As you have likely heard, a negative 2/10Y spread usually comes just before periods of recession.
While a recession hasn’t occurred 100% of the time the spread flipped negative, we ALMOST always see a recession within 2 years of a negative 2/10 spread. Speaking of recession, there was tons of discussion about it, and the criteria for classifying one, this week.
A lot of this stemmed from President Biden’s discussion of the economy, but also on Thursday, the Bureau of Economic Analysis’ advanced estimate of 2nd quarter GDP growth came in at -0.9% YoY.
Quarterly Real US GDP Growth (Statista)
Two consecutive quarters of negative GDP growth officially puts the US in a technical recession, as we discussed in this newsletter on July 1st.
While we do require the National Bureau of Economic Research (NBER) to declare an official recession, we can think about a technical recession as a proxy for the official declaration. Two quarters of declining GDP pretty much always aligns with NBER’s declaration, but they likely won’t make an announcement on this period for a long time.
In 2020, it took about 4 months for the recession to be declared official, but historically, NBER has taken well over a year. They wait until they can clearly see a peak of economic activity who’s decline is of significant depth, diffusion and duration.
The chart above shows quarterly real US GDP growth rates going back to 1947. This shows us that there have been 10 instances of consecutive quarters of declining GDP growth, excluding 2022 and not double-counting periods that had multi-year recessions. Of these 10 occasions, 9 of them were classified as recessions by NBER.
In 1947, there was a decline in real GDP for 2 consecutive quarters but this was not classified as a recession. At that time, strength in the job market, industrial production and consumer spending were enough to overrule the negative GDP growth. Furthermore, in 2001, the US saw a recession that did not have 2 quarters of negative real GDP growth.
This amplifies the point that although 2 consecutive quarters of negative GDP growth is a very accurate indicator of recession, there have been outliers in the past.
But in all honesty, the definition of recession is arbitrary and only matters to journalists and politicians. What matters is how the current economic environment is affecting people. With real wages extremely low, and consumer confidence in the gutter, whether or not we can officially say we’re in a recession is irrelevant.
Furthermore, when NBER announces that the US has entered a recession, they are looking into the past. They’ll say that the recession began 4 months ago, 1 year ago, etc. So while claiming that we are in a recession before NBER is technically speculative, 2 quarters of declining GDP is a pretty good standard.
To take things a bit further, we can look at the job market that many claim is so strong.
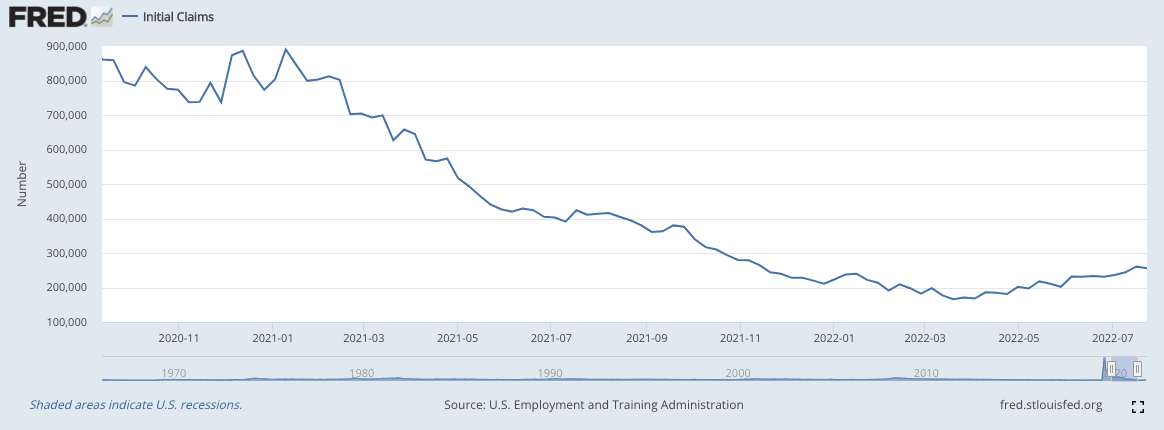
US Initial Jobless Claims (FRED)
The first thing that people look at when making encompassing claims about the job market is the unemployment rate. The chart above shows Initial Jobless Claims (IJC), which is not the same thing as the unemployment rate, but their relationship is very closely tied.
IJC tells us that unemployment remains historically low, but is beginning to creep higher. But this doesn’t take into account a variety of other factors that are actively hurting everyday Americans.
Labor Force Participation Rate (FRED)
The Labor Force Participation Rate tells us what percentage of individuals that are 16 years old or older and eligible for employment are actively working or seeking employment. As you can see, as economic pressures have squeezed American citizens for the last several months, we’ve begun to see a decline in people working or actively seeking work.
Because the decline in LFP is steeper than IJC, this tells us that although unemployment isn’t extremely high, we’re beginning to see people give up on finding employment.
Furthermore, those who are employed are seeing a destruction of their wages.
US Median Weekly Real Earnings (FRED)
Over the last 2 years we’ve seen a steady decline in real earnings. Meaning that after accounting for inflation, Americans are earning less than they were pre-pandemic.
So, yes, employment is still relatively high but what does it matter if those who are employed are seeing the purchasing power of their wages destroyed. A reduction in employment and a reduction in real wages essentially has the same effect on the economy, in that there will be less money in the hands of consumers.
But speaking of consumer spending, it has been increasing steadily for the last 8 quarters, so how is that possible with the reduction in real wages? Higher spending is a good thing if you want to see economic growth because it usually shows that Americans are feeling confident and don’t feel the need to save for a rainy day.
But that’s only if Americans are also growing richer, in aggregate.
US Personal Saving Rate (FRED)
Instead what we’re seeing is that Americans are spending more but because real earnings are so low, we’re just seeing people’s savings accounts drained. Above is a chart of the US Personal Savings Rate, which tells us what percent of disposable income is being saved.
Currently, Americans are only saving less than 6% of their income, meaning that the increase in consumer spending likely isn’t stemming from high consumer confidence. What’s more logical is that Americans are simply spending more because monetary and supply-side inflation has caused higher prices for goods that Americans need.
In fact, we saw a quarterly decline in American household wealth in Q1 2022 for the first time since the beginning of the pandemic. Q2 data likely won’t be published until September, but we could speculate that we see another decline.
To summarize, these charts tell us that the job market is relatively strong but certainly softening because:
Unemployment remains relatively low but people are beginning to be laid off or electing to not work
For those Americans who are working, they are not earning enough to counteract the reduction in purchasing power
The combination of increased consumer spending and declining real wages is reducing savings and making Americans poorer
Changes in market conditions take time to spill over into the job market. This is why NBER’s recession announcements are so delayed and why looking into employment beyond face-value tells us a lot about the economic environment.
Crypto-Exposed Equities
Overall it's been a pretty strong week for the crypto-related industry group.
The market is clearly rewarding the most quality names and there are clear signals of relative strength among the leaders. While public miners all essentially have the same objective, to mine BTC for the lowest possible cost, these companies are not all created equal.
They differ in things like management, strategy, energy costs, geographic location (political risk), debt levels, etc. These things can be a little complicated to research on your own but luckily you don’t have to.
The market will tell us which names are the most attractive to investors through price action. The names showing the highest levels of RS are those that institutional investors are accumulating the most aggressively. One key thing to look for in this group are names that are back up near last week’s highs. This quick and aggressive rebound shows that institutions are actively accumulating those names.
A few examples of names (including non-miners) showing RS this week are: MSTR, RIOT, HUT, MARA, BITF, SI, and HIVE.
Examples of names that are showing significantly less RS are: EBON, BTBT, GREE, CLSK, and COIN.
COIN 1D (Tradingview)
As you can see above, COIN has had a relatively tough week and has struggled to retake the 10-day EMA after its -21% day on Tuesday.
The relative weakness stems from news this week of an SEC investigation into them for allegedly selling alt-coins that should’ve been registered as securities. This comes just days after the SEC charged a former Coinbase manager for insider trading.
The definition of a security is tricky to nail down because it is such a broadly encompassing term. By comparing traditional securities to alt-coins, it’s pretty hard to argue that certain centralized projects aren’t securities.
In many cases, you’re basically buying tokens in order to finance a project and then hopefully profiting from their appreciation in accordance with the success of the project. In this instance, many alts are quite similar to buying shares of a stock, or even buying debt.
The Securities Act of 1933 requires that all securities be registered with the SEC in order to regulate the financial markets and protect investors. So does this mean that the SEC is going to find something illegal against COIN? Not necessarily, but it is certainly something important to keep in mind.
As of today, no cryptocurrencies have been registered with the SEC, and are largely referred to as commodities. An SEC claim that COIN sold unregistered securities could result in centralized projects having to be registered.
Above, as always, is the table comparing the weekly performance of several crypto-native equities, Bitcoin and WGMI.
Bitcoin On-Chain and Derivatives
Markets have rallied after the Fed has announced they’ve raised rates another 75BPS, with Bitcoin leading the charge up 15% from its lows this week. An important weekly level for BTC to reclaim is its 200-week moving average, currently sitting at $22,800. So far so good, but need to wait for it to close on Sunday night 8:00 EST for confirmation.
Monthly also appears to be reclaiming its 180-week EHMA, a level we’ve talked about over the last few months as a macro accumulation area for BTC. This closes Sunday night EST as well. If it does reclaim, would be quite bullish as failed breakdowns/breakouts are a strong signal.
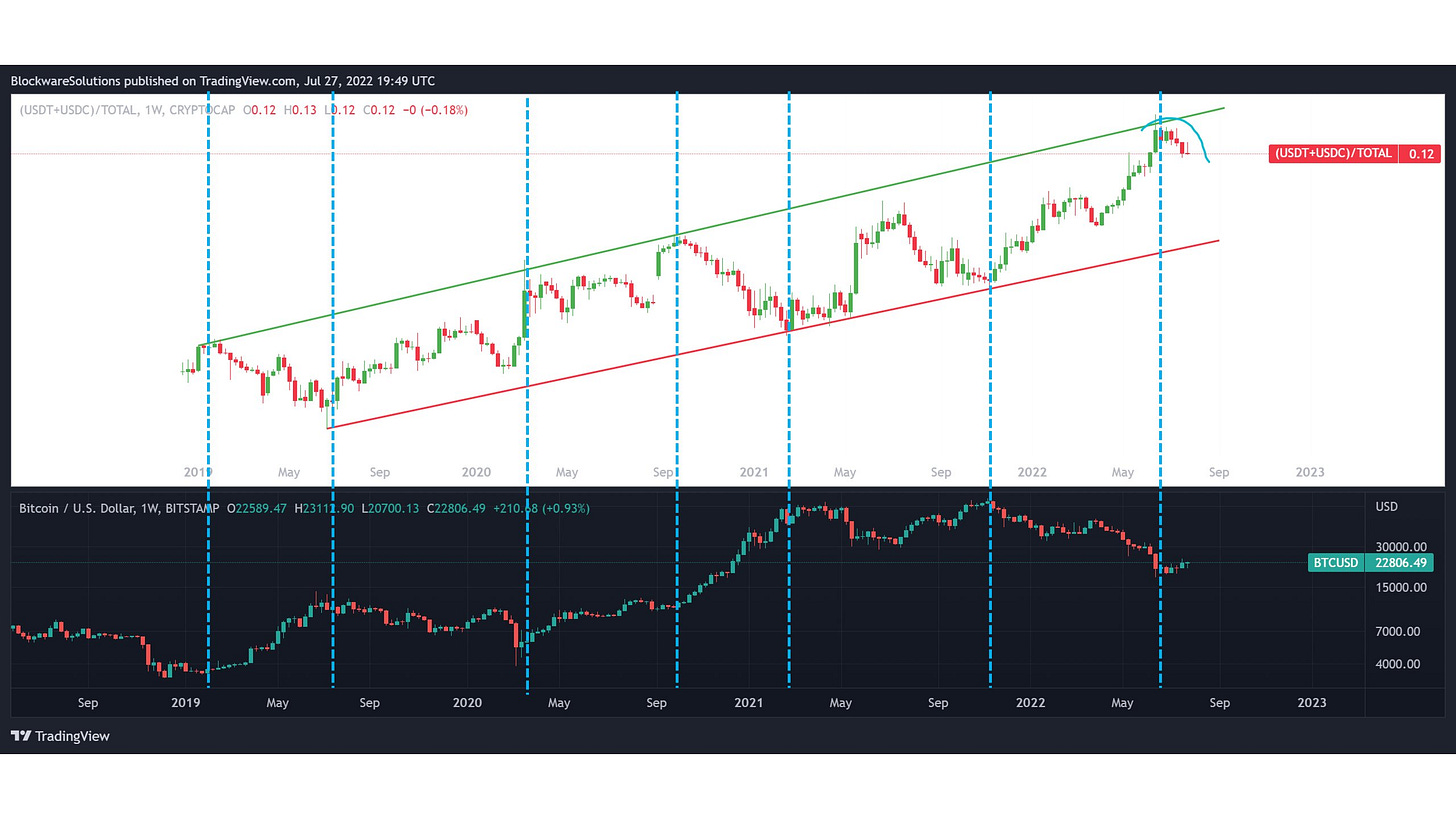
Another indicator we’ve been watching is the market capitalization of USDC and USDT (leading stablecoins) relative to the aggregated crypto market cap. Whenever this ratio reaches the bottom of its channel, it indicates that there is a small amount of dry powder relative to what has already been deployed, increasing the likelihood of a macro top as there are minimal new buyers. Conversely, whenever the ratio reaches the top of the channel, it indicates that there is a large amount of dry powder on the sideline relative to crypto’s aggregated market cap. As the market rallies, there is a stronger likelihood of market participants becoming induced to chase. The more dry powder the more dry kindle there is for a spark to light on fire. After posting this last month when the ratio reached the top of the channel, it has begun to roll over.
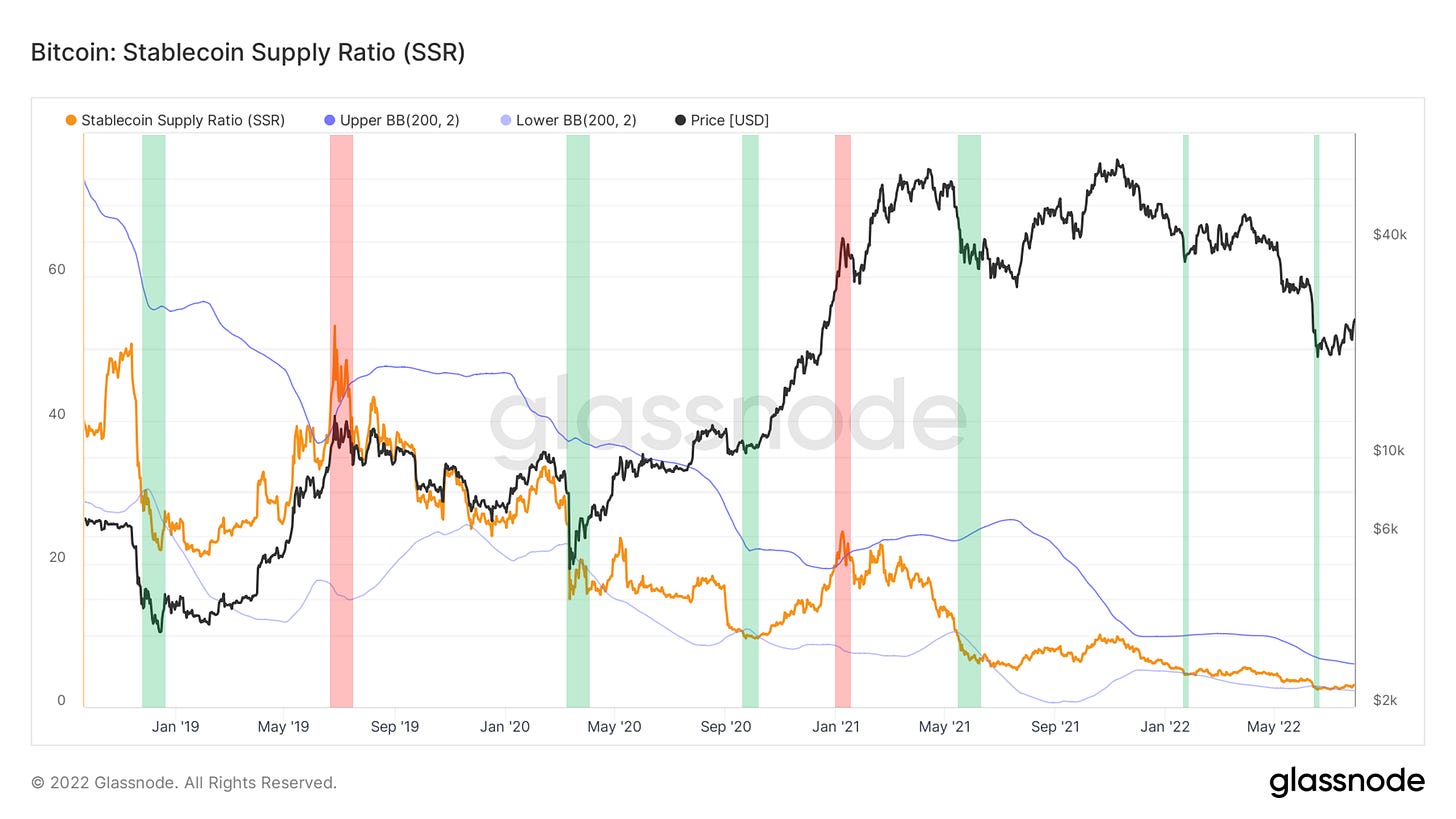
Another look at this is comparing stablecoin’s market cap to solely BTC’s market cap and then adding bollinger bands. I personally like the former chart better, but this is something to look at for confluence.
MVRV z-score was another indication we’ve been watching for since late last year as an area of interest for long-term (deep-value) spot buys. After spending about a month below, the ratio has begun to peek out of its accumulation zone.
Another update on a metric we’ve been watching; Bitcoin relative to its 200-day trend. Last month BTC reached one of the furthest deviations from that trend in its history.
It has now reverted back, no longer at that level of extreme deviation that has market historical bottoms. This can be shown by the highlighted green areas.
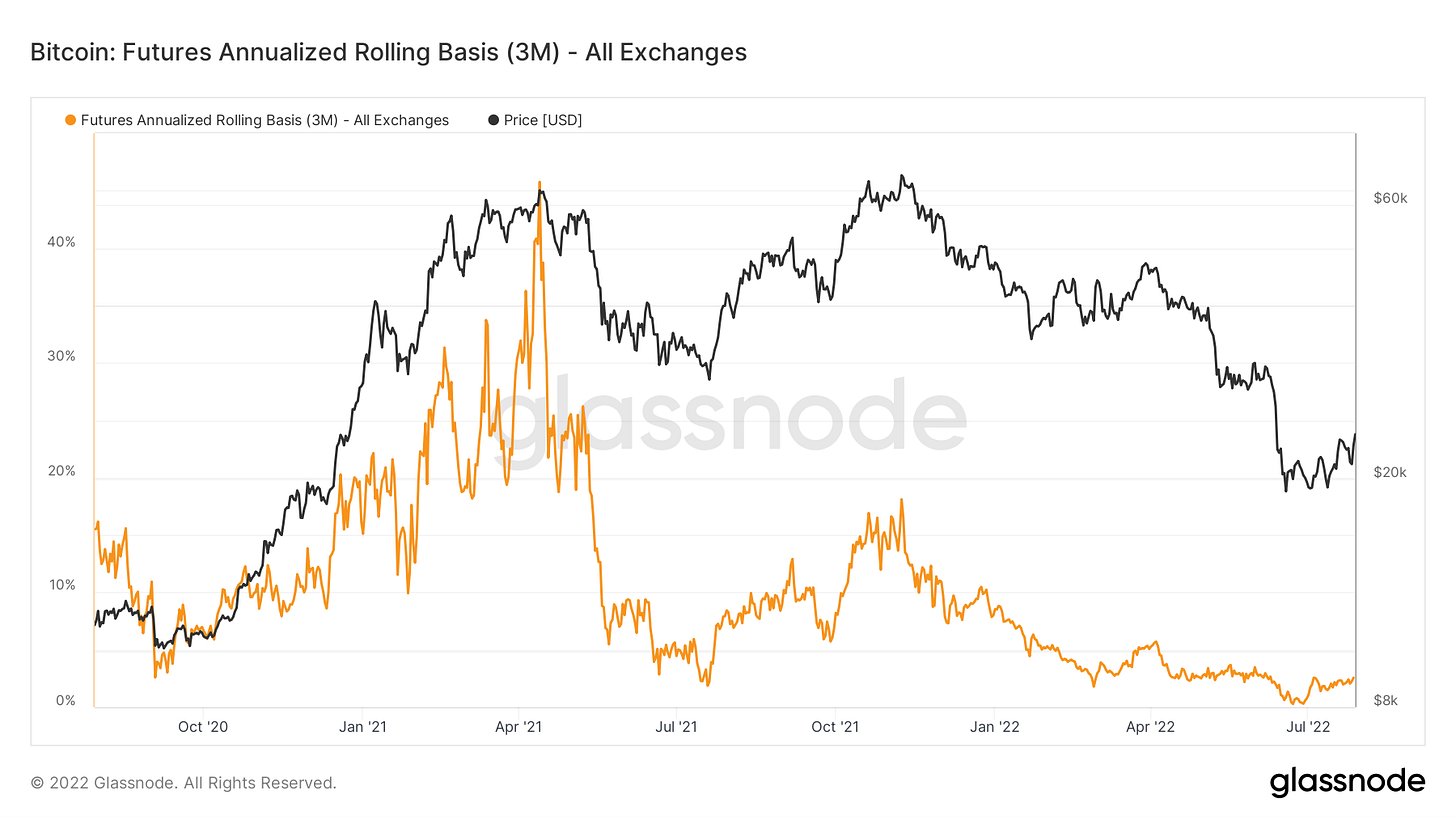
On the derivatives side, Bitcoin’s 3-month basis has recovered slightly from 0.27% and even backwardation on some exchanges last month, to 2.57%. This means you can long spot, short futures, and capture the difference.
In terms of items we still want to watch out for on the Bitcoin-native side, short term holder cost basis is an important threshold to keep in mind that we’ve discussed for a year plus. This is the aggregated cost basis of short-term holders (<155 days). Currently sitting at $28K, is confluence with technical resistance as an area of confirmation for momentum-based market participants.
One other item I would like to see is a further negative regime of funding rates. Funding is relatively muted so nothing of major concern, but what we really want to see for high conviction reversal is funding going further negative as BTC grinds upwards.
Lastly, just want to touch on a chart I’ve seen circulating on Twitter lately; leverage ratio. This compares Bitcoin’s open interest to the number of BTC on exchanges as a proxy for leverage in the system. In theory, this makes sense. However, the issue I have with this metric is that the percentage of futures contracts collateralized with BTC has been perpetually dropping since May 2021; down from 70% to 40%. With that in mind, I don’t find this entirely useful.
Bitcoin Mining
52 days into the Miner Capitulation
As mentioned in previous Blockware Intelligence Newsletters, hash ribbons (chart below) indicate whether miner capitulations are occurring. This metric was created by Charles Edwards. Miner capitulations are when a significant net % of miners turn off machines over an extended period of time.
The current miner capitulation began June 7th, 2022, and it has lasted a significant amount of time. It’s important to note that miner capitulations are particularly relevant because it reveals that a large number of machines are no longer hashing. Since June 7th, other new generation mining rigs have likely been plugged in by both public and private mining companies. However, enough old generation machines or inefficient overleveraged miners have shut off, that hash rate and difficulty have actually decreased in size.
If there are no new lows in Bitcoin, we should expect the miner capitulation to end in August or September at the latest.
Projected Difficulty Increase
Since the previous downward difficulty adjustment (-5.0%), blocks have been coming in faster than 10 minutes. While there’s a significant amount of shear luck when it comes to finding a single individual block, once a large number of blocks have been mined during a specific difficulty epoch (difficulty adjusts roughly every 2 weeks ~ 2016 blocks) you can get a sense about what the upcoming adjustment may be.
Difficulty Estimator: https://www.bitrawr.com/difficulty-estimator
For reference, the whole purpose of the difficulty adjustment it to keep Bitcoin’s supply distribution schedule in tact. If blocks fly in too fast, meaning more miners have joined the network, difficulty increases making it more difficult to find an individual block. The above chart uses data from how fast blocks are coming in to predict what the difficulty adjustment might be.
Since the network is over halfway through this difficulty epoch (we have over 1,000 blocks of data), there is some reliability as to how accurate this upcoming adjustment may be. Currently it’s projected to be positive, and there is a high probability that it persists.
Bitcoin Mempool Capitulation?
Bitcoin’s mempool is where all unconfirmed transactions sit waiting to be mined by miners. During large price swings down or during adoption frenzies, the mempool usually gets filled with transactions as the network is flooded with users responding the changes in price.
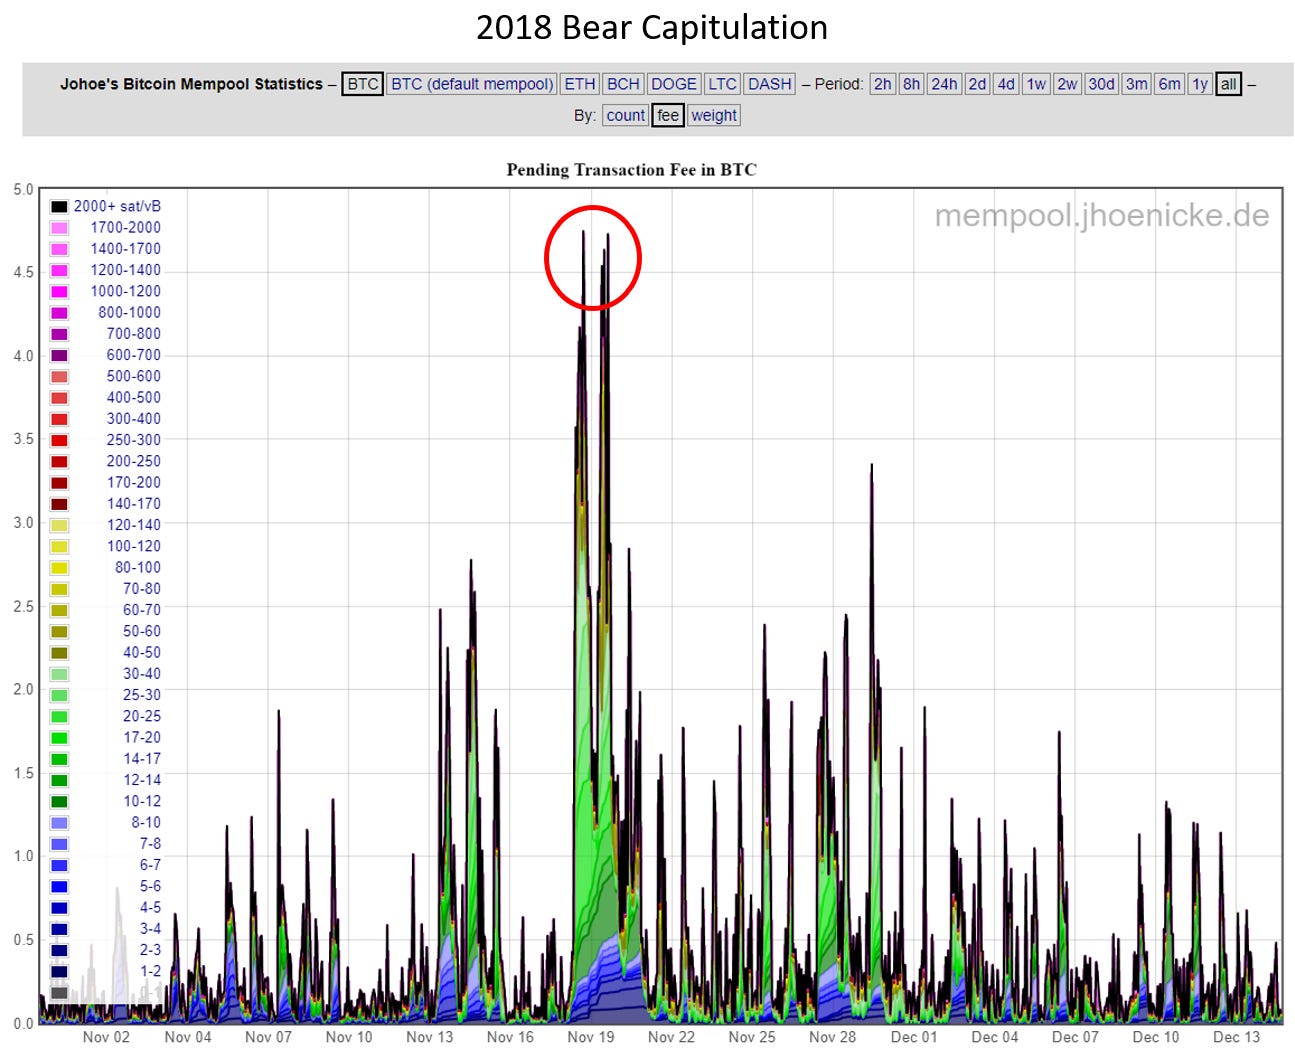
Below is what the mempool looked like during the 2018 bear capitulation. During November, the price of Bitcoin started falling from $6,000 all the way to $3,000. On the chart below, you can see a significant spike in pending transaction fess which indicates there was a significant amount of network activity during that price drop. If the price is really effecting users, coins will start moving and this gets reflected in the mempool as users compete to get their transaction in the next block.
During the 2018 bear capitulation, pending fees in the mempool reached nearly 5 BTC. Transactions were clogged up and there were a few periods where the mempool did not clear for more than 24 hours.
During the 2022 (potential) bear capitulation, the network has seen arguably two separate separate mempool capitulation events. The first was in the middle of June when Bitcoin fell from $31,000 to $17,500. And the second was when Bitcoin retouched $19,000 in July.
By no means does this guarantee that Bitcoin has bottomed out, but it does validate that there have been periods where the price is dropping and users are paying up a bit more than usual to move coins quickly.
All content is for informational purposes only. This Blockware Intelligence Newsletter is of a general nature and does consider or address any individual circumstances and is not investment advice, nor should it be construed in any way as tax, accounting, legal, business, financial or regulatory advice. You should seek independent legal and financial advice, including advice as to tax consequences, before making any investment decision.











Always a good read...already distrust this would become a paid subscription. With the Nigerian currency tumbling it is gonna be pretty much hard to pay. Thanks Will