Blockware Intelligence Newsletter: Week 45
Bitcoin on-chain analysis, mining analysis, macro analysis; overview of 7/1/22-7/8/22
Blockware Intelligence Sponsors
If you are interested in sponsoring Blockware Intelligence email: sponsor@blockwaresolutions.com.
Blockware Solutions - Buy and host Bitcoin mining rigs to passively earn BTC by securing the network. Your mining rigs, your keys, your Bitcoin.
Know someone who would benefit from concierge service and world class expertise when buying Bitcoin? Give them one year of free membership in Swan Private Client Services ($3000 value) -- email blockwareHNW@swan.com and we’ll hook it up! (And yes, you can give it to yourself 🤣)
Summary
The equity indexes have seen a strong bounce this week, much of which has stemmed from short-covering as we can see with QQQ’s Aggregate Short-Interest.
While it’s certainly possible that this is the market’s bottom, there are a few areas close overhead that could turn into resistance in the coming sessions.
Fixed-income securities began to sell off again this week and the 2/10Y yield spread flipped negative for the second time in 2022.
The Atlanta Fed has continued to lower their Q2 GDP estimate and it now sits at -1.9%. As discussed last week, unemployment data does not back the thesis that the US is currently in a recession.
Bitcoin is 31 days into a miner capitulation according to the hash ribbon metric. The end of a miner capitulation historically marks a bear market bottom.
Updated: Miner Network Breakeven Distribution Table and Chart
Mining difficulty is trending down, but not at the same pace as the China mining ban which was unprecedented.
General Market Update
This short week we’ve seen a continuation of relatively bearish macro indicators yet pretty strong price action in the equity markets.
As I’ve discussed in this newsletter numerous times, the bond and equity markets are forward-looking pricing tools. Due to this fact, they will bottom before the macro situation sorts itself out.
That being said, it is still much more likely that this bounce is simply a short-covering, counter-trend rally rather than a true bottom in this bear market. When the overall trend is down, the likelihood of that trend breaking is extremely low.
This is why we’ll always see numerous significant rallies during a bear market. Shorts protect their gains by buying shares and long traders are quick to jump back in. Bulls assume the decline is over, but the reality is that it’s simply a short counter-trend rally that usually punishes their lack of patience.
QQQ Short-Interest (NASDAQ Website)
Above you can see the total amount of shares sold short on the NASDAQ ETF QQQ. You can see that on Tuesday July 5th, when the ETF was up 1.71%, there was a pretty strong uptick in short sales.
As the rally continued, short interest declined fairly significantly as shorts were being squeezed into buying shares to cover. This is likely where a solid portion of this rally has stemmed from.
As we’ll examine in a few paragraphs, there are several dynamic and horizontal resistance levels we’ll need to see QQQ surpass to prove that the buyers are truly in control.
It is certainly possible that this is the bottom, but nobody knows. In fact, the worst news generally arrives right around the bottom of a decline and it’s possible that the headlines about the worst first half of a year since 1970 was just that.
But there are a handful of indicators that may lead you to believe otherwise. First, when we take a look at market breadth we’ll see that this rally is being fueled by only a few names, and that the market doesn’t currently have a strong foundation in the form of numerous industry groups rallying.
QQQ 1D (Tradingview)
Above you can see QQQ, the NASDAQ ETF, with a breadth indicator plotted in the bottom panes.
The blue line at the bottom, known as the Advance-Decline Line, measures in total how many names are advancing vs. declining. When the line is sloping higher, we know that more and more names are joining the rally.
What we can see is that although the line sloped higher on Thursday, there hasn’t been a significant uptick in the amount of names advancing. In fact, the line is essentially sideways for the week.
For a prolonged rally, we’d like to see breadth expanding as the index advances in price. This would provide a strong foundation for the index to fall back on and support it higher. As of Friday, this doesn’t appear to be the case.
Above you can also see a plethora of lines and moving averages I’ve plotted onto the candlesticks. The two parallel diagonal lines allow you to see the current channel that QQQ has been trading in. While this looks to me like a bear flag, anything is possible.
You should also note that on Thursday, QQQ cleared above a 3 month trendline that has turned into resistance twice already. Yesterday, QQQ was also able to close above its 10-day (green) and 21-day (blue) EMA’s by a fair margin.
Friday and the next few sessions will be key days for QQQ as it will likely run into its 50-day SMA (red) and a horizontal resistance level that dates back to the October 2020 correction around $298.
If that zone turns into resistance, logical areas that bulls would like to see support price would be at the longer-term trendline (~$286), the 21-day EMA ($288.87), or eventually the teal VWAP anchored from the December 2018 lows ($281.39) which will likely be near the lower trendline of this current flag.
Now, that all being said, price action matters significantly more than any indicator, and price is telling us that, at least in the very short-term, bulls have the reins.
What we really need to see is the indexes make higher-highs, which they have been largely unable to do since the market topped in November. I would like to see the NASDAQ retake $11,677 and then $12,320, and the S&P take $3,946 and then $4,177.
In the fixed income market, we’ve seen yields begin to rise again this week following the last 3 weeks of bond buying we saw.
US10Y Yield 1D (Tradingview)
We saw the 10-year Treasury run back into sellers as yields touched 2.75%. This was similar to the May rally where 1oY bonds saw sellers step in at 2.71% yield.
As we discussed in this newsletter last week, the rally in bonds was probable to spill over into the equity markets, as we saw this week. So now will we see the bond sell-off hit the equity markets late, just as bond price action did?
It is certainly possible, if not probable, but it is much too early to say if the rally in the fixed-income markets is even over. 10Y yields are up about 0.2% from Tuesday, but they are still about 0.5% from their previous highs.
Digging further into the fixed-income market, we saw the spread between 10-year and 2-year Treasury bond yields flip negative this week for the second time this year.
A yield curve spread gives us an idea of economic health as it allows us to gauge the expectations of market participants. When the spread is high, it means that investors are confident in the short-term, as the price for the shorter-term bond is higher than that of the longer maturity bonds.
But when the spread is falling, it shows us that people are becoming increasingly nervous about economic conditions in the short-term. If the spread falls below 0.00, meaning the yield of the shorter maturity bond is greater than the long term bond, this signals a section of the yield curve inverting.
The impacts of yield curve inversion are more than just signaling economic weakness. As short-term bond yields rise, banks are forced to raise interest rates on consumer loans like mortgages and auto loans thus decreasing many people’s savings, investment and ultimately, productivity.
Furthermore, many companies and banks earn interest by borrowing money at low short-term rates and lending out money at high longer-term rates. When the short and long term rates are equal, or inverted, it compresses profit margins.
2/10Y Treasury Spread (FRED)
The 2/10Y spread has been a strong indicator of an incoming recession. As you can see above, each time the 2/10Y spread has crossed below 0, there has been a recession within 2 years.
That being said, a negative yield curve spread DOES NOT mean that there will be a recession immediately, or that we are already in one.
Above is a list of all 2-10Y inversions going back 40 years (excluding 2022). As you can see, the average time it took from inversion until officially declared recession was 43.4 weeks, or almost 11 months.
While prolonged periods of negative yield spreads can have disastrous effects on the economy, simply seeing the 2Y yield greater than the 10Y yield doesn’t have immediate effects.
The amount of time spent with an inverted spread is more important and this is why we generally don’t see recession for at least a few quarters following inversion.
Long story short, despite the headlines, the 2/10Y spread flipping negative this week does not confirm we are in a recession, even if the Atlanta Fed is predicting the second consecutive quarter of negative GDP growth.
Following our discussion of this model last week, the Atl. Fed bumped their Q2 GDP estimate of -1.0% down to 2.1% last Friday, and then back up to -1.9% this Thursday.
While two consecutive quarters of negative GDP growth is a signal of a technical recession, it does not put the US in an official recession.
The difference between the two being that a legitimate recession has to affect numerous sectors of the economy, not just an aggregate estimate of output. A technical recession is not a good sign and in general does lead to a full recession, but a true recession has much larger negative effects on average American’s than just a technical one.
I won’t break this down too much further, but if you’d like some more information about what it takes for the NBER to declare a true recession, go back and read last week’s newsletter.
Initial Jobless Claims (FRED)
Above is a plot of Initial Jobless Claims from 1967-2020, with recessions highlighted in gray. As you can see, it takes a substantial and prolonged increase in unemployment before a recession fully sets in.
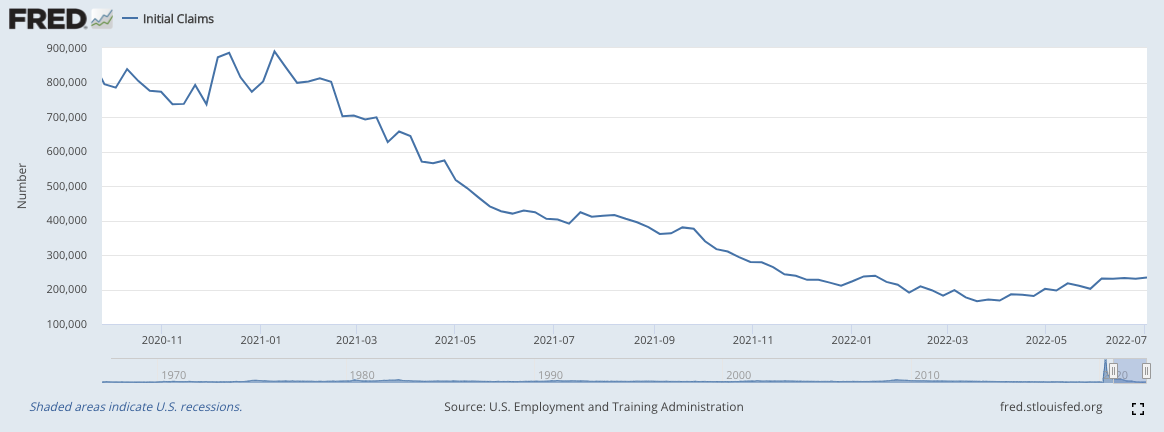
Now compare what you’ve just seen to the chart of 2020-2022 below.
Initial Jobless Claims (FRED)
We are beginning to see an uptick in folks applying for unemployment benefits following losing their jobs, but this increase in claims is still relatively small. The most recent data point, released on July 2nd, showed 235,000 claims, in comparison to 240,000 in January.
Unemployment is just one of the key indicators that we need to examine to determine whether or not we are in a recession. People may be hurt by higher fuel and food prices, and rising interest payments, but true pain sets in if there are things like mass layoffs, bank runs, and crashing asset prices.
Crypto-Exposed Equities
In the land of crypto-exposed equities, we’ve seen a relatively strong week of price action alongside Bitcoin and the NASDAQ.
As discussed last week, Microstrategy (MSTR) continues to be a strong performer.
MSTR 1D (Tradingview)
After being up over 16.5% at the close on Thursday, MSTR sits just below its 50-day SMA at $228.38. Also, the 10-day (green) and 21-day (blue) EMAs are fairly close to a crossover, which could signal an uptrend, at least in the near-term.
The Relative Strength Line shown above in pink is now pointed to 1:00, indicating that MSTR is outperforming the general market to a vast degree. Furthermore, volume was up on the advance it made Thursday, as institutions are clearly accumulating shares.
MSTR’s performance is, of course, closely tied to that of spot Bitcoin’s price action. We are NOT including MSTR analysis to persuade you to buy shares, instead we want to share some characteristics of a stock showing relative strength.
A few other crypto-equities I’ve noticed outperforming the pack from a technical perspective are: CAN, HIVE, EBON, and BTBT
Above, as always, is the table comparing the Monday-Thursday price action of several crypto-equities to that of Bitcoin and the mining ETF WGMI.
Bitcoin on-chain & derivatives
BTC has seen a bit of relief this week, looking at its largest weekly candle since April. One thing to keep an eye on is the 200WMA, a level watched by many market participants. Having never closed below the MA on a weekly close, it has been a bit concerning to see BTC slice through like butter and consolidate below. A positive signal would be a weekly close (in 2 days) back above, making everything below a deviation and likely triggering some trend algos. Not saying this WILL happen, but using our IF, THEN format as something to keep an eye out for.
BTC loves to break records, and last quarter was officially its worst quarter on record. With it in the mirror, we now look onto Q3; which has ironically been the worst-performing quarter for BTC historically. If history continues, would align with our thesis of sideways consolidation/chop/accumulation for the intermediate future. In our view, Bitcoin has likely seen the majority of its capitulation through price, and now likely will see some capitulation through time/boredom.
One interesting thing to note has been the United States’ trading hour premium that has come about over the last week weeks. This means Bitcoin has been trading at a higher price relative to other trading sessions (US/EU).
It appears the forced selling we noted by looking at the correlation of BTC/ETH and the rest of the crypto market has subsided. The idea here is that funds that faced redemptions at the end of month/quarter/half had sold off the two most liquid assets that they are able to sell, as altcoins have very minimal liquidity at the moment.
Form a derivatives perspective, there are a few things we want to see to feel comfortable in expecting a reversal. From a high level, this is an underlying spot bid into a counter-trend consensus from derivatives traders. For example, spot buying derivatives aggressively shorting or spot selling and derivatives aggressively longing. One of the major things to watch is open interest, telling you how many contracts are open. Think of open interest as the amount of fuel laid out for a potential move, but doesn’t tell you the positioning of that fuel. One way you could try to use open interest to gauge position would be by looking at its behavior in context with price (for example: OI rising on pushes down but wiped out quickly on any pops up, likely aggressive shorts). We want to see open interest rise in both USD nominal terms and relative terms (OI compared to BTC’s market cap).
To gauge positioning, we can look at funding rates; based on the delta between spot index (weighted average of spot exchanges) and perpetual swaps. Funding rates are most actionable in two ways in my eyes. The first of which is a divergence between price and funding rates; indicating derivatives aggression is offsides relative to the underlying spot market. The second of which is a prolonged regime of either positive or negative funding; from a psychological perspective this means that traders are becoming conditioned to continue a certain behavior (for example in early 2021 longing every dip, or in summer 2021 fading every push to range highs). That conditioning (and the more conditioning the more so this is the case) allows move into the new regime change to be even more aggresive.
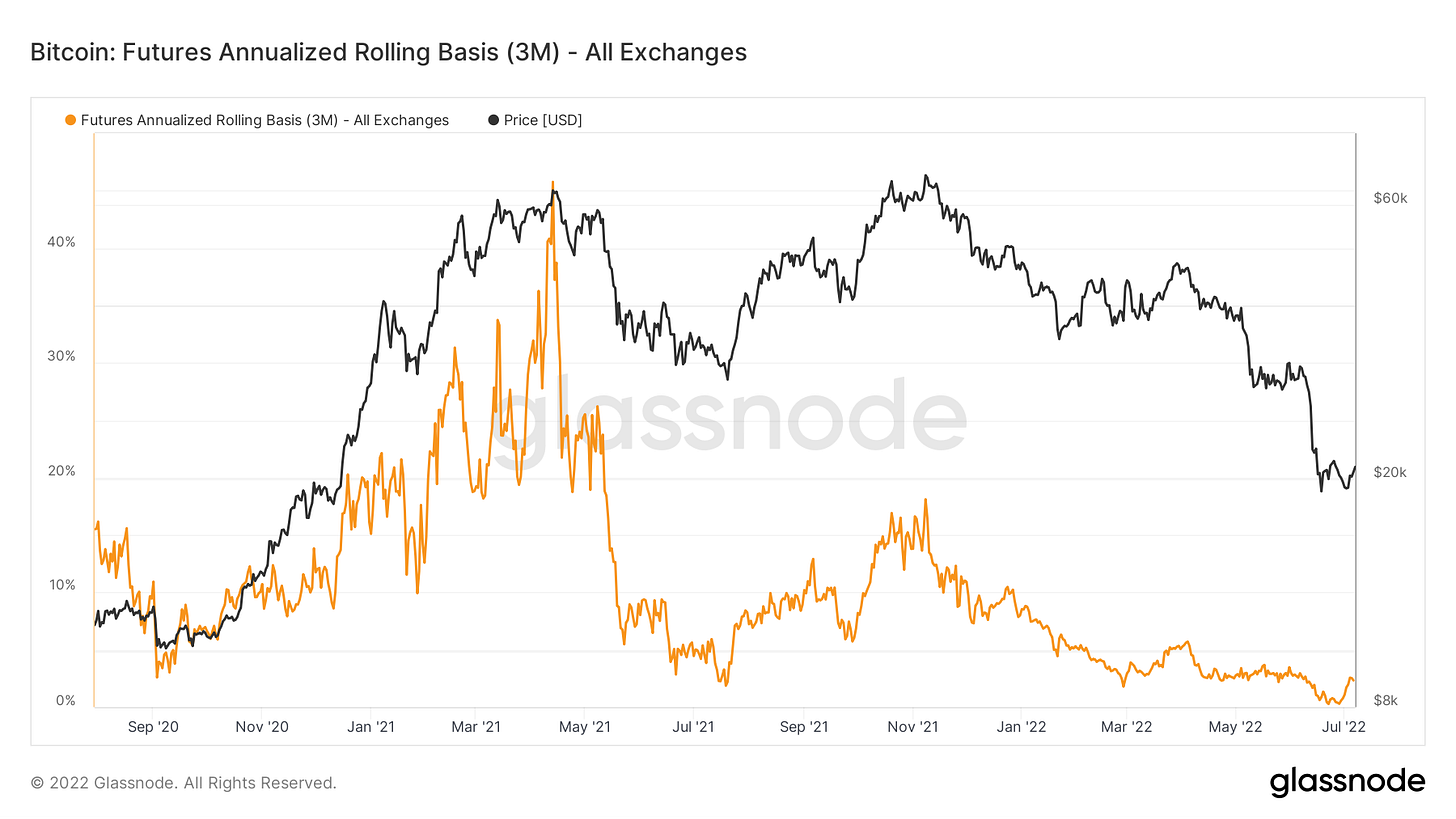
The last thing to watch is the 3M basis or quarterlies. Whenever quarts trade in backwardation it has historically marked a good time to pick up some BTC, as traders are either becoming extremely bearish or funds/whales are blowing up. We have seen quarts go briefly negative on a few venues including FTX/Okex/Deribit.
We’ve talked about a lot of valuation metrics over the last few weeks but one we haven’t touched on is the Puell Multiple. As a gauge for miner profitability, this compares the USD value of issuance to the 365 average of issuance. Entering the green zone is a good time to average in, and for those more conservative you can also wait for confirmation with a move out of the accumulation zone.
MVRV remains in the accumulation zone, indicating Bitcoin’s marginal trading price is below the aggregated cost basis of the market based on the average price every participant has paid for their coins.
To end this out with a long term perspective, have two charts with a broader view. When we look at user growth over time, no matter how aggressive the drawdown from its peak during the bull market, this has always set higher lows over the years. This indicates that although the speculative participants buy BTC solely for the price going up in the short term, in every bear market a larger number of individuals stick around with a long-term conviction in the asset.
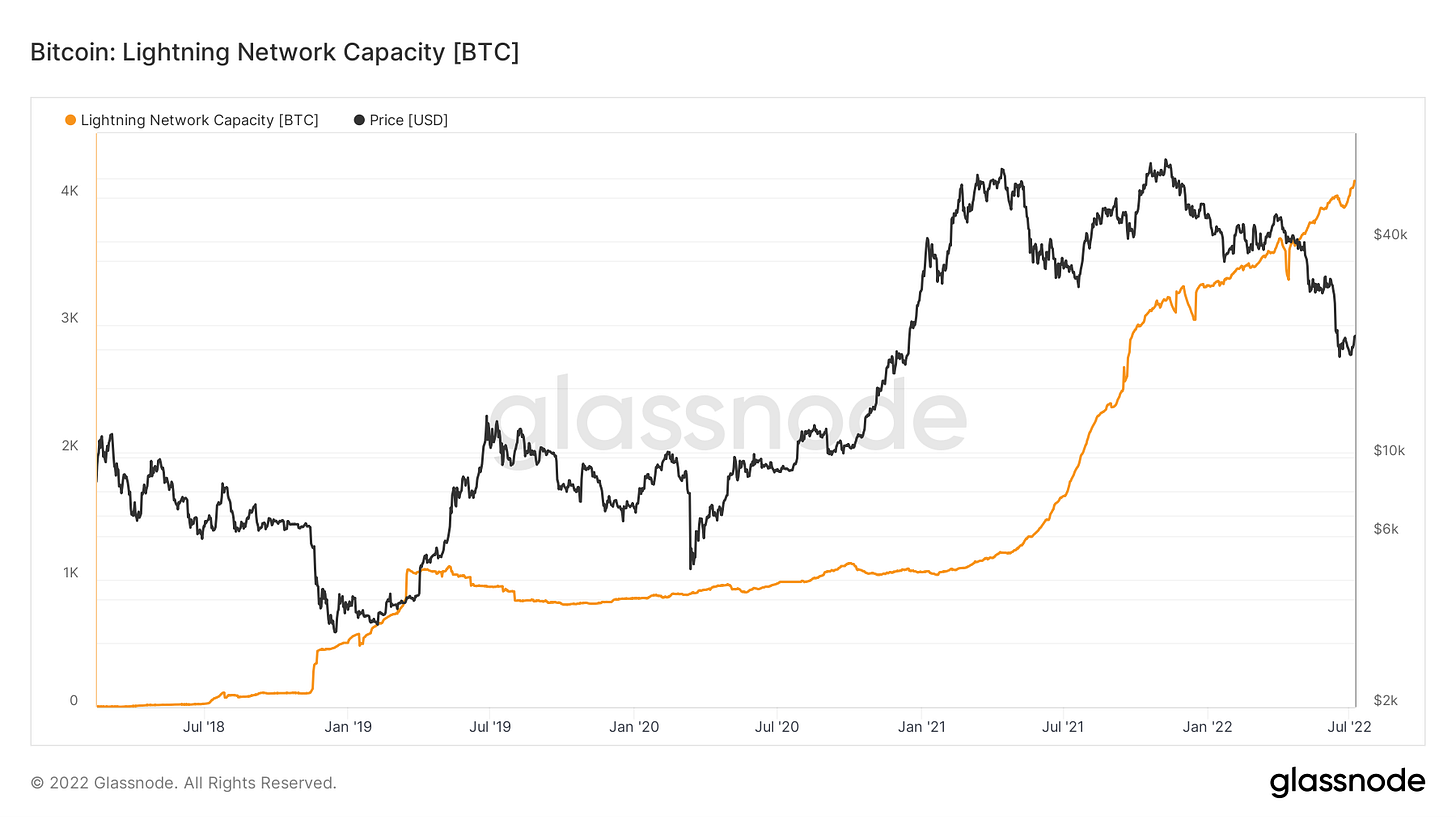
Despite the price drawdown, lightning network stats have continued to see growth. This is very positive for the growth of Bitcoin’s L2, but to be fair the lightning network is still (for now at least) relatively very small; just 4K BTC in a public capacity.
Bitcoin Mining
Weak Miners are (Still) Capitulating
As mentioned in previous Blockware Intelligence Newsletters, hash ribbons (chart below) indicate whether miner capitulations are occurring. Miner capitulations are when a significant net % of miners turn off machines over an extended period of time.
At the start of July, it looked like there was potential for the capitulation to be close to ending, but recently hash rate diverged again.
Miner Breakeven Table & Chart
While it’s far from an exact science, it’s possible to attempt to piece together the total Bitcoin mining network based on what machines are running and the electricity rate they are running at. Using public miner investor relations resources, CoinShares Research, and Blockware Research, the following updated table was created assuming a Bitcoin price of $19,500 and a hash price of $0.08.
As you can see above, older generation machines are only profitable when their operators run them at highly cheap electricity rates. Currently, $0.03 / kWh or less is profitable. This leaves virtually only wasted/stranded energy as a potential energy source for these old-generation mining rigs, and it’s why it accounts for a much smaller percentage of the total network hash rate.
Further, new generation ASICs are still well into the money at all reasonable electricity rates. Unlike old and mid-generation mining rigs, getting new generation rigs plugged in and running immediately is more of a priority rather than scoping out for the cheapest electricity available that may be much more difficult to find at scale. This is why new generation rigs operate at higher electricity rates.
Difficulty Decreasing
As noted in the above two sections, inefficient miners have been shutting off machines, hash rate is decreasing, and difficulty is dropping. The previous four times there were significant drops in difficulty were: March 2020 crash, May 2020 halving, 2020 China rainy season, and the China mining ban.
Historically, when a significant amount of miners are under pressure, they are forced to turn off, capitulate their Bitcoin treasuries and rigs, and add extra sell pressure creating a price bottom. Once miners are done capitulating, only the strongest miners remain and there is less day-to-day sell pressure on the Bitcoin network. The weakest miners with the highest operating expenses and the poorest balance sheets are no longer mining Bitcoin and selling. Only the strong remain.
Bitcoin/Crypto Industry News
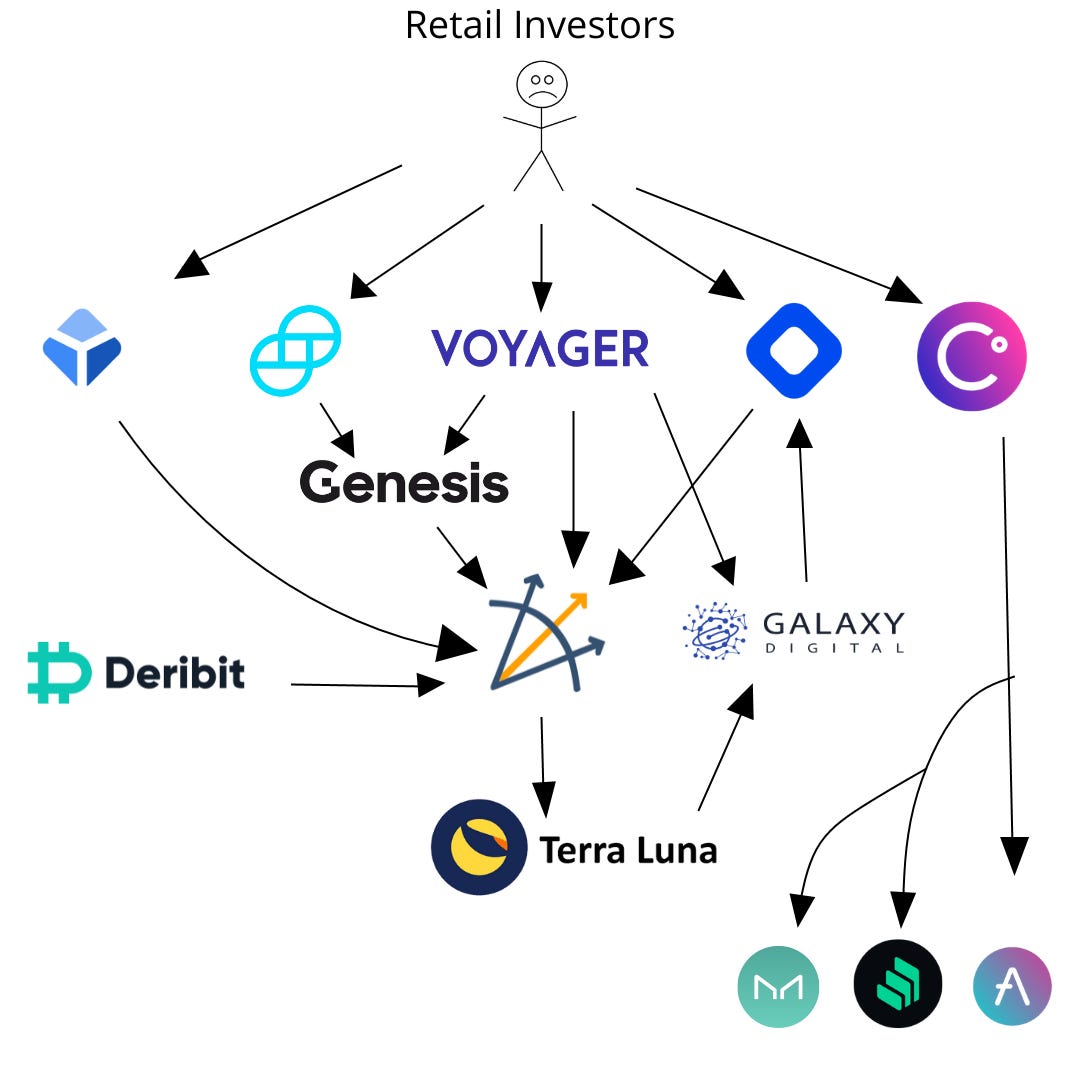
The snafu of crypto lending platforms and exchanges continues to unravel. For those who have had difficulty following along, or minimal time to shift through the developing story, here is a high level overview of the situation and the parties involved.
Ever since the tide went out with the collapse of Terra/Luna in May of this year, company after company have been exposed as swimming naked. At the center of it all is Three Arrows Capital (3AC). With an over $200m position in Luna, as well as large positions in the struggling GBTC and stETH, 3AC officially filed for Chapter 15 Bankruptcy last friday.
BlockFi, Voyager, Gemini, Blockchain.com, and Deribit are all confirmed to have been exposed to 3AC through direct or indirect lending. BlockFi and Voyager have flopped the hardest thus far.
BlockFi reportedly had lent 3AC $1b; two-thirds of which was in the form of BTC, which was promptly recovered and liquidated. But one-third of the loan was in the far less liquid GBTC. In the aftermath of this BlockFi has since confirmed a deal with FTX to be acquired at a price of up to $240m.
Voyager has also filed for Bankruptcy; Chapter 11. Out of $1.3b assets undermanagement, almost half of this, ~$650m, has been loaned to 3AC and will likely remain outstanding indefinitely.
BlockFi and Voyager were popular for providing customers with the ability to earn interest on Bitcoin or other crypto tokens. However, by leaving assets on their platforms, whether to generate interest or not, customers were acting as unsecured creditors funding each platform's investments into 3AC. This is stated in the user agreements for both BlockFi and Voyager.
Another lending platform who has exposure to 3AC is Gemini, owned by Tyler and Cameron Winklevoss. This is not direct exposure but it is exposure nonetheless. According to the Gemini Earn Legal Agreement, Genesis Global Capital is an approved borrower of client funds placed in Gemini Earn. Genesis is deep underwater on a loan to 3AC of an undisclosed amount; likely 9-figures plus.
Last but not least, Celsius appears to have been running a borderline ponzi scheme. A former Celsius Employee has taken legal action against the company claiming that they used new customer deposits to make interest payments on existing customer deposits. Of course running what appears to be a ponzi-like operation was not Celsius’s first move. Plan A was investing in miscellaneous yield offerings in DeFi; including Maker, Compound, and Aave; as well as others such as higher risk offerings such as BadgerDAO that were compromised. This strategy worked fine during the up-only bull run of 2021. But it was far from sustainable and when the bear market began to dawn Celsius resorted to different strategy.
Celsius may be protected from legal consequences because, like the others, Celsius has it in their terms of use that all assets posted on the platform are controlled by them and they have no obligation to guarantee return of funds to customers.
Also in the midst of all this is Galaxy Digital. They are an investor in BlockFi, they have an outstanding liability to Voyager of ~$34m, and most curiously of all, they suspiciously netted ~$350m in realized gains off Luna a couple weeks prior to its collapse.
All content is for informational purposes only. This Blockware Intelligence Newsletter is of a general nature and does consider or address any individual circumstances and is not investment advice, nor should it be construed in any way as tax, accounting, legal, business, financial or regulatory advice. You should seek independent legal and financial advice, including advice as to tax consequences, before making any investment decision.


good piece