

Blockware Intelligence Newsletter: Week 91
Bitcoin on-chain analysis, mining analysis, macro analysis; overview of 6/12/23-6/16/23


Blockware Intelligence Sponsors
Stamp Seed’s DIY tool kit gives you the ability to hammer the seed words generated from your hardware wallet into commercial-grade titanium plates, using professionally designed metal stamping tools.
By hammering each letter into titanium, your words become one with the metal, meaning no loose pieces or varying materials that could fail under extreme conditions. Our plates are fire-resistant, crushproof, non-corrosive, and will not decay over time, allowing you to HODL for the long haul.
Use code BLOCKWARE15 for 15% off sitewide, valid through June 2023.
Summary:
May CPI came in close to expectations, showing continued disinflation underway in the US.
FOMC held the Fed Funds Rate at 5.0-5.25% on Wednesday.
The 4-week moving average of Initial Jobless Claims hit it’s highest value since November 2021.
Retail Sales grew by 0.3% in May.
Blackrock is reportedly close to filing for a Bitcoin trust, and will use Coinbase as their custodian.
Bitcoin is up on a year-over-year basis for the first time since early 2022.
Accumulation from retail sized entities remains elevated, which has, in recent times, been indicative of local bottoms.
BTC has lost the support of short-term holder realized price, signaling market participants should remain cautious in the short-term.
BTC nears a potential long liquidation level at ~$24,800.
Open interest relative to market cap remains down in comparison to 2022, which indicates that any downward volatility should be less impactful than that of 2022.
Blockstream aims to disrupt the mining hardware landscape with the launch of its first Bitcoin ASIC in late 2024.
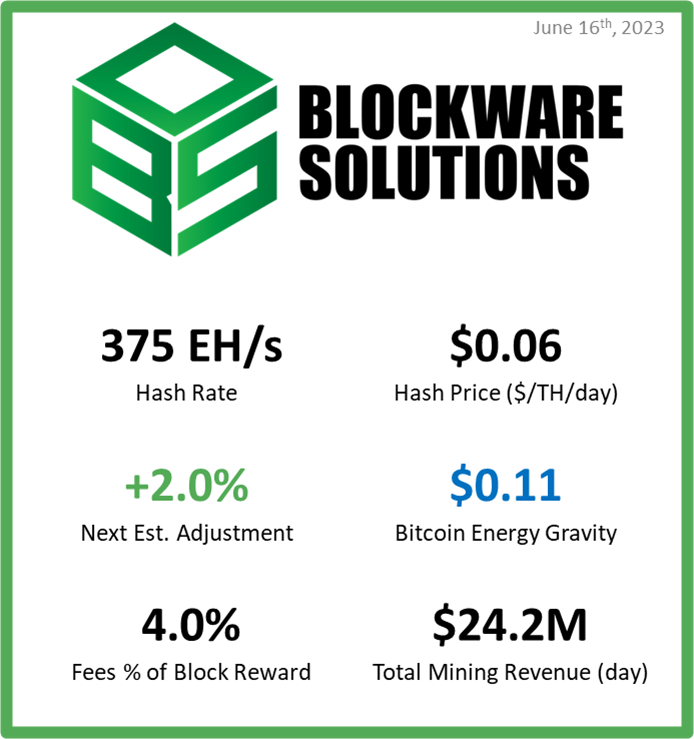
Coinmetrics' report exposes the changing Bitcoin mining ASIC model landscape.
The breakeven electricity rate for a modern Bitcoin ASIC is $0.11/kWh.
At a typical hosting rate today, new-gen Bitcoin ASICs require ~$16,500 worth of energy to produce 1 BTC.
General Market Update
As we previewed here last week, it’s been quite the week of economic data releases and monetary policy decisions.
The first piece of data came on Tuesday, with the release of May’s CPI numbers from the Bureau of Labor Statistics. The numbers were as follows:
Headline CPI:
YoY: 4.0% vs. estimates of 4.0%
MoM: 0.1% vs. estimates of 0.2%
Core CPI:
YoY: 5.3% vs. estimates of 5.2%
MoM: 0.4% vs. estimates of 0.4%

As you can visualize above, it's obvious that significant disinflation is underway in the United States. However, many central banks, including the Fed, remain concerned that inflation will become “sticky” above their 2% goal.
This remains a possibility, and is something we discussed in our 2023 Market Forecast. That being said, if the Fed can attain their goal of raising unemployment, then disinflation will continue.
Remember that prices are a function of supply and demand, if a growing number of Americans are without income, their spending will decrease. Less spending = less demand = lower prices.
This disinflationary spiral can indicate a recession, if allowed to go far enough.
The Fed reacted to this CPI news, and recent employment data, precisely as the market had expected. FOMC elected to hold the Fed Funds Rate at 5.00-5.25% on Wednesday.
One thing to note is that while they didn’t increase rates, this move by the Fed still postures them to continue tightening financial conditions. With inflation on the decline, real rates will continue to rise despite the overnight lending rate held stagnant.

Displayed above is the relationship between nominal and real interest rates. If, for example, the inflation rate dropped to 3.5%, with nominal rates held at 5%, the real rate is now 1.5%.
In his post-meeting press conference, Chair Powell reaffirmed the Fed’s focus on lowering inflation. Powell was sure to repeat that this doesn’t mean the hiking cycle is over, and the market has priced in another 25bps hike in July.
He also discussed employment in-depth, repeating the sentiment that unemployment will need to rise before the Fed can be comfortable cutting rates.
Last week we discussed Initial Jobless Claims, which rose to 261,000 for the first time since October 2021. On Thursday we got new IJC numbers, which showed a revision of last week's number, up to 262,000.
Initial Jobless Claims, 1W (FRED)
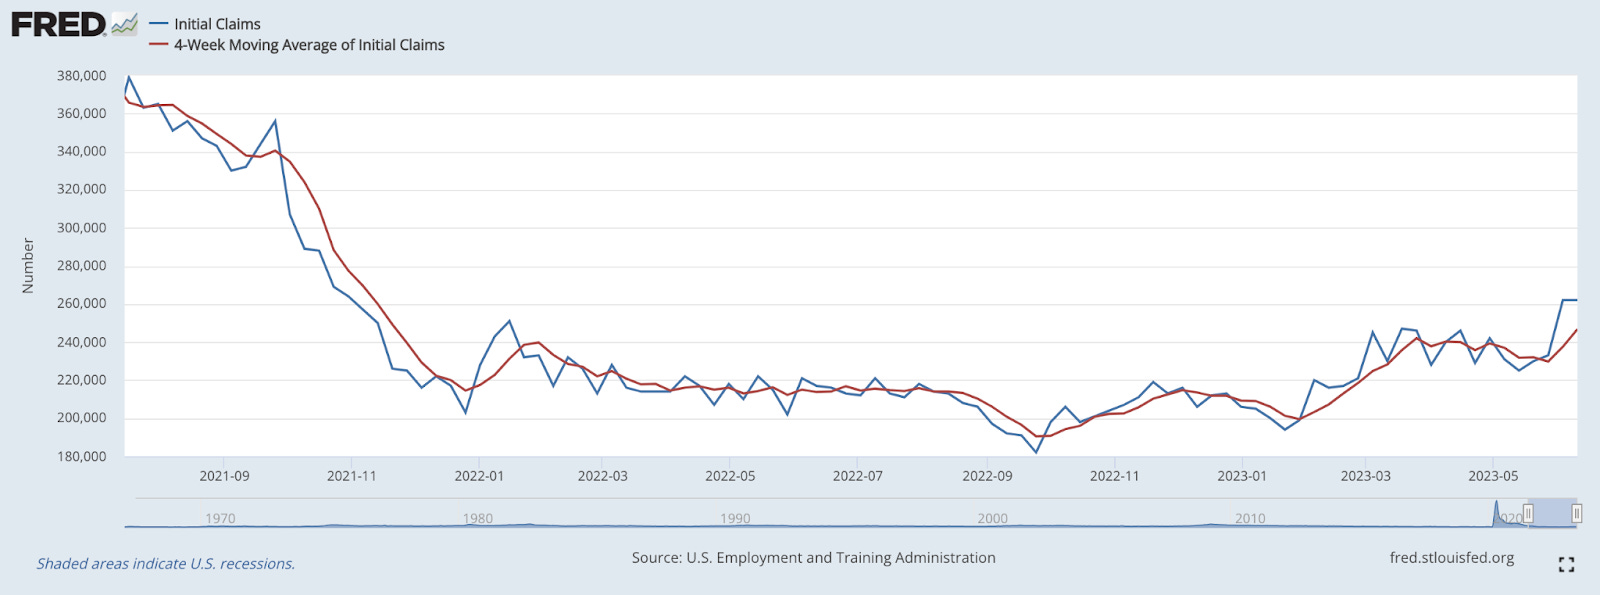
The number this week was also 262,000. IJC’s are volatile, for this reason we like to look at a 4-week moving average of claims, shown above in red. As of this week, the 4-WMA of IJC’s sits at 246,750, its highest value since November 2021.
While this doesn’t completely encapsulate the Fed’s ambition of softer employment conditions, it’s a step in that direction.
Despite this slight uptick in unemployment claims, retail sales are showing that the consumer remains strong.

Retail sales grew by 0.3% in May, according to this survey from the Census Bureau. This was a marginal downtick in growth from April’s 0.4%.
This growth largely stemmed from large spending in building supplies and automotives. These are 2 sectors that you would not expect to see rising spending in if Americans were feeling the effects of a recession.
The Treasury market doesn’t appear overly concerned about future rate hikes, with yields heading lower across the curve yesterday.
Nasdaq Composite Index, 1W (Tradingview)

With the rise in bond prices, the Nasdaq continued to scream higher in an (almost) 8-week win streak. As of Thursday’s close, the index is up nearly 37% from its October bottom, and would need to rise an additional ~17.6% to make a new all-time high.
As indicated on the chart above, the most probable resistance zone falls between $14,200-14,600. If sellers are to step in there, we’d prefer to see a period of sideways consolidation on declining weekly volume.
The S&P also has been acting quite strong, and the Dow Jones has even poked its head above resistance this week.
IWM, 1W (Tradingview)
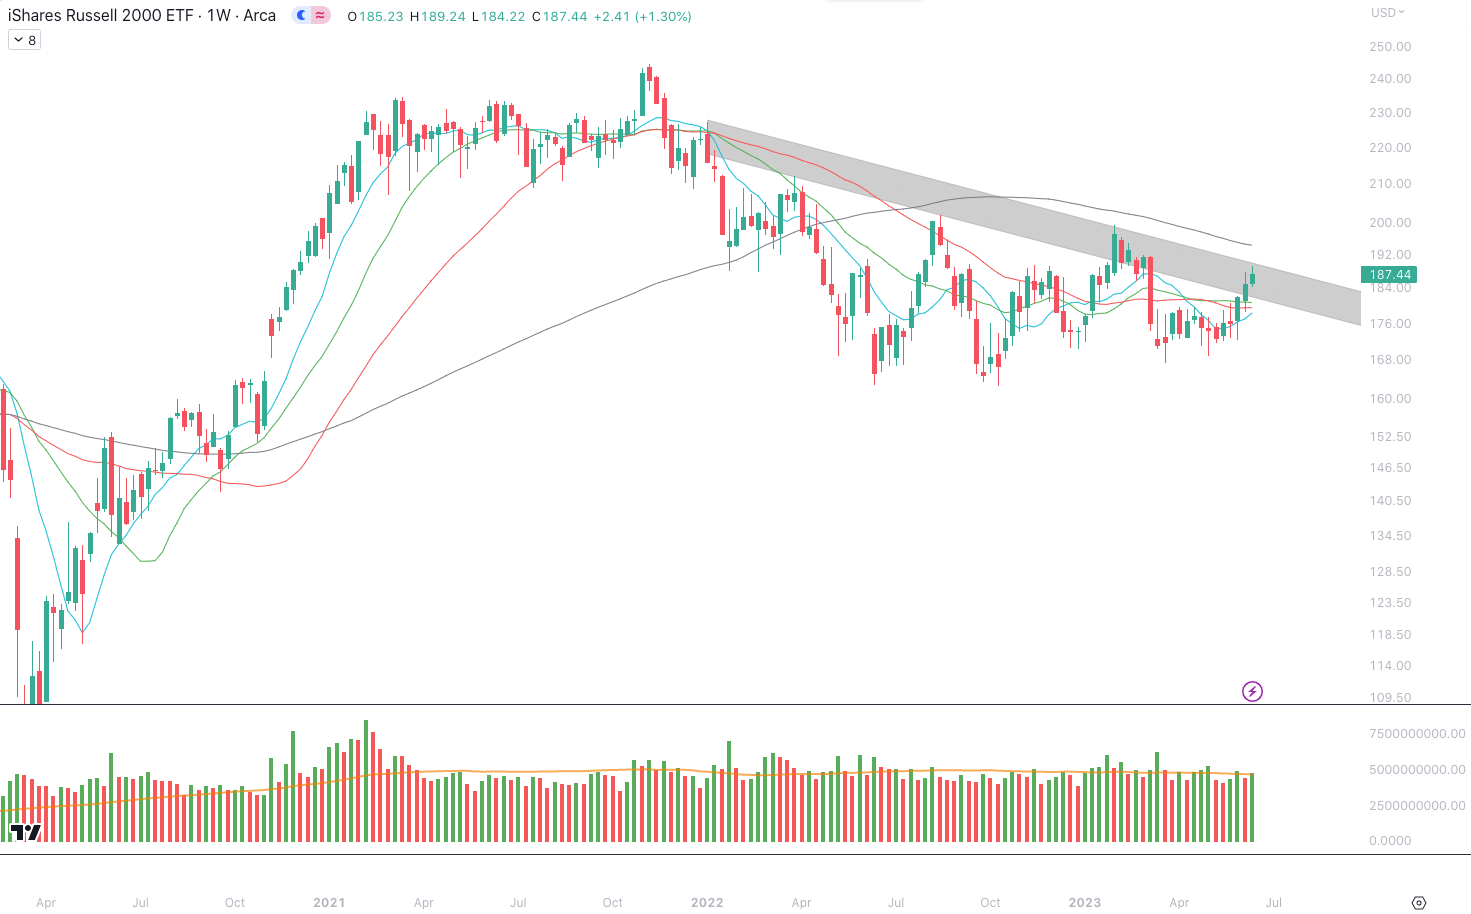
Another important chart to watch next week is the Russell 2000. This small-cap index has had a strong last few weeks, contributing to the improving conditions across the equity market.
Now, as price has entered into a strong resistance zone, risks are heightened for sellers to bring this index lower. This could very easily pull the legs out from under the Nasdaq.
Note that the markets will be closed on Monday in observance of Juneteenth in the US.
Bitcoin Exposed Equities
It's certainly been an interesting week of price action amongst Bitcoin exposed equities, with a couple names flying high.
Before we get into that, it’s worth noting that Coindesk broke the news that Blackrock, the world’s largest asset manager, is reportedly close to filing for a Bitcoin trust. While they have not actually filed with the SEC, it appears imminent.
The timing of this announcement in proximity to the SEC’s crackdown on “crypto” is not coincidental. If you read last weeks newsletter, you’ll remember that we said:
“Washington, D.C. clarifying their position on this matter signals to institutional investors that Bitcoin, not “crypto”, is where they are safe to deploy capital.
Institutions have been given the green light to pursue Bitcoin based products as regulators have made it clear that they understand BTC is a commodity, not a security, and it will not be regulated as the latter.
It’s also important to note that this is not a spot ETF, or not really an ETF at all for that matter. The difference between an ETF and trust is fairly minor, with a trust being an actively-managed fund.
Blackrock will reportedly use Coinbase as their custodian of the Bitcoin.
Both Greenidge Generation (GREE) and newly-listed Bitdeer (BTDR) have had crazy weeks of price action. While GREE’s Wednesday 50% jump was simply the result of extremely low liquidity, BTDR had a few pieces of news this week.
To back track, BTDR might not be a name you’ve heard of. In full 2021 fashion, they were listed on the Nasdaq via SPAC merger in April.
BTDR operates 14 EH/s, according to their website, and offers cloud mining services. The news this week came on plans to build out a 100MW carbon-neutral facility, as well as a $1M share buyback.
It’s extremely important to keep in mind that BTDR, GREE, and most other miners, are extremely illiquid names. This brings execution risk into the fold for traders, where you may not get filled exactly where you were hoping.
For options traders, it can be hard to fit a counterparty to take the other side of your trade. For these reasons, institutions may avoid these names until they’re well established.
This is also why these names have had such big weeks, if anyone moves in/out of these names with size, price moves significantly. Proceed with caution.
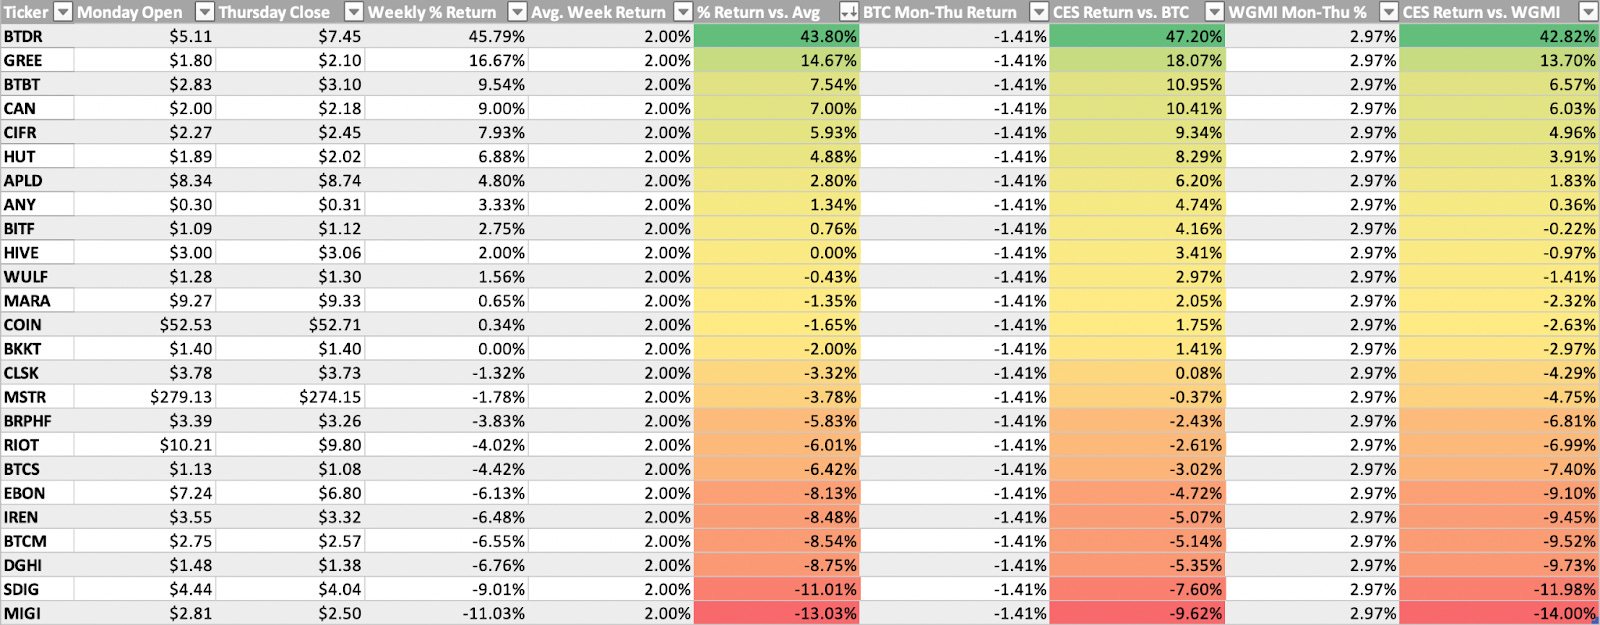
Above, as always, is the table breaking down the Monday-Thursday price performance of several Bitcoin exposed equities.
Bitcoin Technical Analysis
It’s also been a crazy week of price action for Bitcoin. While we did break below a major support level, price has (so far) recovered this level.
BTC/USD, 1D (Tradingview)

If Bitcoin can continue higher into next week, it will be important to keep an eye on the key moving averages hanging overhead. Primarily, the 10-day (~$25,900) and 21-day (~$26,300) EMAs have attracted sellers as of recent.
The upper trendline of this recent channel, shown above as a downward sloping black line, is the main area I’m watching over the medium-term. A clean break above this line would be huge for the bulls.
If BTC is to continue lower, there are 3 majors levels to watch.
YTD AVWAP: Shown above in blue at ~$24,300
200-day SMA: Shown above in black at ~$23,800
AVWAP from cycle lows: Shown above in red at ~$21,900
Bitcoin On-Chain/Derivatives
BTC is now up on a year-over year basis. This concludes a 490 day stretch in which the price of BTC was down year-over-year; the longest such stretch in Bitcoin history.
While this is not indicative of where the price of BTC is headed in the short-term, BTC being up on the “1-year” chart could have a positive impact on the psychology of potential new market participants.

On the point of observing year over year Bitcoin developments, the supply last active 1 or more year(s) ago continues to hit all time highs, now having eclipsed 68.6%.
1 year ago BTC dropped below $25,000 in wake of elevated interest rates and “crypto” contagion. Observing the recent rate of increase in the supply of BTC last active 1+ year(s) ago shows us how much BTC was accumulated during that moment of capitulation and has been held since then.
The 2-day increase on the chart is ~0.16%. This equates to ~33,600 BTC. Based on the BTC price at that time, roughly $746,000,000 was used to “buy the dip.”

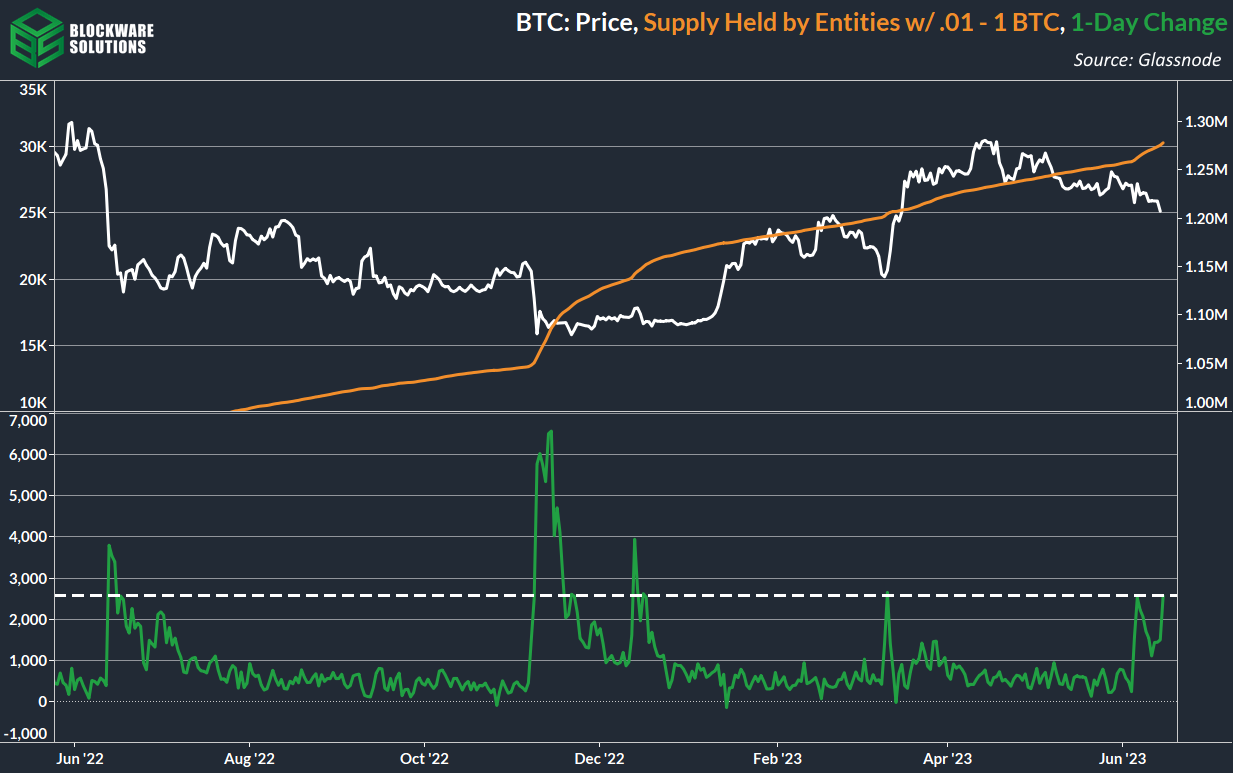
Retail-sized entities (.01 - 1 BTC) are accumulating at an accelerated pace, continuing the trend we observed last week.
In recent times this has been a reliable indicator of local bottoms, it would be great to see that trend continue. Even if this does not mark a local bottom, seeing consistent accumulation from smaller sized entities is the sign of a healthy Bitcoin network. Despite all of the noise and chaos, there's a dedicated group of Bitcoin “plebs” that are stacking sats relentlessly.
BTC has lost a key short-term support level that we have been eyeing: short-term holder realized price. This means that now the aggregate cost-basis of short-term holders (holding BTC for < 155 days) is greater than the price of BTC, in other words, a majority of short-term holders are in the red.
In the meantime, STH RP will now serve as resistance until it is re-captured.

A wall of long liquidations lay in wait at the ~$24,800 level. At the time of writing, BTC currently sits at ~$24,980. There is little margin for error now for long traders.
However, should the short-term headwinds push us to these liquidation points, it is unlikely that we experience a red-candle with the same potency as that which occurred during the liquidation cascade of November 2022.
Because…

…the overall state of leverage within the market (as measured by perpetual futures open interest relative to market cap) is far beneath what it was seven months ago.
Leverage has accumulated somewhat in the past month as price bounced between $25,000 and $28,000, a range free of liquidation points for both longs and shorts.

Bitcoin Mining
Blockstream’s Bitcoin ASIC in Late 2024
Blockstream, the pioneering force behind Bitcoin infrastructure, has set its sights on launching its first Bitcoin ASIC in late 2024. With this highly anticipated release, we eagerly await a fresh contender in the realm of mining hardware. As we anticipate its arrival, comparisons with established players like Bitmain and MicroBT are inevitable.

Intel, a technology powerhouse, once attempted to venture into Bitcoin ASICs. However, after a 12-24 month endeavor, they ultimately exited the Bitcoin ASIC game. It is worth noting that Intel's retreat coincided with the 2022 bear market, which brought a lack of demand for mining hardware. This context serves as a reminder of the challenges inherent in the industry and the importance of timing and market conditions. Blockstream's calculated entry into the ASIC market takes these lessons to heart, aiming to navigate the unpredictable tides with strategic foresight.
Coinmetrics' Unveils ASIC Model Distribution Insights
In a captivating report by Coinmetrics, we gain fascinating insights into the intricate world of Bitcoin mining machine models. By examining Bitcoin nonces—the solutions to Bitcoin's proof-of-work mining—they estimate the total hashrate of various machine models. Digging into their findings, we witness the evolution and shifting market dynamics of the Bitcoin Mining industry.
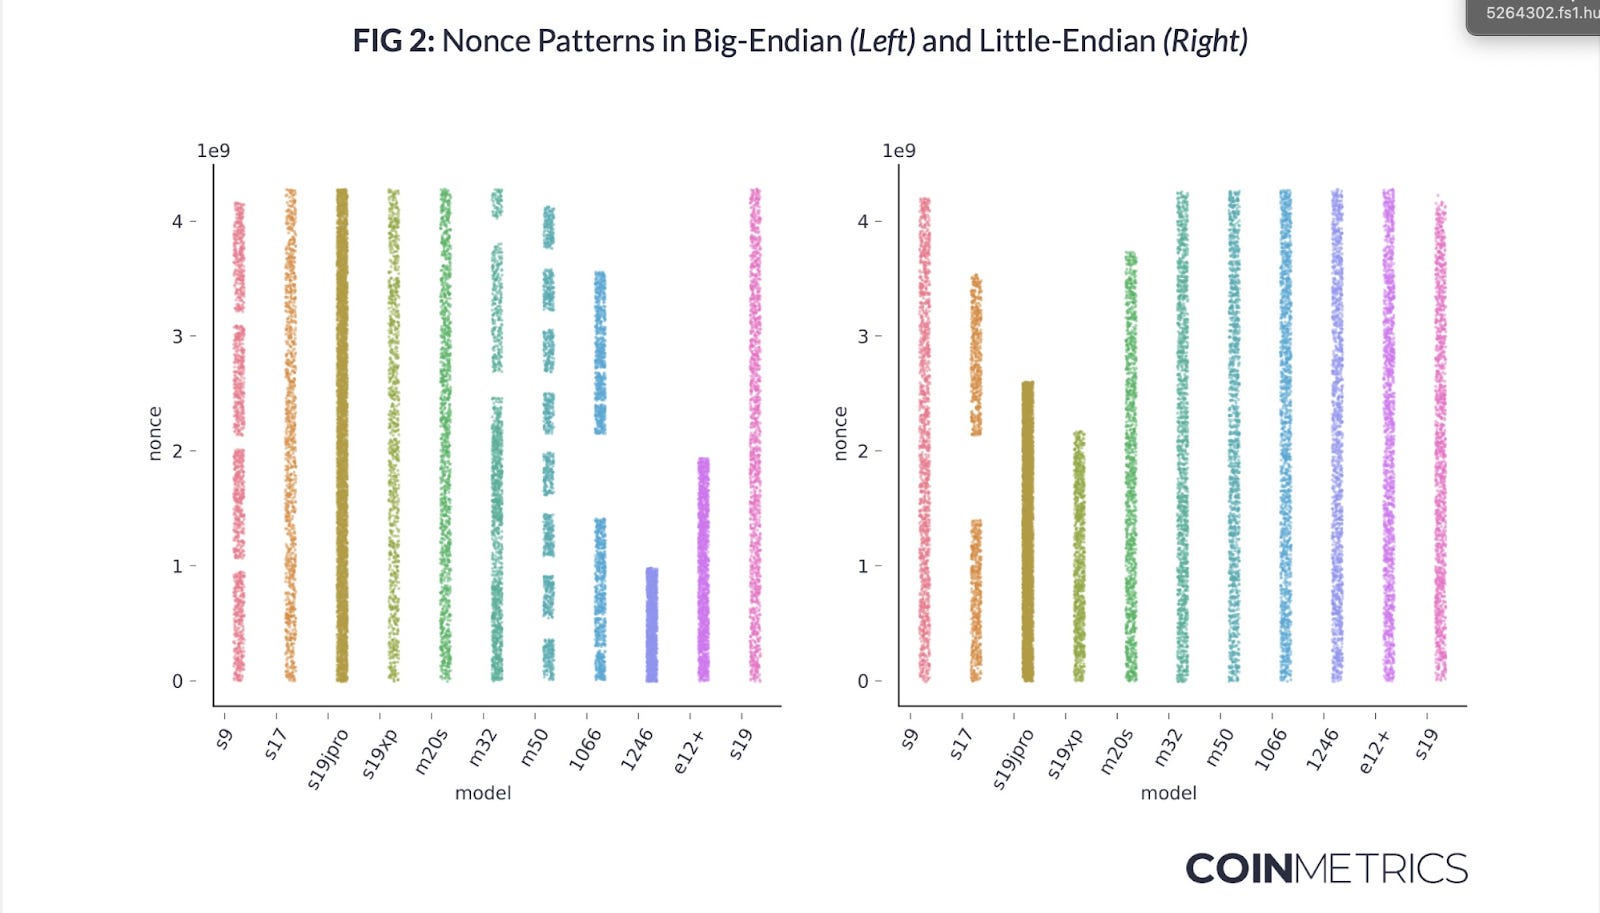
Over time, as older generation machines fade into obsolescence, newer generation models emerge as dominant forces in the mining landscape. Coinmetrics' analysis highlights this shift, with the disappearance of S9s and the ascending prominence of S19XPs. This paradigmatic transformation reinforces the industry's relentless pursuit of optimization and efficiency. The Bitcoin mining ecosystem is undoubtedly an arena where evolution and adaptation are the key to survival.

While Coinmetrics' report offers valuable insights, it is crucial to maintain a critical eye when examining the data. The absence of MicroBT Whatsminer M50 series machines in their analysis raises questions regarding its completeness. While we appreciate the analysis presented, it behooves us to remain diligent in our evaluation of such reports.
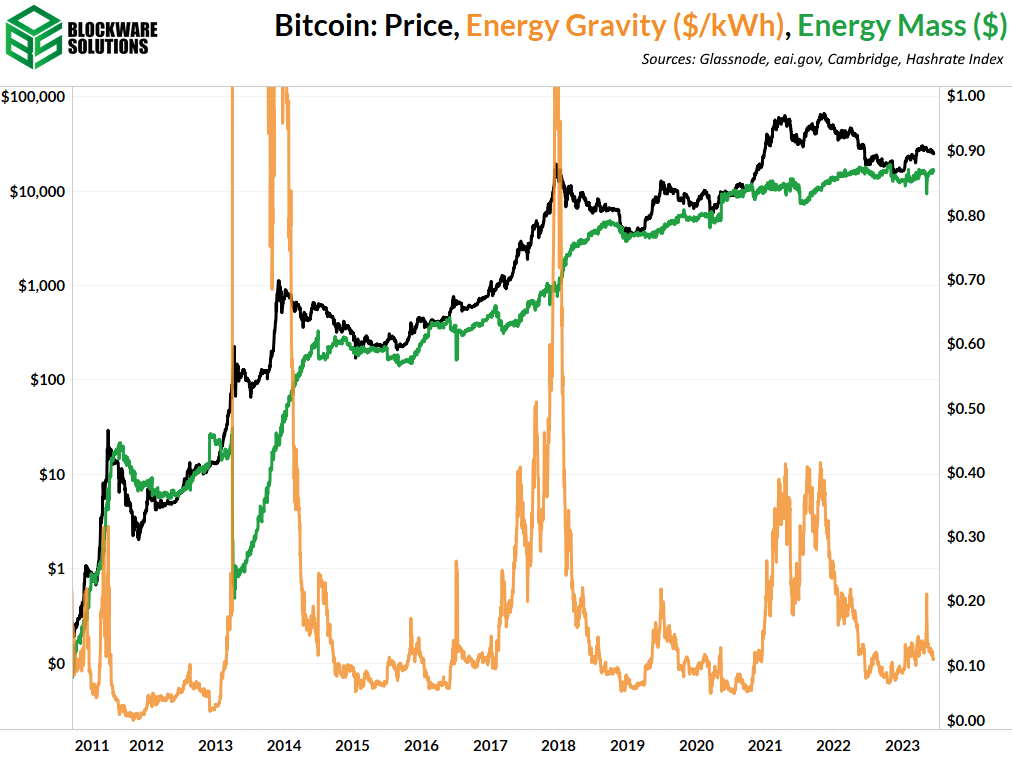
Energy Gravity
The presented chart, which is based on a Blockware Intelligence Report, depicts the correlation between Bitcoin's production cost and its market price. The model facilitates the identification of overbought or oversold market conditions for Bitcoin, making it a valuable tool for visualizing price trends.
All content is for informational purposes only. This Blockware Intelligence Newsletter is of general nature and does consider or address any individual circumstances and is not investment advice, nor should it be construed in any way as tax, accounting, legal, business, financial or regulatory advice. You should seek independent legal and financial advice, including advice as to tax consequences, before making any investment decision.