BTC showing Reversal Signals
Metrics showing Bitcoin is ripe for a reversal
Dear readers,
Hope all is well. Starting next month, the letter that is usually sent out on Pomp’s substack channel on Fridays (the weekly recap) will now be sent out on this channel.
I wanted to share a quick update on some metrics that are all showing confluence for a strong reversal in the coming weeks.
Firstly, we have the liquid supply ratio. This is something that Willy Woo and I created, essentially showing the rotation of BTC from weak to strong hands. There is a clear bullish divergence in the ratio, with a lower low made in price and a higher high in the ratio. AKA strong hands are increasingly buying as price is going down.
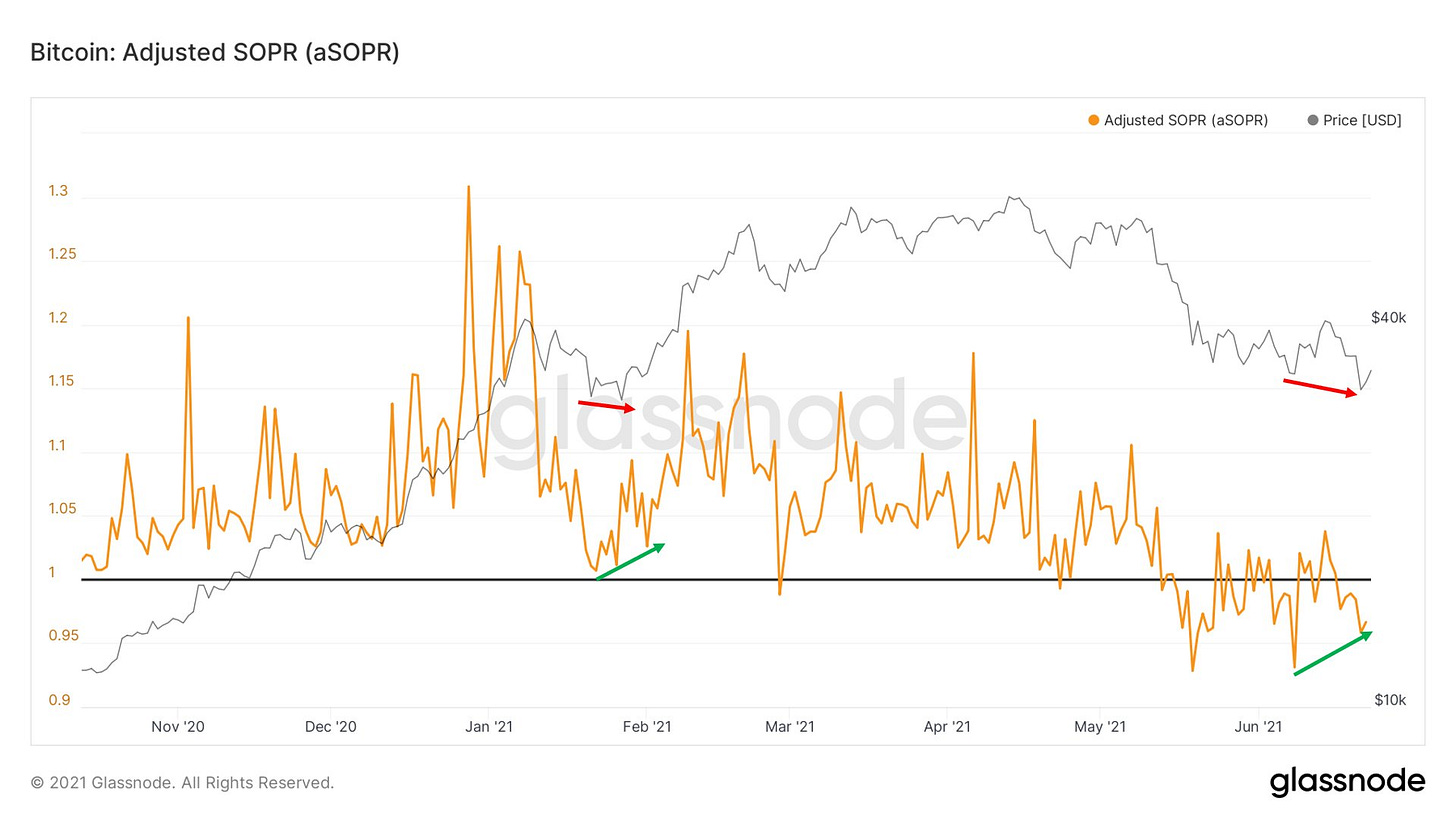
Another bullish divergence is shown in SOPR, which measures profit held by coins trading on each given day. Once again we have a higher low in the ratio while there’s a lower low in price. Last time there was a bull div this clear was in late January, when price went on a strong rally following.
Next is an oscillator that I created myself and actually published today, creating buy/sell signals based on OTC outflows. (high net worth/institutional buying) This has created signals with roughly 90% accuracy over the last year, while I suspect the one missed signal (second to last buy signal) will eventually show to be a great buy opportunity over the coming months.
A non on-chain metric, Bitfinex whales that had opened a massive short position have almost entirely covered. One can see this as bullish but potentially also neutral to bearish as these shorts can no longer be squeezed. Just thought I’d add this in as food for thought.
These metrics may not predict immediate (next few days) price action, but I highly suspect a reversal is coming over the next few weeks. Looking forward to touching base Friday, cheers guys.


hey William, the last two images don't show up ("Image not found")
Stellar work here, Will. As a 20 year institutional investment veteran, I'm really impressed with your work.