Blockware Intelligence Newsletter: Week 49
Bitcoin on-chain analysis, mining analysis, macro analysis; overview of 7/29/22-8/5/22
Blockware Intelligence Sponsors
If you are interested in sponsoring Blockware Intelligence email: sponsor@blockwaresolutions.com.
Blockware Solutions - Buy and host Bitcoin mining rigs to passively earn BTC by securing the network. Your mining rigs, your keys, your Bitcoin.
Know someone who would benefit from concierge service and world class expertise when buying Bitcoin? Give them one year of free membership in Swan Private Client Services ($3000 value) -- email blockwareHNW@swan.com and we’ll hook it up! (And yes, you can give it to yourself 🤣)
New Blockware Intelligence Report: “The Structure of Cyclical Markets”
We’re very excited to share the newest Blockware Intelligence research report titled “The Structure of Cyclical Markets: The Macro forces driving market cycles in Bitcoin and Traditional Assets”.
This report breaks down the overlying macroeconomic Short-Term Debt Cycle and examines how those monetary forces drive secular price movements in traditional financial assets. Furthermore, this report looks at Bitcoin to describe the similarities and differences that the newest financial asset’s cycles have to traditional ones.
Abstract:
All financial markets are driven by human behavioral dynamics, which is why similar patterns are repeated across markets, asset classes and time. These recurring patterns define the secular phases of the market cycle and create the foundation for examining the driving forces in every asset class through periods of expansion and contraction.
Utilizing the framework highlighted by this report, within the present macroeconomic context, can provide valuable signals to help investors more effectively allocate capital.
.
Summary
This week we saw layoffs announced from two of the nation’s biggest employers, Walmart and Amazon.
The San Francisco Fed’s President talked on Tuesday, injecting significant fear into the bond market.
The stock market continues its strength, but things are beginning to get overheated as we head towards July’s CPI announcement on August 10th.
According to the hash ribbon metric, Bitcoin is 59 days into a miner capitulation. The end of a miner capitulation historically marks a bear market bottom. There are signs that difficulty potentially bottomed.
Mining difficulty increased by 1.7%. Bearing no new low in the price of Bitcoin, it is possible that difficulty already bottomed.
RIOT made more money turning off their machines than running them during the month of July.
General Market Update
Overall, it’s been another strong week of equity price action following last week’s 75bps FFR hike and heading into CPI next week. One thing that has drawn lots of attention this week is the continuation of layoffs from large public companies.
Initial Jobless Claims (FRED)
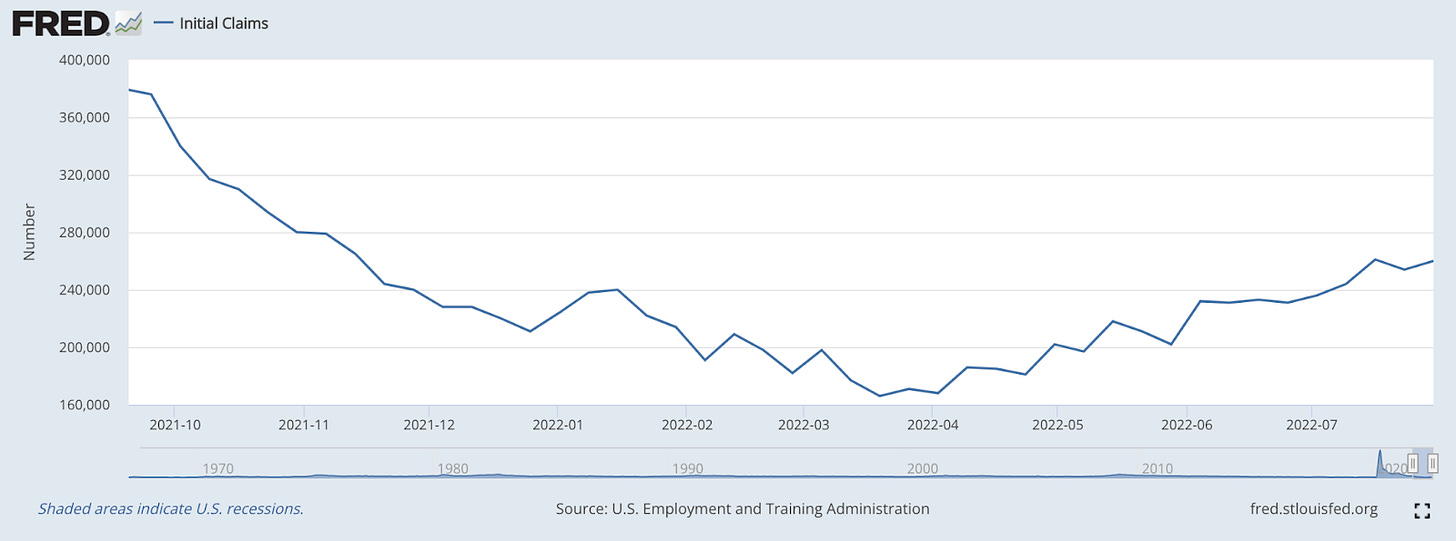
A new data point for Initial Jobless Claims was released by the ETA on 7/30 which showed a value only 1,000 below the YTD high of 261,000 (7/16). In case you don’t recall, IJC measures the amount of Americans who have filed for unemployment benefits for the first time following job loss.
This came alongside several companies announcing layoffs this week. On Wednesday it was Robinhood announcing that they’ve fired 23% of their workforce. But as we discussed in this newsletter three weeks ago, it’s most important to keep an eye on some of the biggest employers in the US, such as Amazon and Walmart.
This week Amazon announced that they’ve laid off 100,000 employees and Walmart announced 100’s of corporate layoffs. Watching the large employers is important for obvious reasons, they have the power to cause extreme changes to the nationwide employment landscape.
But what’s even more interesting to me is that in June more people quit their jobs than were fired, by a lot. This report released by the US Bureau of Labor Statistics shows that in June, 1.3M Americans were laid off and 4.2M voluntarily quit.
It’s honestly hard to make much sense of this. Of course, we’ve seen a trend of folks unwilling to work since the COVID lockdowns began in 2020, but with wide scale fear of recession, it’s certainly surprising to see Americans willingly putting themselves in financial uncertainty.
Friday morning we saw the release of July’s Jobs Report from the BLS. To the surprise of many, we saw an increase of 528,000 jobs across the month.
It’s definitely interesting to see different data points, or frameworks of viewing the market, saying different things. In our opinion, the job market remains quite strong but there are certainly reasons to believe that employment is softening, as we discussed last week.
On Wednesday, we heard from ISM about July’s data for the Services PMI. This is a survey of purchasing managers in the service industry on their current market outlook and sentiment.
July’s Services PMI came in at 56.7%, up from 55.3% in June. This was the 26th straight month of improving sentiment for service purchasing managers.
CEO Confidence Survey (GS)
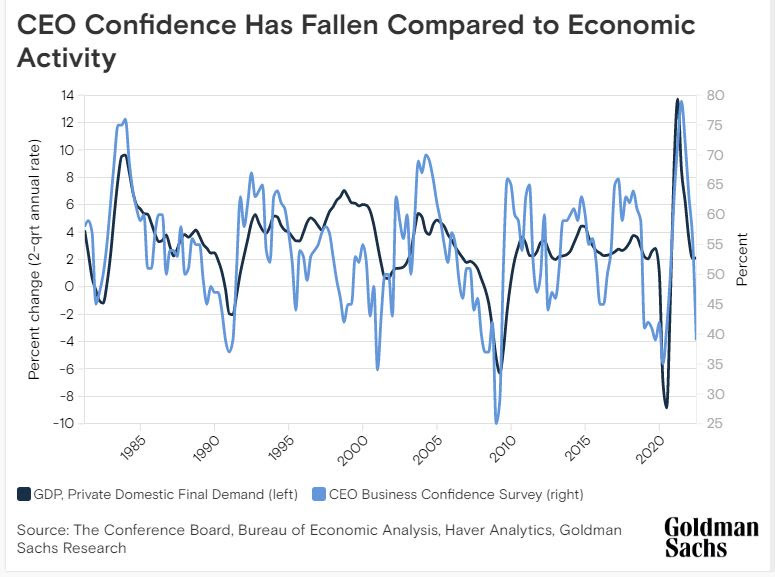
It’s pretty interesting to see that purchasing manager sentiment for the service sector has improved and CEO sentiment has declined. Above is a chart from Goldman Sachs that overlays a survey of CEO confidence alongside GDP.
This chart tells us that the confidence levels of US CEO’s is vastly lower than the decline in US economic output. As you can see, this is common during previous recessionary periods, such as 2008, 2000, and 1990.
It’s likely anyone's guess why there is a vast level of discrepancy between Service PMI and the CEO Confidence Survey, but it is certainly interesting.
On Thursday, the Bank of England increased their market interest rate by 50bps to 1.75%, this was the largest increase in their rates since 1995. The trend of increasing rates across the pond in England and the EU goes to show that it’s not just the US facing recessionary risk.
Supply-side issues have gripped the globe, and Europe has felt the effects that energy prices have on an economy first hand. The BoE is now predicting UK CPI inflation to peak at over 13% by October.
On Tuesday, in the fixed-income market, we saw a strong bounce in yields. This came alongside words from Mary Daly, the President of the San Francisco Fed.
While Daly doesn’t actually have FOMC voting rights, she was significantly more hawkish than Powell and it was certainly enough to move markets.
This was clearly an attempt to walk back Powell’s extremely dovish press conference from last Wednesday. As we’ve discussed in this newsletter previously, a bounce in the financial markets contradicts the attempt from the Fed to lower aggregate demand.
Daly’s tone was much less optimistic than the Chairman’s, saying things like: “The job on inflation is far from finished”, “I anticipate a slower economy”, and “I anticipate a modestly cooled-off labor market”.
US10Y Yield 1D (Tradingview)
As I just mentioned, these words were enough to cause a selloff in the bond market. This may come as a surprise to some, as Treasury securities are generally considered “risk-free safe haven” assets. But this is only true for economic slowdowns that have relatively lower inflation.
In the case of high inflation, the cash flows to be received by bond holders are being devalued, causing a sell off in bonds as the investment is less attractive. We’ve seen rising yields since July 2021 but as of mid-June, we’ve seen a fairly aggressive drop in yields.
In our opinion, this looks like the fixed-income market is wagering that inflation has peaked, or at least is not far from doing so. At the very least, bond investors appear confident in the ability of the central bank to bring down demand, and thus, prices.
So the bounce in yields, or drop in bond prices, on Tuesday appeared to be a reversal in this line of thinking. Yield action on Wednesday and Thursday tells us that investors were fairly eager to buy the dip, but it’s likely that we see yields continue to rise in the short-term.
Overall, falling yields bodes well for equities, as Treasury yields (specifically the 13wk or 10Y) are used as the discount rate for calculating the present value of stocks. When the “risk-free” market rate is lower, the expected future return of a specific equity is relatively higher.
10-year Treasury yields peaked on June 14th, and the Nasdaq Composite bottomed 2 days later (not saying the absolute bottom is in). Clearly throughout 2022, bond price action has been a fairly strong leading indicator of equity price action.
This week, we’ve seen a continuation of last week’s strength in the equity market. In my opinion, there are two key differences this week: individual names clearing above resistance levels, and market indexes reaching high levels of extension over key moving averages.
We can start by talking about the intra-base breakouts we’ve seen from a vast array of stocks this week. A key quote for equity investors to remember is that “it’s not a stock market, it’s a market of stocks”.
This week ,we’ve seen a variety of stocks able to pass above key resistance levels for the first time in this cycle. A few examples of names that are breaking resistance are: COIN, CELH, ENPH, BNTX, and UBER (there’s many more).
Throughout this bear cycle we’ve seen the index bounces led by the largest market capitalization names in the index, such as AAPL, MSFT, TSLA, AMZN, etc. But for a bottom to truly stick, what we need to see is an expansion of market breadth.
Market breadth refers to the numbers of names participating in a given market move. I like to equate breadth to the foundation the market stands on. When breadth is narrow, there aren’t many names propping up the index, thus increasing the probability that selling in any one large cap name could take down the whole index.
When breadth is wide, there are less potential individual points of fault, meaning that selling in a large cap name could be outweighed by buying in smaller cap names. One of my favorite breadth indicators is the McClellan Oscillator.
The McClellan Oscillator is essentially a MACD of the Advance/Decline Line. Basically, the MO looks at the proportion of names that are increasing vs. decreasing in price and then compares 2 different moving averages of that value.
More simply put, this indicator tells us the degree that market breadth is expanding or narrowing by comparing the trend in breadth in the short-term vs. longer-term. Essentially all you need to remember is that we want to see the McClellan Oscillator rising alongside index prices.
S&P 500 with McClellan Oscillator 1D (Tradingview)
As you can see above at the bottom, the McClellan Oscillator is signaling a significant improvement in breadth over the last few weeks. Rising breadth can work to return some confidence to investors as we see more and more names acting well.
That being said, the indexes are now fairly extended over moving averages and likely areas of support. To put it frankly, the market is due for a pullback or consolidation.
The S&P is now about 3.7% higher than its 21-day EMA, and 5.4% over its 50-day SMA. When it last peaked on March 29th, it was 4.4% extended over its 21-day and 5.0% over its 50-day.
Looking back over the last couple of years, it’s fairly rare for the index to get more than 3% over its 21-day and 5.0% over its 50-day. Generally speaking, once we get near or above those levels buyers quickly become exhausted.
That being said, it’s always possible that the market continues chugging higher, and a continued decline in bond yields and the US Dollar Index (DXY) would help fuel that move. But as I mentioned, it’s a market of stocks, so looking at the highest cap names can give us more insight into what the market MIGHT do.
As of Thursday’s close, AAPL sits 7.2% above its 21-day, MSFT is 5.6% extended from its 21D, TSLA is 13.5% over its 21D, AMZN is 14.3% over its 21D and GOOGL is 4.0% above its 21D.
It would be wise to remain open to all possibilities, but definitely be on the lookout for a pullback or consolidation heading into next week.
Also, note that July’s CPI data point will be released next week on the morning of Wednesday, August 10th.
Crypto-Exposed Equities
It’s been a very exciting week on the crypto-equity front with several big news events.
On Thursday, Coinbase announced a partnership to bring custody, brokerage and trading services to BlackRock’s clients. As of Thursday’s close, COIN is having its best week of all-time, with price up over 41%.
That being said, COIN is still down ~77% from its direct listing price of $381 from April 2021. But it’s certainly not bearish to see the largest asset manager in the US ($10T AUM) begin offering crypto services to their clients.
On Tuesday, MicroStrategy reported their Q2 earnings. While MSTR is not a crypto-native company, they did have some interesting things to say about their Bitcoin strategy.
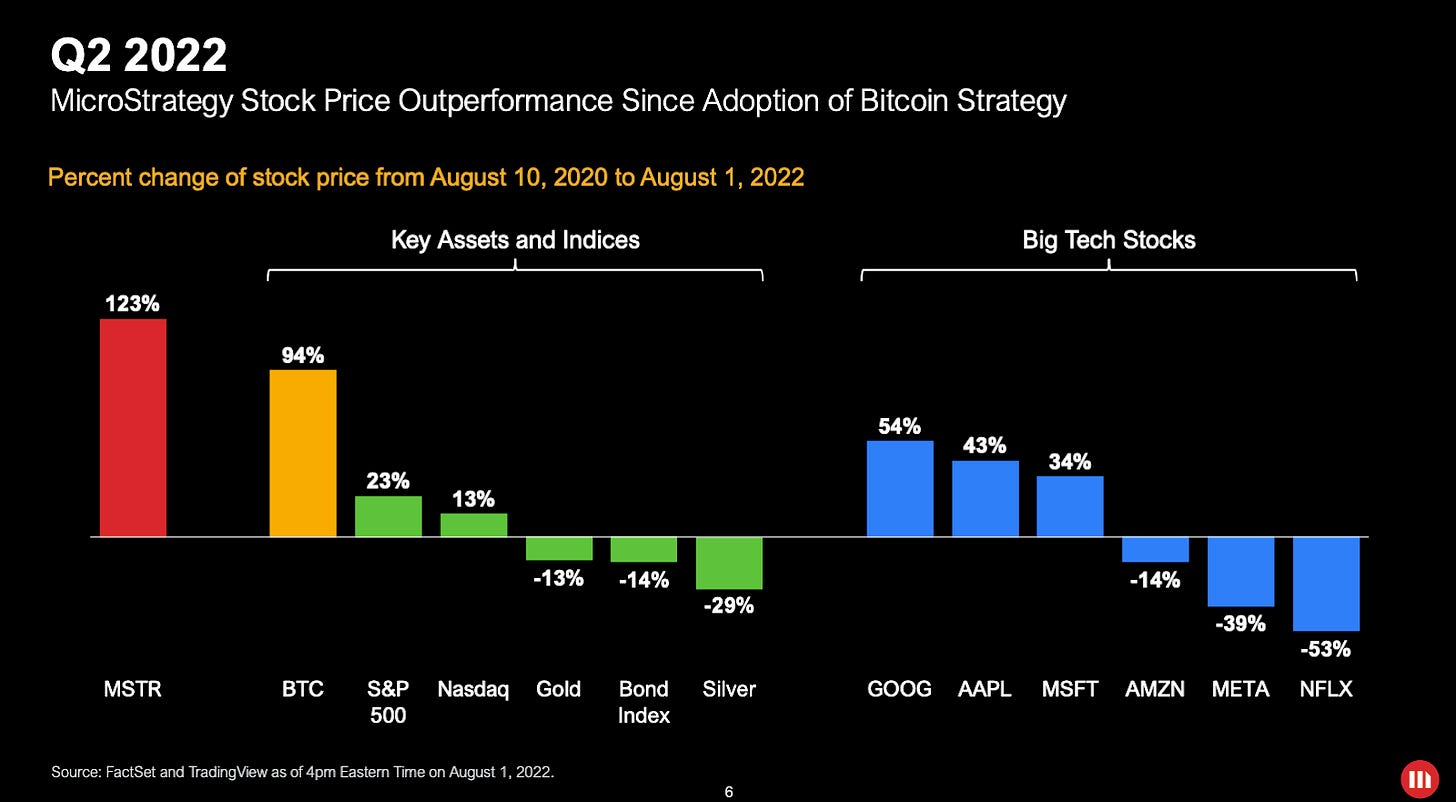
Specifically, I thought the above slide from their investor deck was interesting. Since becoming the first publicly traded company to move to the Bitcoin standard, they’ve outperformed several facets of the market.
The risk premium that comes alongside equity pricing has certainly been enough to propel MSTR’s stock price appreciation to above that of even Bitcoin.
But most notably from this presentation was the announcement that Michael Saylor will be stepping back from his role as Chief Executive Officer to transition into Executive Chairman. In my opinion, this was a great move by Saylor.
He now has the freedom to focus primarily on their Bitcoin strategy and education without being bogged down by MSTR’s day-to-day operations. MSTR stock was up nearly 13% the day following this news.
Moving on, we’ve seen some real signs of strength from several other crypto-equities. In my opinion, the strongest looking names are currently: CORZ, MSTR, RIOT, COIN, MARA, HIVE, and SI.
Core Scientific (CORZ) is a name that especially stands out to me this week. Last week news broke of a deal for CORZ to host 75MW of ASICs with an undisclosed party. CORZ expects this deal to generate about $50M in annual revenue once the hardware is fully deployed.
CORZ 1D (Tradingview)
Since June 30th, shares of CORZ have appreciated by 87.9%. Last week, following the 75MW hosting announcement, CORZ was up over 37% on the week. This is in comparison to MSTR’s 1.5%, COIN’s -11.1%, RIOT’s 2.8%, MARA’s 4.6%, and Bitcoin’s 3.2%.
Investors should note that, while nothing in this newsletter is investment advice, the downside reversal CORZ staged on Thursday alongside the extension over key moving averages makes it appear that a pullback is likely. Furthermore, the low share price and average daily dollar volume of $14.4M makes CORZ a fairly illiquid stock.
Above, as always, is the Excel sheet comparing the Monday-Thursday performance of several crypto-exposed equities to that of their average, Bitcoin and WGMI.
Bitcoin Mining
59 days into the Miner Capitulation
As mentioned in previous Blockware Intelligence Newsletters, hash ribbons (chart below) indicate when miner capitulations are occurring. The hash ribbons metric was created by Charles Edwards. Miner capitulations occur when a significant net % of miners turn off machines over an extended period of time.
The current miner capitulation began June 7th, 2022, and has lasted a significant amount of time. It’s important to note that miner capitulations are particularly relevant because it reveals that a large number of machines are no longer hashing. Since June 7th, other new generation mining rigs have likely been plugged in by both public and private mining companies. However, enough old generation machines or inefficient overleveraged miners have shut off, and hash rate and difficulty have actually decreased.
If there are no new lows in Bitcoin, we should expect the miner capitulation to end in August or September at the latest. In fact, it is possible that mining difficulty has already hit a bottom bearing no new lows in Bitcoin and US equities.
2018 Miner Capitulation
The most recent and most similar miner capitulation Bitcoin has seen was from the end of 2018. There have been other miner capitulations since, but they were all caused by external factors instead of a prolonged bear market (China mining ban, China rainy season, 2020 halving, and March 2020 liquidity crisis).
This previous miner capitulation from 2018 lasted 73 days, and it accurately identified a price bottom for Bitcoin.
If the current miner capitulation also lasts 73 days, that would put the end of this capitulation at August 19th, 2022. There are no guarantees that this capitulation will be the same, but it is reasonable to expect this capitulation to end before October as long as the price of Bitcoin doesn’t fall sharply further.
$RIOT earned $9.5M turning off mining rigs in July
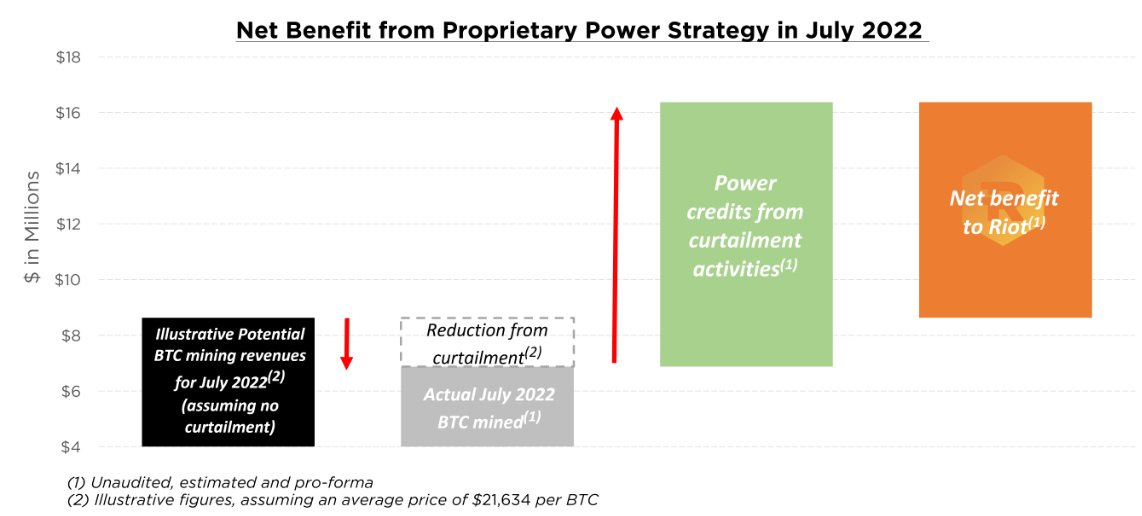
Previously, Bloomberg has covered how Bitcoin miners are adding resiliency to energy grids by acting as demand response entities that shut off when the grid is strained. RIOT is contracted to curtail its operations when demand for energy is high and supply is tight. This allows them to sell capacity back into the grid instead of mining Bitcoin. This is exactly what occurred during the month of July. RIOT’s machines only had 79% uptime during the month of July, but they earned more money while their machines were down.
Jason Les, CEO of RIOT said, “When applied to anticipated power costs for the month, the power credits and other benefits are expected to effectively eliminate Riot’s power costs for July, further enhancing the Company’s industry-leading financial strength amid a challenging macroeconomic environment for the industry.”
This chart in RIOT’s recent press release highlights the net benefit RIOT received from this curtailment. As Jason pointed out, this effectively enabled RIOT to mine Bitcoin for free during the month of July.
All content is for informational purposes only. This Blockware Intelligence Newsletter is of a general nature and does consider or address any individual circumstances and is not investment advice, nor should it be construed in any way as tax, accounting, legal, business, financial or regulatory advice. You should seek independent legal and financial advice, including advice as to tax consequences, before making any investment decision.


